


Trump’s ICE Tantrum Might be Driving Macro Trend Behind WLFI Token Price
World Liberty Financial (WLFI) is trading near $0.093 on March 21, down roughly 14% from its March 16 high of $0.108 — a drop that coincides with a sharp rise in exchange supply and a surge in on-chain transactions recording losses.
The decline now intersects with a fresh source of political risk: President Donald Trump’s March 21 Truth Social post threatening to deploy ICE agents to US airports. This statement escalates the ongoing DHS funding shutdown and adds macro uncertainty to a token directly tied to the Trump political brand.
WLFI Holders Are Likely Selling To Prevent Losses
Beginning on March 18, exchange supply spiked sharply upward to a local peak near $0.0475 on the normalized scale — representing approximately 120 million additional WLFI tokens entering exchanges — while price simultaneously fell from $0.108 to approximately $0.093.
The relationship is direct. As tokens move onto exchanges, the available sell-side pool expands. The velocity of this particular inflow — nearly the entire exchange supply accumulation happening within two trading days — points to coordinated or large-holder distribution rather than organic retail selling.
Meanwhile, exchange supply has remained elevated through March 20–21 even as price stabilized near $0.093, suggesting the selling pressure has not yet fully resolved.
Want more token insights like this? Sign up for Editor Harsh Notariya’s Daily Crypto Newsletter here.
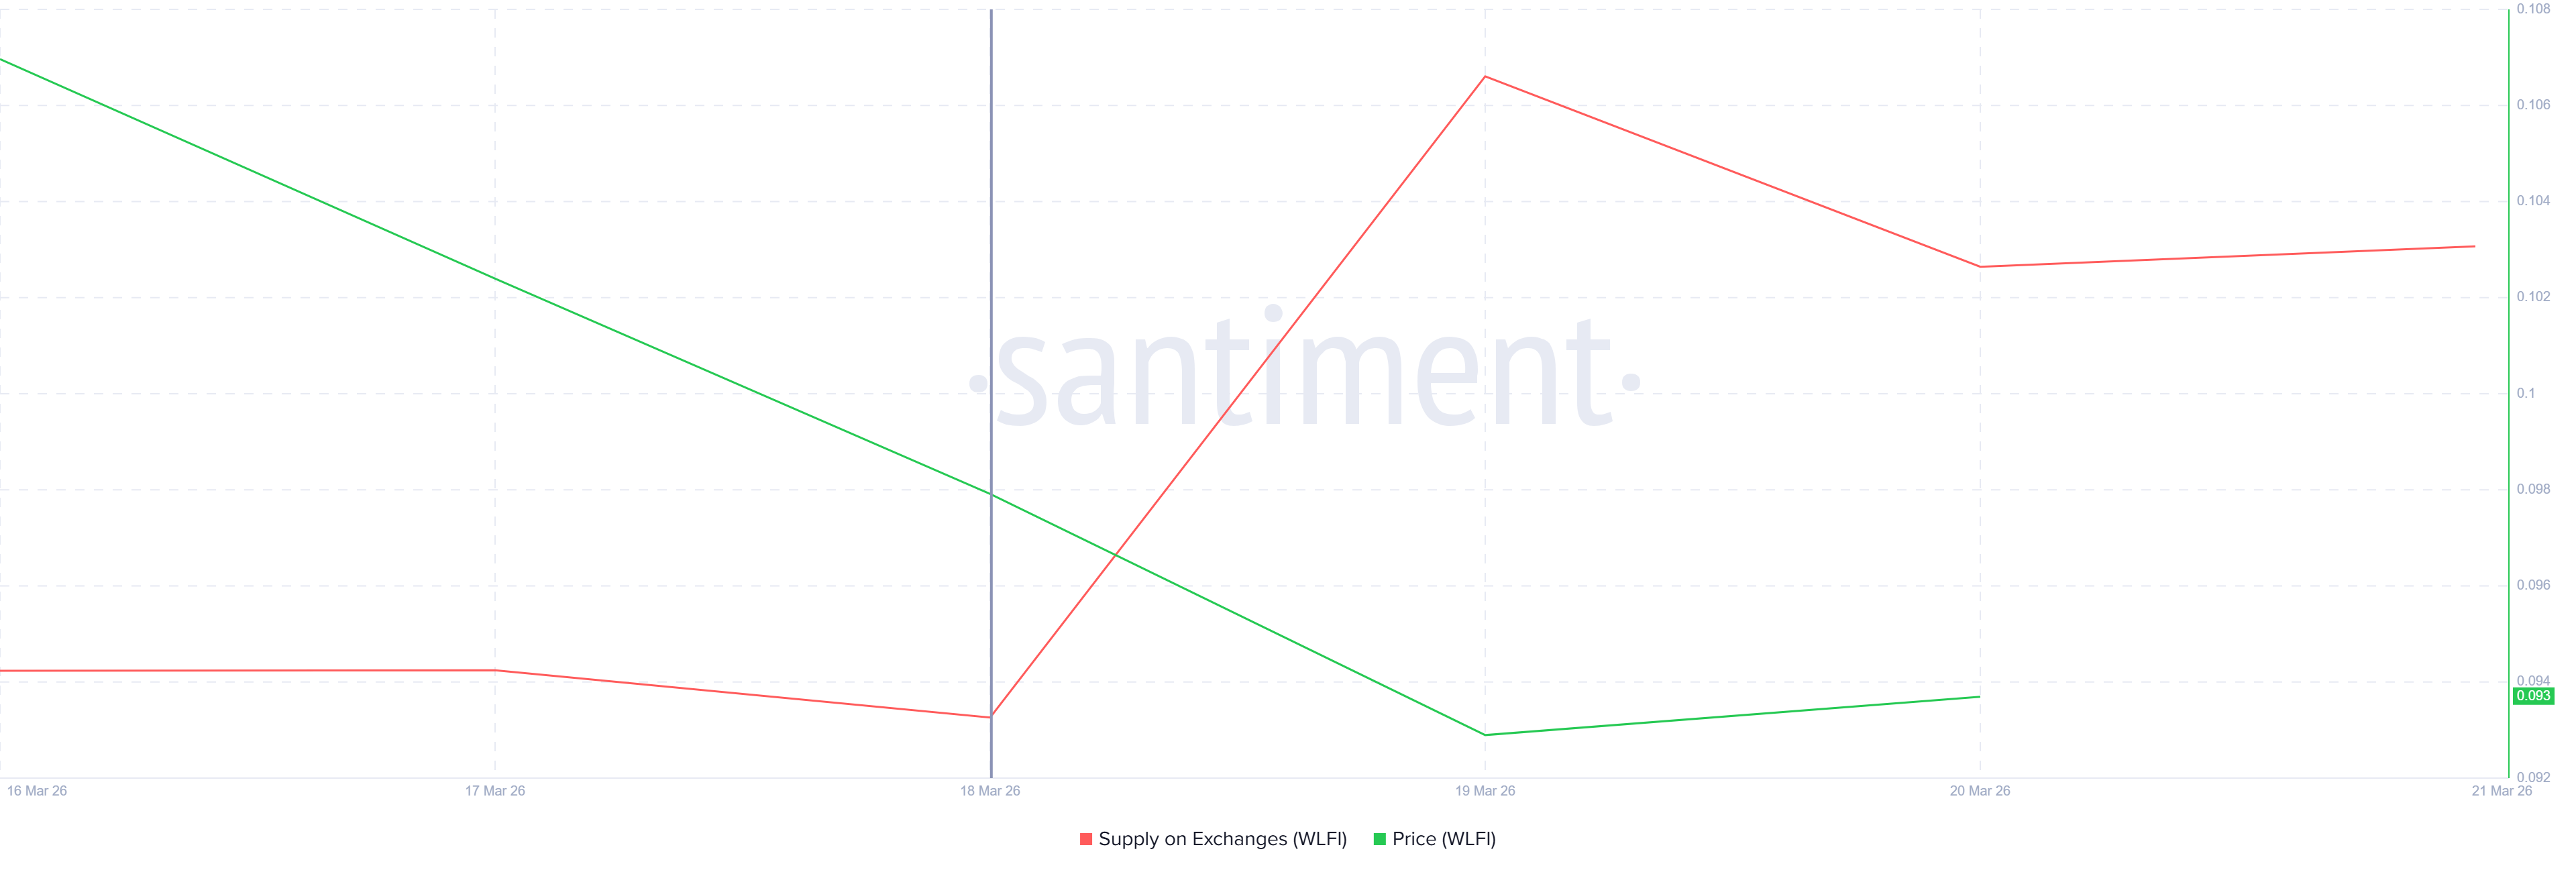 WLFI Exchange Balance. Source: Santiment
WLFI’s governance structure adds a layer of context. A recent proposal passed with 99.12% approval — but 76% of voting tokens came from just 10 wallets, meaning a small number of insiders retain concentrated control. When those wallets move tokens to exchanges, the impact on price is disproportionate to the number of addresses involved.
WLFI Sellers Are Mostly Underwater
Santiment’s daily on-chain transaction volume chart for WLFI, covering February 14 through March 21, shows the yellow bars (transaction volume in loss) dominating the chart for nearly the entire period.
The peak loss event occurred around February 20, when combined profit and loss volume exceeded 974 million WLFI in a single day, as the price was near $0.122.
The second-largest loss event in the chart appeared on March 7, when yellow bars reached approximately 805 million WLFI. The most recent notable reading, on March 19, shows yellow loss volume at approximately 920 million WLFI — the second-highest reading in the entire dataset — as WLFI price fell to its weekly low near $0.092.
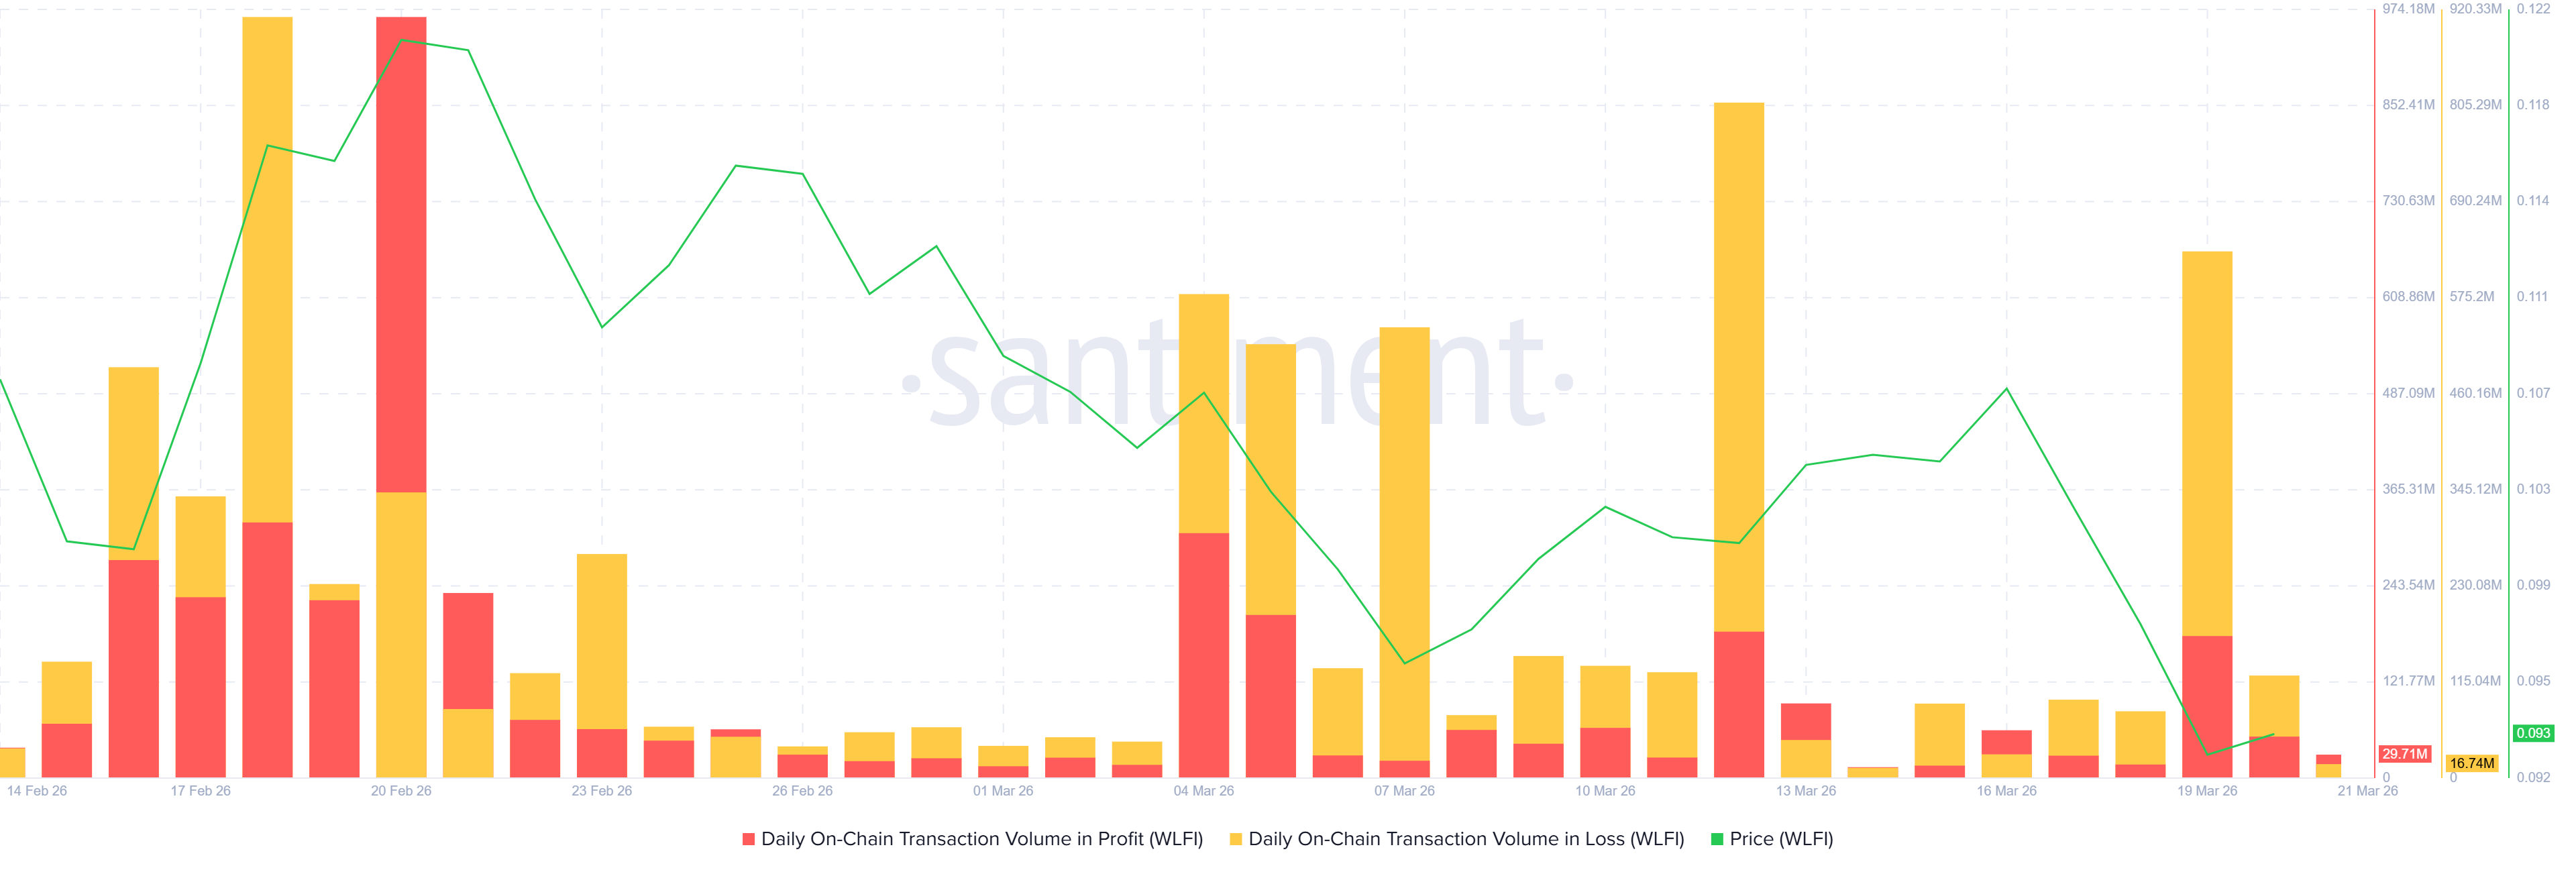 WLFI Transactions In Loss/Profit. Source: Santiment
Red profit volume on March 19 was just 29.71 million WLFI against 16.74 million in the most recent session. This confirms that the overwhelming majority of on-chain movement is happening at a loss.
High loss-volume spikes without a corresponding price recovery typically indicate that capitulation is occurring — but not yet complete. Each spike reflects holders moving coins acquired at higher prices and accepting losses to exit.
Until loss volume shrinks and profit volume begins to dominate, the on-chain data does not support a sustainable recovery.
WLFI Price Might Be Poised For a Breakdown
The WLFI price at $0.0947 is inside a descending wedge pattern. Two converging blue trendlines frame the structure: a declining upper resistance connecting the January 24 high near $0.1400 to the current resistance near $0.1000. This is followed by a lower support connecting the February 5 low near $0.0971 to the current price.
This pattern’s measured move projects a decline toward approximately $0.0691. This level sits between the 1.236 Fibonacci level at $0.0773 and the 1.382 level at $0.0651.
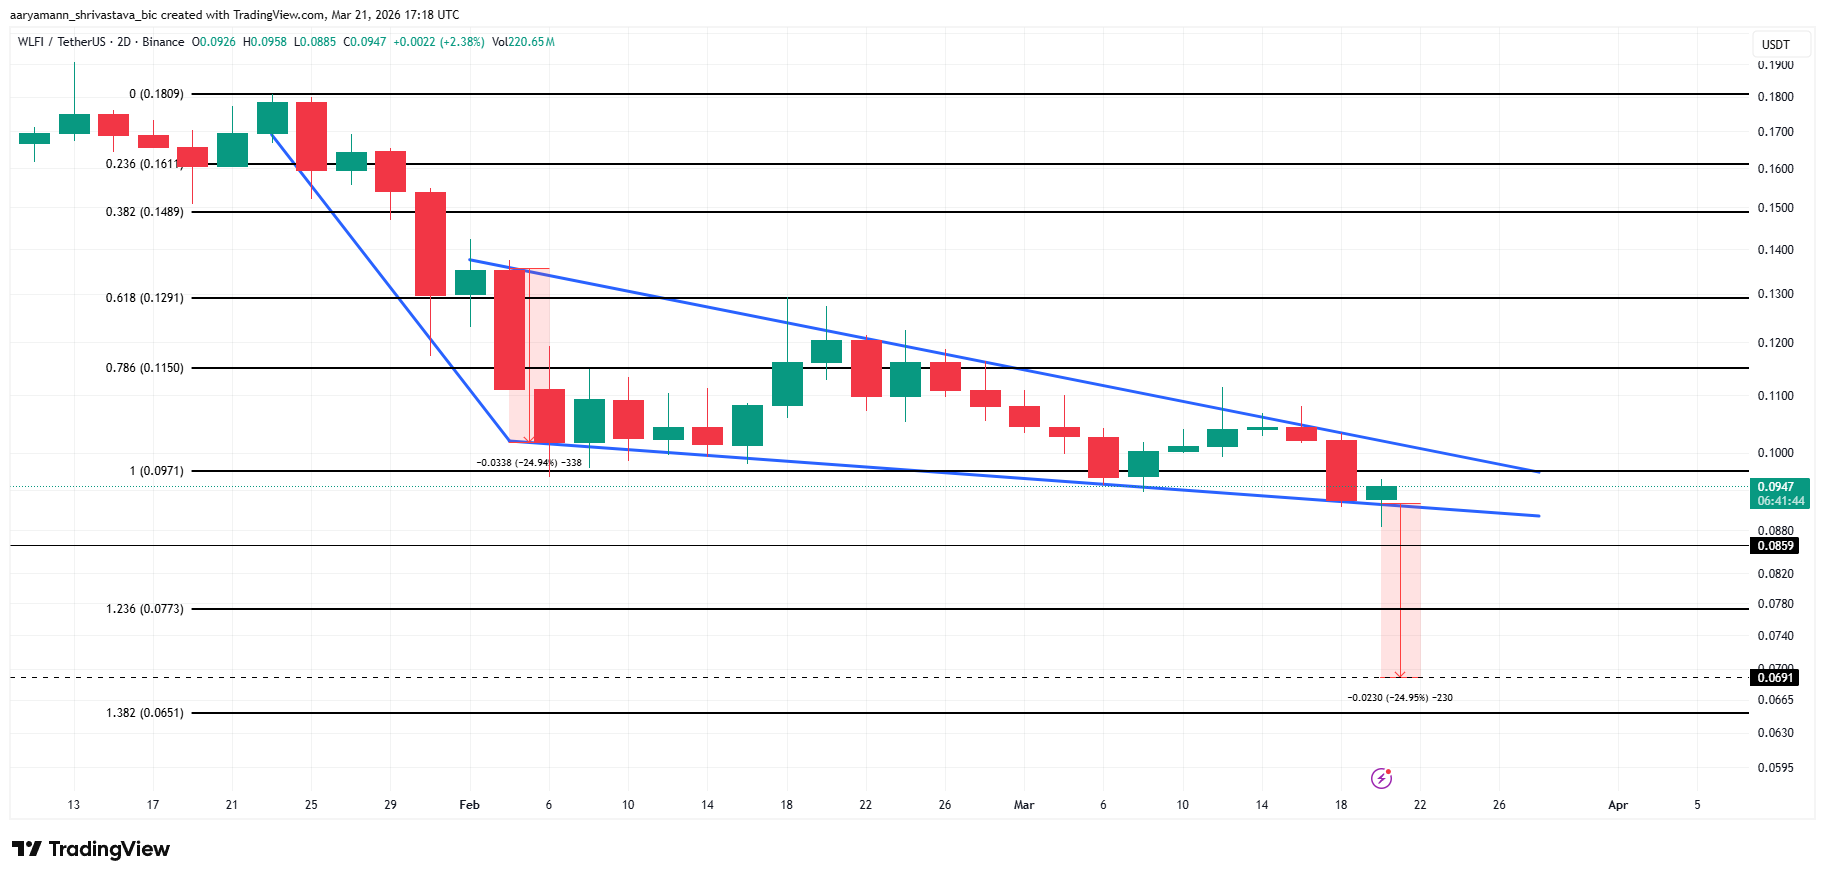 WLFI Price Analysis. Source: TradingView
Fibonacci support structure below the current price places the 1.0 level at $0.0971 and the 1.236 level at $0.0773. WLFI price, currently trading at $0.0947, sits marginally below the Fibonacci 1.0 level. This reading has historically confirmed a bearish structure when the price fails to reclaim it.
A daily close above $0.1000 would begin to neutralize the descending wedge and shift the near-term structure back toward neutral. Without that reclaim, the chart’s measured move and the exchange supply overhang both point toward the $0.077–$0.069 zone.
Recommended Articles


