


XRP Price Forecast: Upside looks limited even as Ripple doubles down on ecosystem funding
- XRP slides below the $1.40 pivotal level as headwinds trim weekly gains across the crypto market.
- Ripple shifts toward a more distributed funding model to support ecosystem builders across multiple channels.
- Retail demand for XRP remains low, with futures Open Interest at its lowest level since January 2025.
Ripple (XRP) declines for the second consecutive day, trading around $1.38 at the time of writing on Friday. The ongoing correction comes on the heels of a bullish reversal from a weekly low of $1.31 on Tuesday, which stalled at $1.49 on Wednesday.
Ripple announces changes for builder funding in 2026
Ripple is shifting toward a new funding model that gives ecosystem builders access to support across multiple channels. The issuer of the XRP token and the RLUSD stablecoin said in a statement released on Thursday that starting in 2026, builders will access funding through a distributed model.
The new model creates an environment where independent organisations, venture partners, regional hubs, and community-led initiatives support builders at scale.
Ripple appears to be preparing to launch both new and expanded initiatives in 2026, such as the FinTech Builder Program, designed to support startups building institutional-grade financial products on the XRP Ledger (XRPL). The products span stablecoin payments, credit infrastructure, tokenization, and regulated financial services.
Retail demand wanes as XRP falters
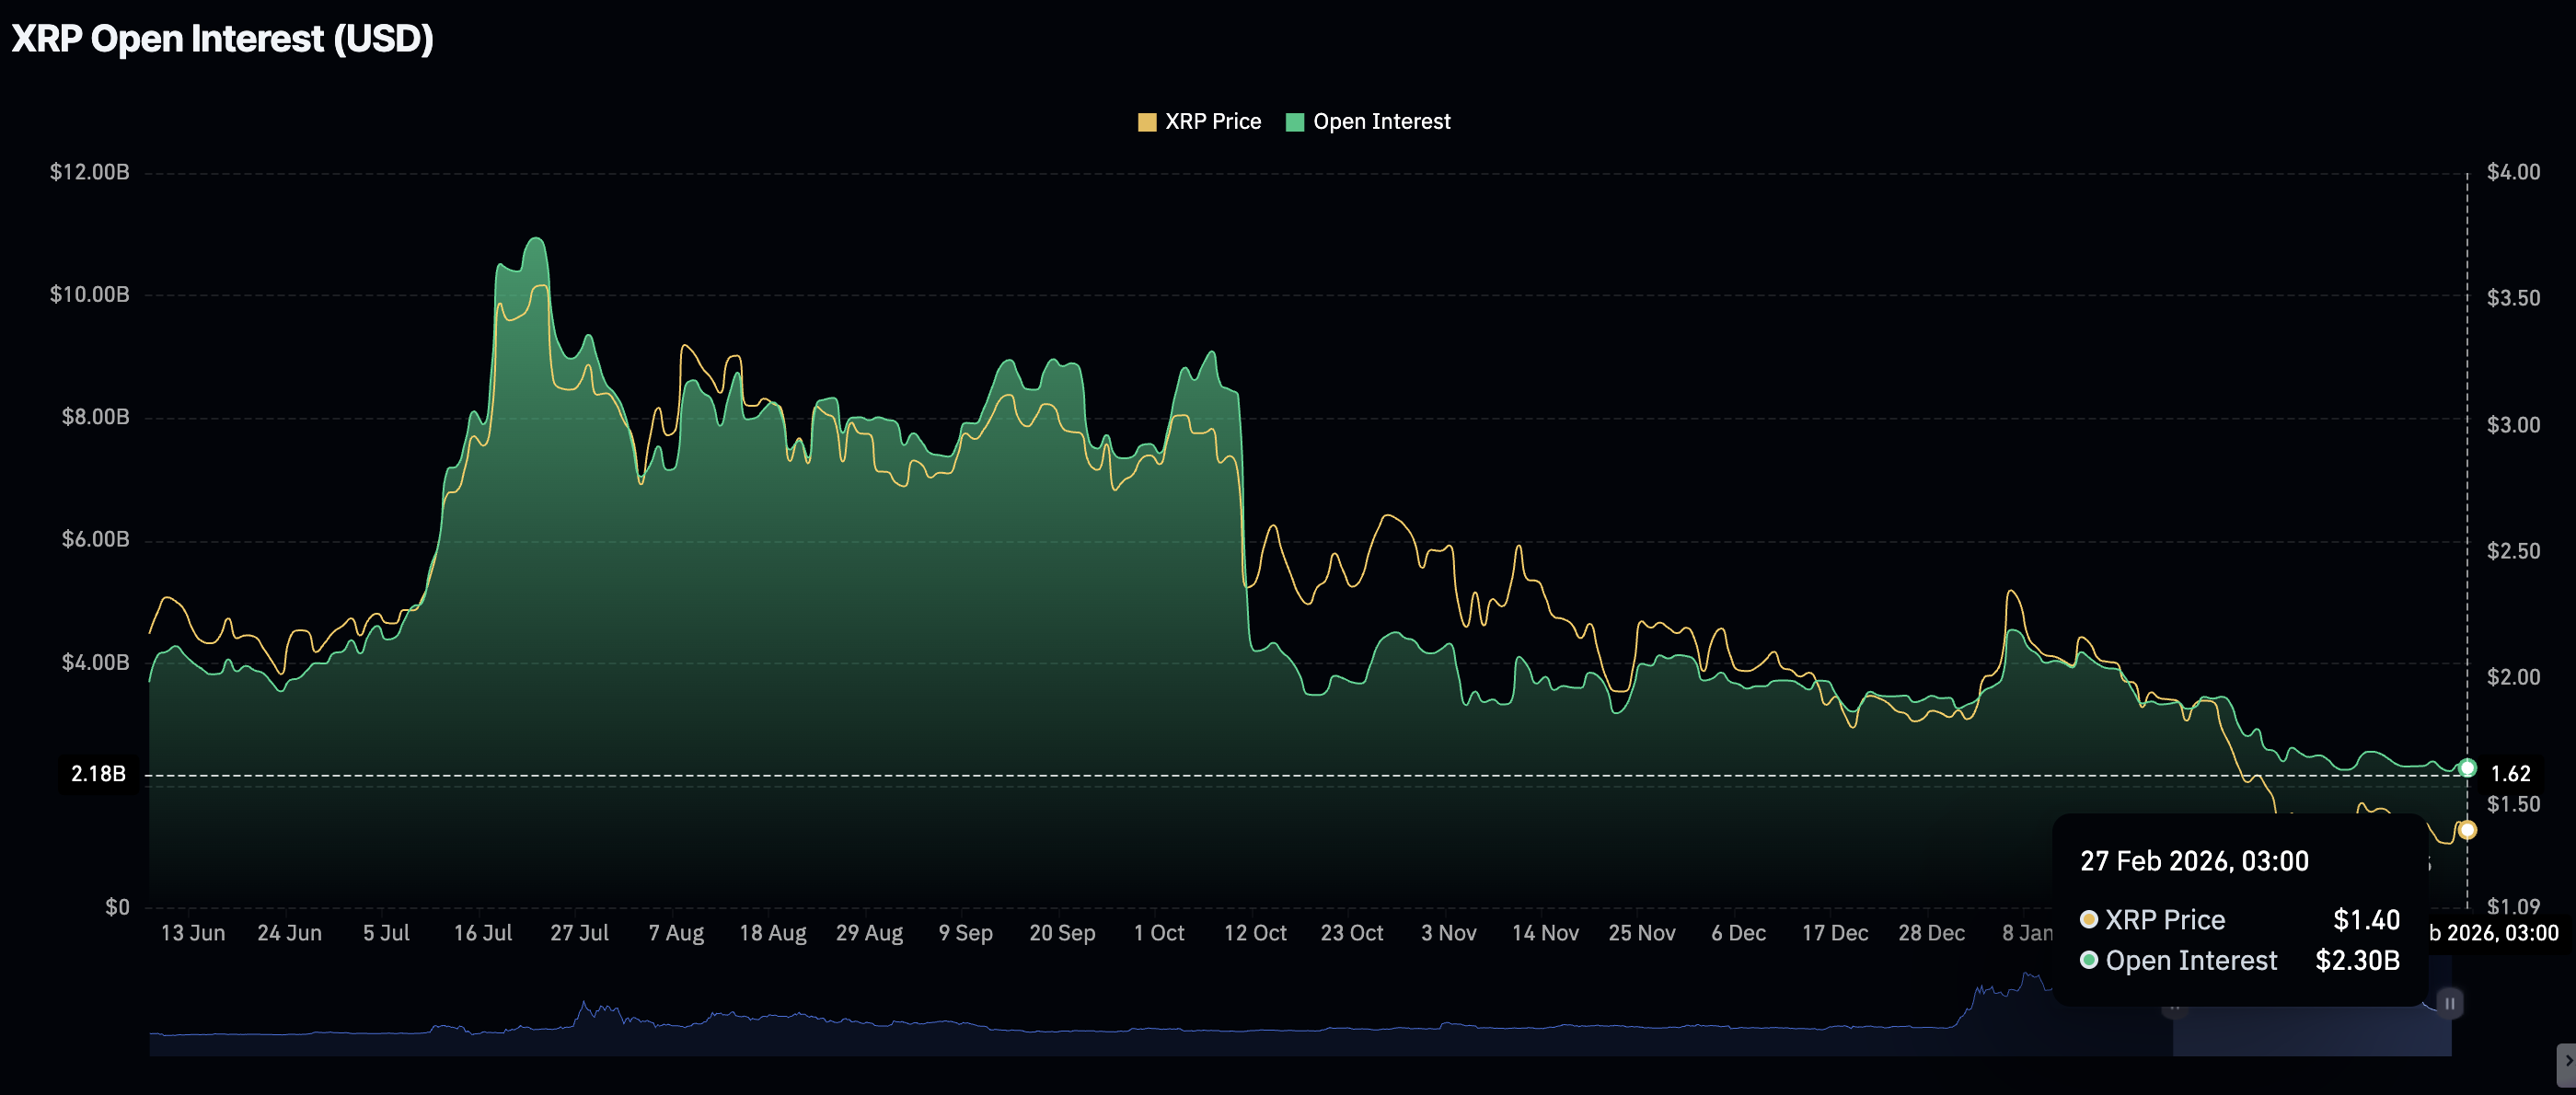
Retail investor interest in XRP has persistently declined, as evidenced by a decline in derivatives activity. The downtrend in futures Open Interest (OI) to $2.30 billion on Friday, from $2.35 billion the previous day, is a concern for the derivatives market. The OI is at its lowest level since January 2025.
In contrast, OI hit a record $10.94 billion in July, coinciding with XRP reaching $3.66, its current all-time high. A steadily declining OI suggests that investors are unwilling to lean into risk and would rather close positions than open new ones.
XRP technical outlook: XRP faces renewed downside pressure
XRP trades around $1.38 with the near-term bias mildly bearish. The price holds well below the 50, 100, and 200-day Exponential Moving Averages (EMAs), which are clustered between $1.62 and $2.06. All three moving averages are sloping lower, keeping the broader trend under pressure despite the recent bounce from a weekly low at $1.31.
The Moving Average Convergence Divergence (MACD) indicator holds above its signal line on the daily chart, while the green histogram bars are contracting, suggesting a modest bullish influence within a larger downtrend.
Still, the Relative Strength Index (RSI) around 40 remains below the neutral 50 line on the same chart, indicating oversold conditions and reinforcing downside momentum toward support at $1.31.
-1772196496097-1772196496104.png)
Initial resistance emerges at $1.54, aligning with the February 6 high, while the 50-day EMA lines up to cap rebounds at $1.62. A break above this supply cluster could open the door to a larger breakout targeting the 100-day EMA at $1.83 and later the 200-day EMA at $2.06.
Open Interest, funding rate FAQs
Higher Open Interest is associated with higher liquidity and new capital inflow to the market. This is considered the equivalent of increase in efficiency and the ongoing trend continues. When Open Interest decreases, it is considered a sign of liquidation in the market, investors are leaving and the overall demand for an asset is on a decline, fueling a bearish sentiment among investors.
Funding fees bridge the difference between spot prices and prices of futures contracts of an asset by increasing liquidation risks faced by traders. A consistently high and positive funding rate implies there is a bullish sentiment among market participants and there is an expectation of a price hike. A consistently negative funding rate for an asset implies a bearish sentiment, indicating that traders expect the cryptocurrency’s price to fall and a bearish trend reversal is likely to occur.
(The technical analysis of this story was written with the help of an AI tool.)
Recommended Articles


