


Silver Price Forecast: Bearish bias holds as XAG/USD struggles below $75
- Silver weakens as a stronger USD and rising Oil weigh on sentiment.
- Rising energy costs boost inflation risks, reducing chances of Fed rate cuts.
- Technicals show bearish bias with price struggling below the 100-day SMA.
Silver (XAG/USD) trades with a downside bias on Thursday, coming under pressure as macro headwinds stemming from the ongoing US–Israel war with Iran weigh on sentiment. At the time of writing, XAG/USD is trading around $72.82, down nearly 3.0% on the day after briefly slipping below the $70 handle during the European session.
The decline comes as rising geopolitical tensions in the Middle East continue to support the US Dollar (USD), while higher Oil prices fuel inflation concerns and reinforce expectations for a tighter monetary policy stance across major central banks, particularly the Federal Reserve (Fed).
Expectations that the Fed will keep interest rates higher for longer and delay rate cuts are weighing on the non-yielding metal, offsetting its appeal as a safe-haven asset.
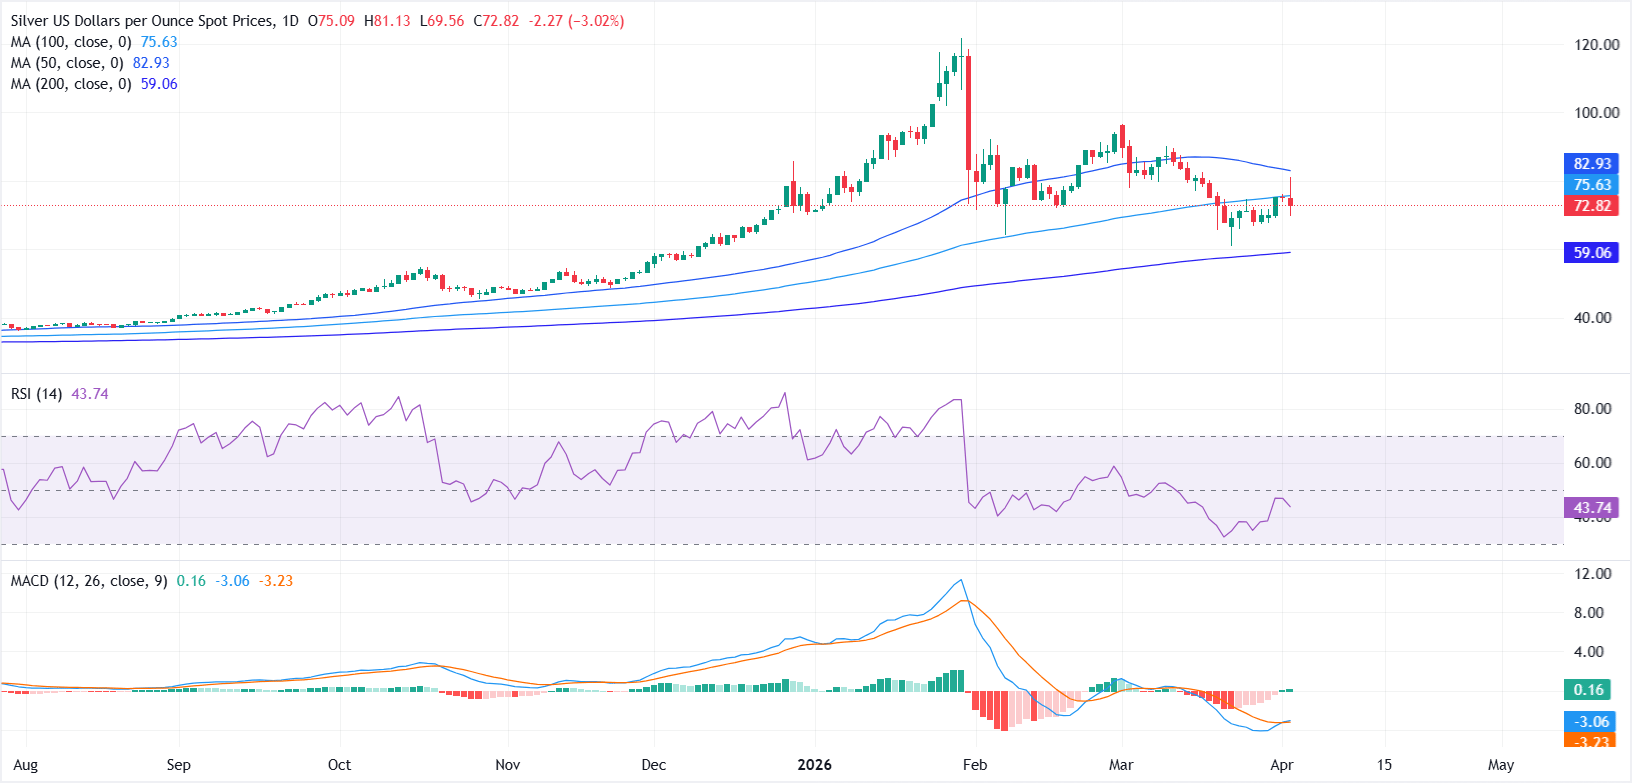
From a technical perspective, XAG/USD remains bearish in the near term, with repeated rejection at the 100-day Simple Moving Average (SMA) around $75.63 capping upside attempts. However, the pair continues to hold above the 200-day SMA at $59.06, indicating that the broader uptrend remains intact despite the recent weakness.
The Relative Strength Index (RSI) at 43.64 remains below the 50 mark after approaching oversold territory, indicating weak momentum. Meanwhile, the Moving Average Convergence Divergence (MACD) indicator (12, 26, 9) has moved back above its signal line. Still, it remains below the zero line, suggesting only modest upside attempts within a still-negative momentum backdrop.
Initial resistance is seen at the 100-day SMA around $75.60, with a daily close above this level opening the door toward the 50-day SMA near $82.90. A stronger recovery could then face an additional hurdle at the February swing high around $96.62.
On the downside, immediate support lies in the $70-$68 zone, followed by the March low near $61.01, which closely aligns with the 200-day SMA.
Silver FAQs
Silver is a precious metal highly traded among investors. It has been historically used as a store of value and a medium of exchange. Although less popular than Gold, traders may turn to Silver to diversify their investment portfolio, for its intrinsic value or as a potential hedge during high-inflation periods. Investors can buy physical Silver, in coins or in bars, or trade it through vehicles such as Exchange Traded Funds, which track its price on international markets.
Silver prices can move due to a wide range of factors. Geopolitical instability or fears of a deep recession can make Silver price escalate due to its safe-haven status, although to a lesser extent than Gold's. As a yieldless asset, Silver tends to rise with lower interest rates. Its moves also depend on how the US Dollar (USD) behaves as the asset is priced in dollars (XAG/USD). A strong Dollar tends to keep the price of Silver at bay, whereas a weaker Dollar is likely to propel prices up. Other factors such as investment demand, mining supply – Silver is much more abundant than Gold – and recycling rates can also affect prices.
Silver is widely used in industry, particularly in sectors such as electronics or solar energy, as it has one of the highest electric conductivity of all metals – more than Copper and Gold. A surge in demand can increase prices, while a decline tends to lower them. Dynamics in the US, Chinese and Indian economies can also contribute to price swings: for the US and particularly China, their big industrial sectors use Silver in various processes; in India, consumers’ demand for the precious metal for jewellery also plays a key role in setting prices.
Silver prices tend to follow Gold's moves. When Gold prices rise, Silver typically follows suit, as their status as safe-haven assets is similar. The Gold/Silver ratio, which shows the number of ounces of Silver needed to equal the value of one ounce of Gold, may help to determine the relative valuation between both metals. Some investors may consider a high ratio as an indicator that Silver is undervalued, or Gold is overvalued. On the contrary, a low ratio might suggest that Gold is undervalued relative to Silver.
Recommended Articles


