


Solana Pins Its $75 Support on Short-Term Buyers — Can Price Survive This Risky Setup?


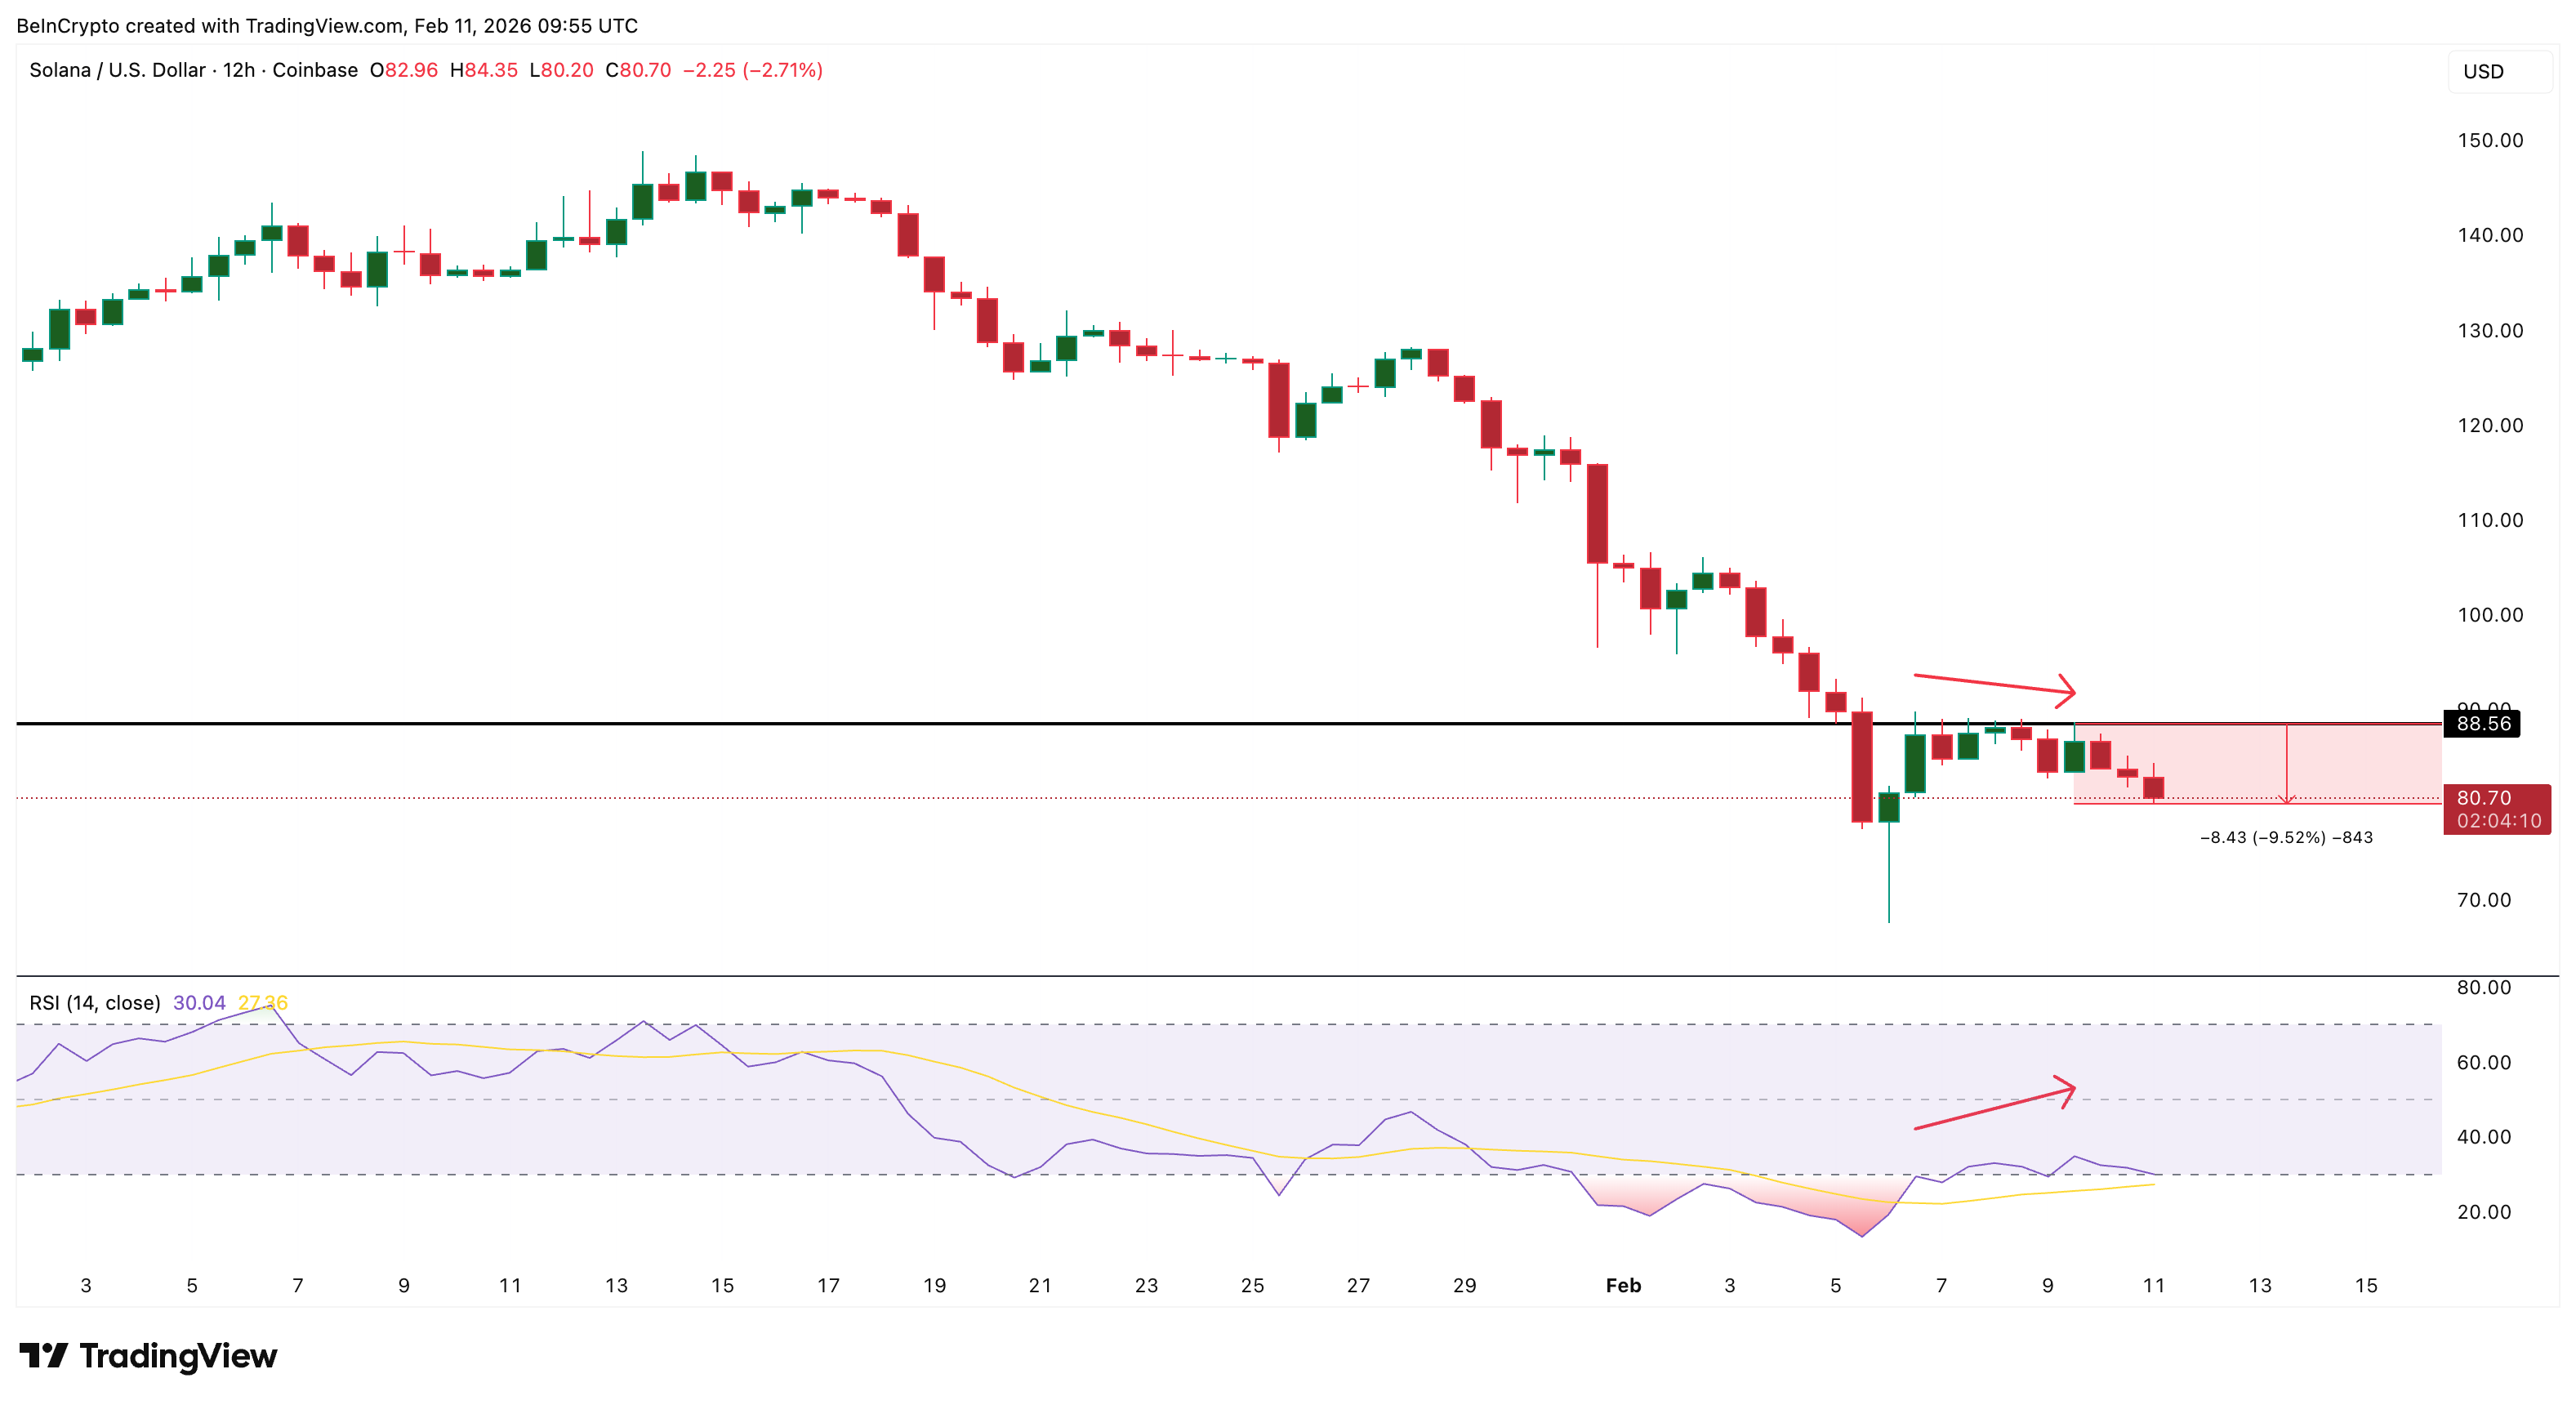
Solana has entered a corrective phase after failing to hold its recent rebound. The token peaked near $88 on February 8 before slipping into a steady pullback. Since then, the Solana price has dropped nearly 10%, with selling pressure increasing over the past 24 hours.
While this decline does not yet signal a full trend reversal, technical and on-chain data suggest that the current correction is being shaped by weak market participation. With short-term traders stepping in, Solana is now relying heavily on buyers near $75 to prevent deeper losses. The question is whether the speculative capital that often exits quickly can actually defend the key support level.
Hidden Bearish Divergence and Exchange Flows Triggered the Pullback
The first warning appeared on the 12-hour chart, just a few trading sessions back.
Between February 6 and February 8, Solana formed a lower high near $88, while the Relative Strength Index (RSI) made a higher high. RSI measures momentum by tracking buying and selling strength. When price makes lower highs while RSI makes higher highs, it signals a hidden bearish divergence. This pattern suggests weakening momentum beneath the surface, even when prices appear stable.
Want more token insights like this? Sign up for Editor Harsh Notariya’s Daily Crypto Newsletter here.
Shortly after this divergence formed, SOL began to pull back.
Selling pressure intensified as exchange flows shifted sharply. Exchange Net Position Change tracks whether coins are moving onto or off exchanges over 30 days. When it turns positive, it means more tokens are being deposited for potential selling.
On February 9, this metric showed net outflows of around −538,878 SOL, indicating buying pressure. By February 10, it flipped to net inflows of about +245,691 SOL. This sudden reversal signaled rising sell-side activity.
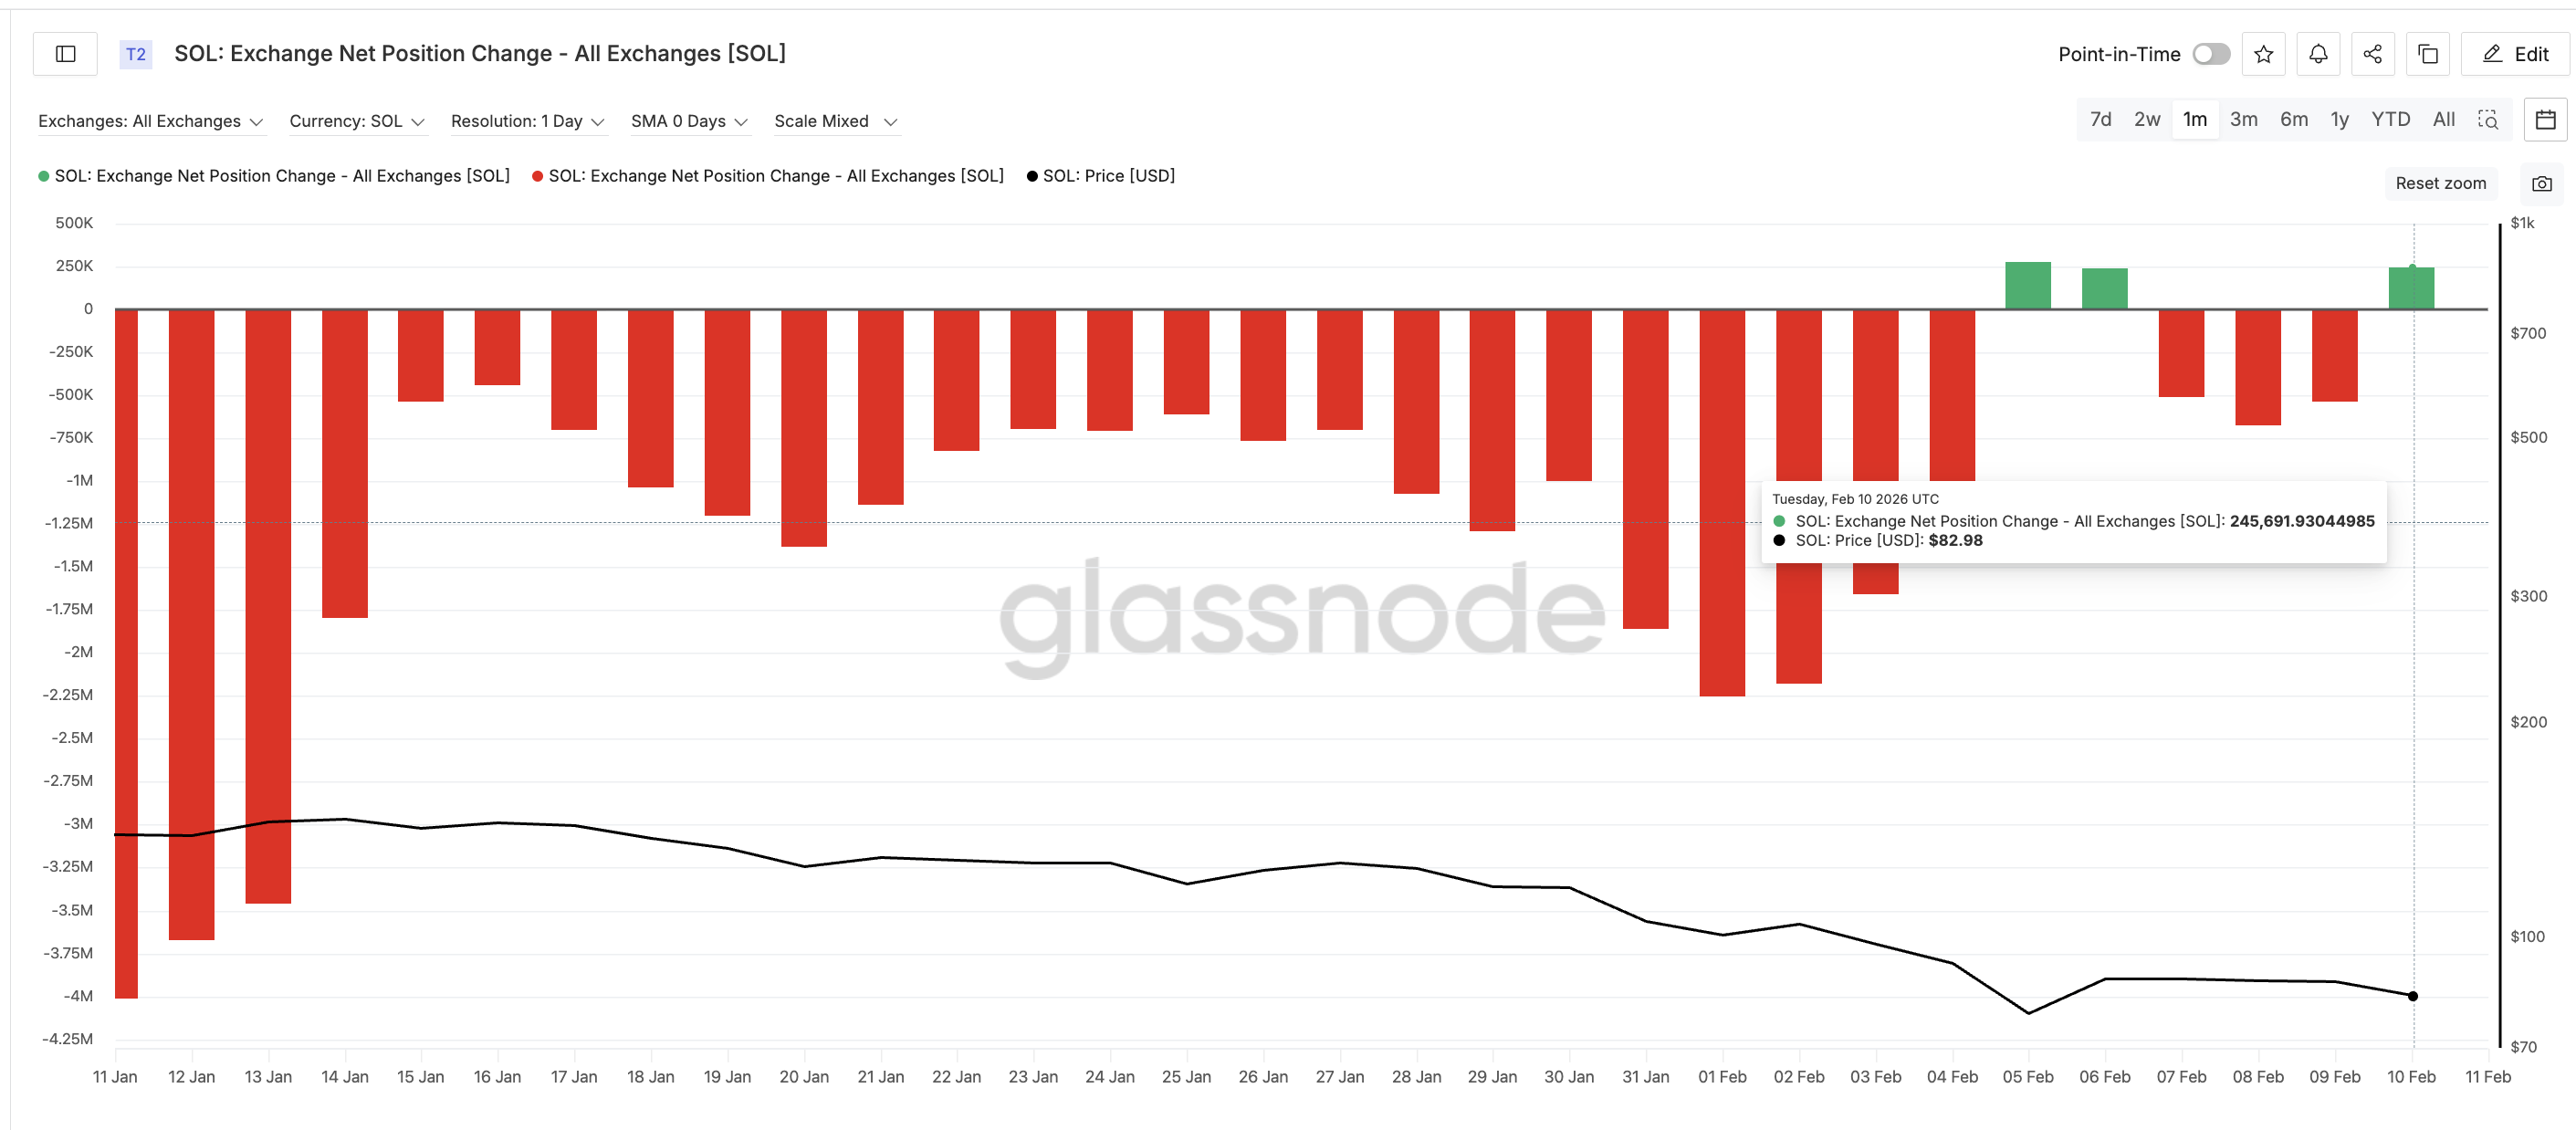
This shift explains why Solana fell more than 4% over the past day and continued weakening after February 8. Technical weakness and rising exchange deposits combined to accelerate the correction.
Short-Term Buyers Are Absorbing Supply
Despite rising exchange inflows, not all market participants are selling. However, the group stepping in raises concern.
HODL Waves Data shows that the one-day-to-one-week holding cohort has been increasing its share of the supply. These wallets represent very short-term traders who typically enter during pullbacks and exit quickly. The HODL Waves metric segregates wallets based on the holding timeframe.
Between February 8 and now, this cohort’s share rose from about 5.39% to 6.81%. That is a sharp rise in speculative participation.
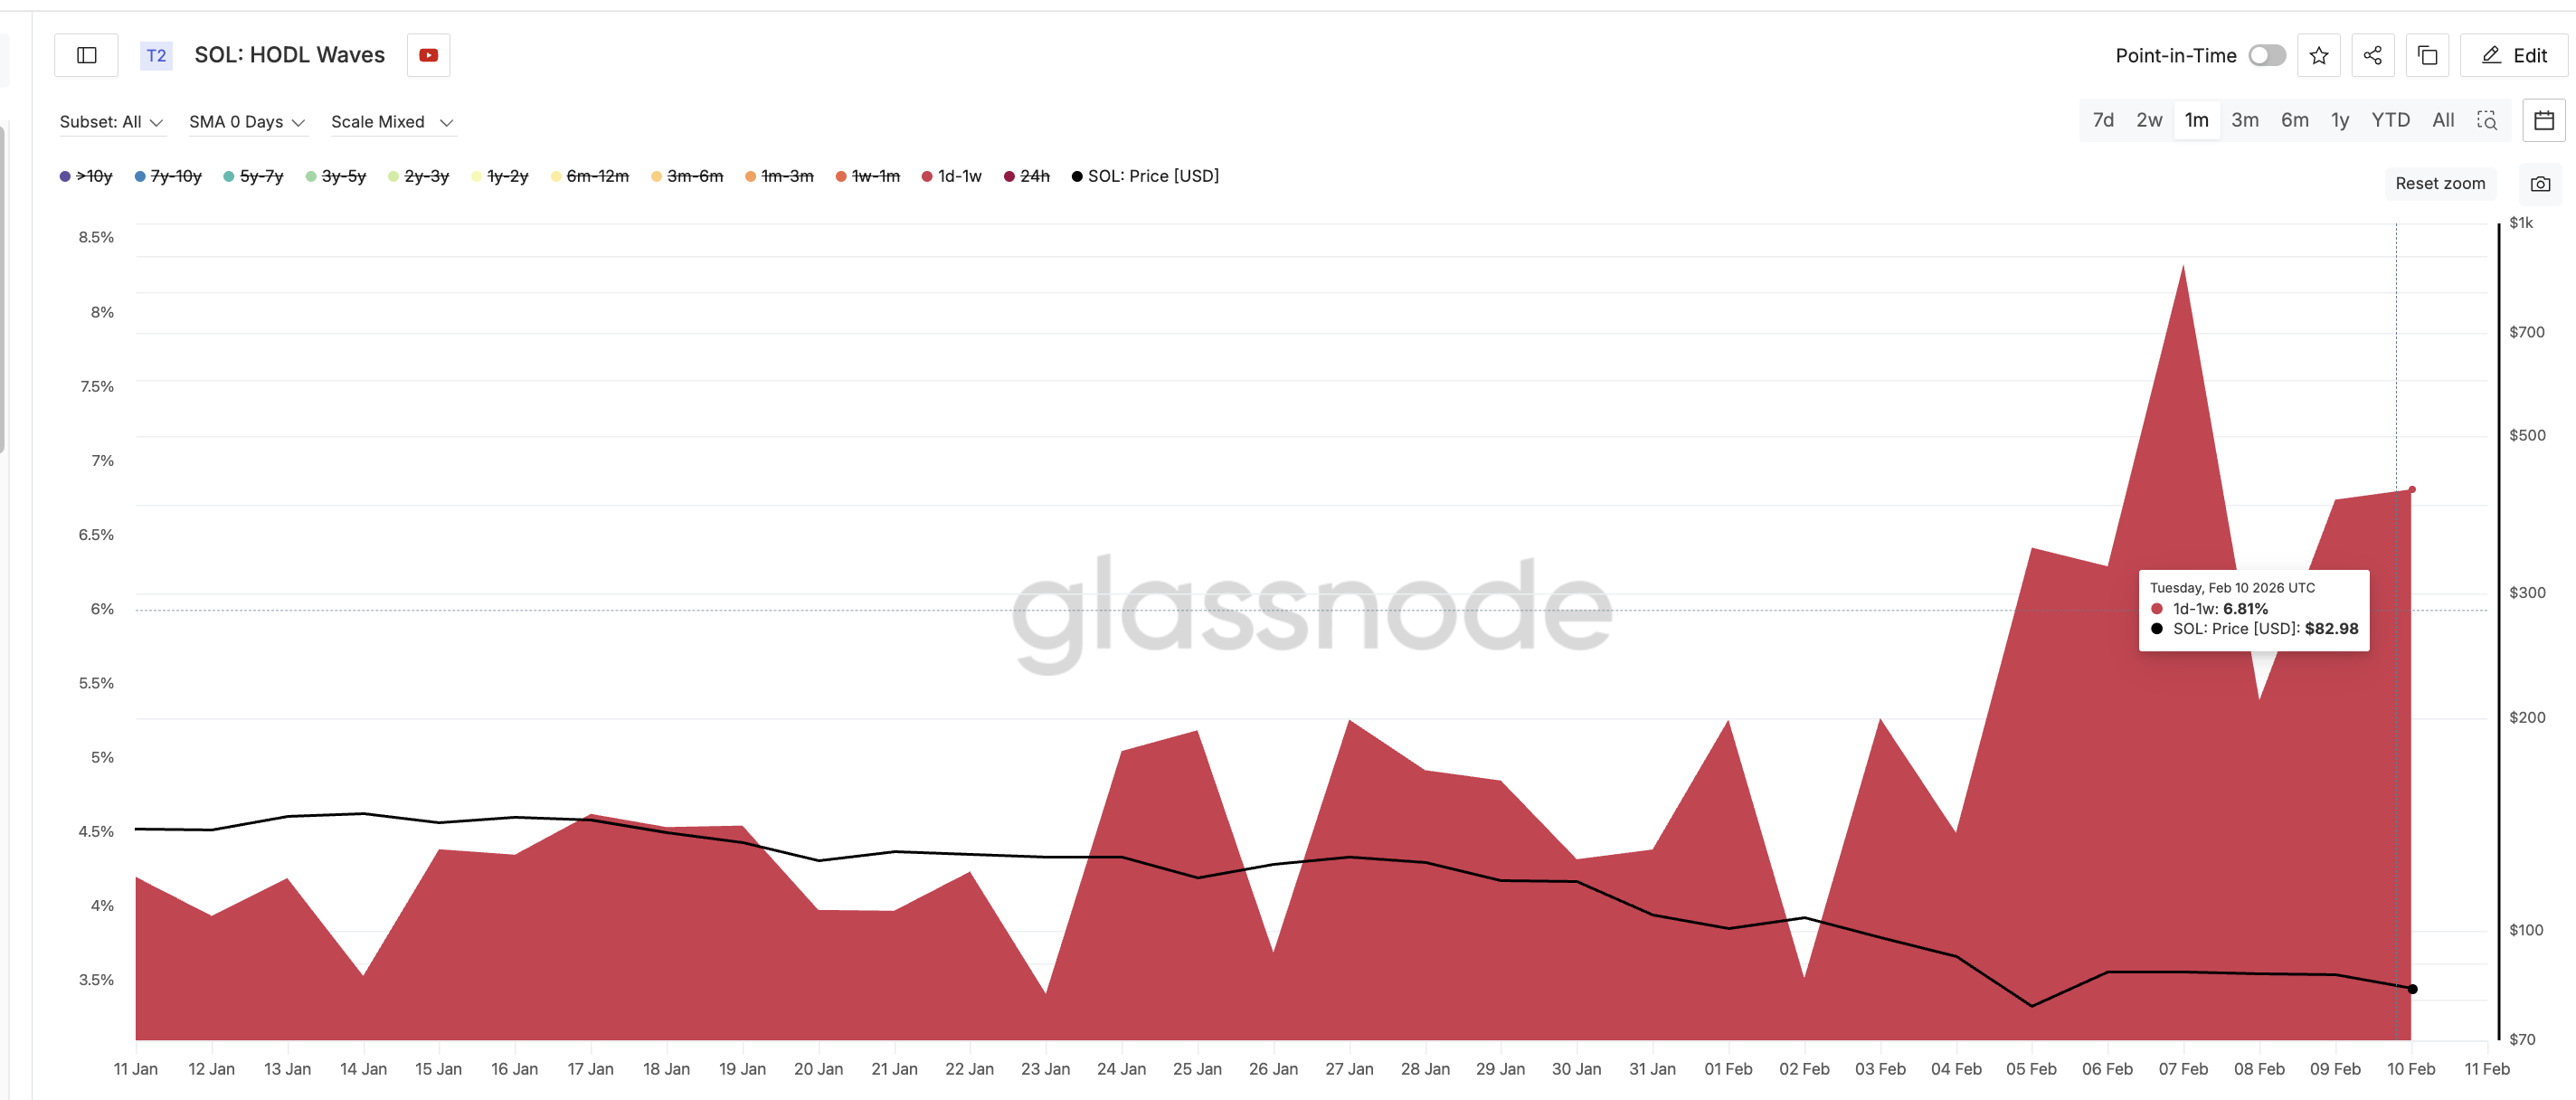
Historically, this group has struggled to provide lasting support. For example, on January 27, short-term holders controlled around 5.26% of the supply when SOL traded near $127. By January 30, their share fell to 4.31% after selling, and the price dropped about 8%. Similar behavior is now emerging again.
This shows that current dip buying is being led by reactive traders.
At the same time, Profit and Loss data shows limited incentive to sell immediately. Net Unrealized Profit/Loss (NUPL) for short-term holders remains in the capitulation zone. NUPL compares the current price to the average purchase price to measure whether holders are in profit or loss.
On February 5, short-term NUPL was near −0.95, indicating heavy losses. It improved to −0.69 during the rebound, then slipped back to around −0.76 after the latest drop. This suggests many recent buyers are still underwater and may hesitate to sell immediately.
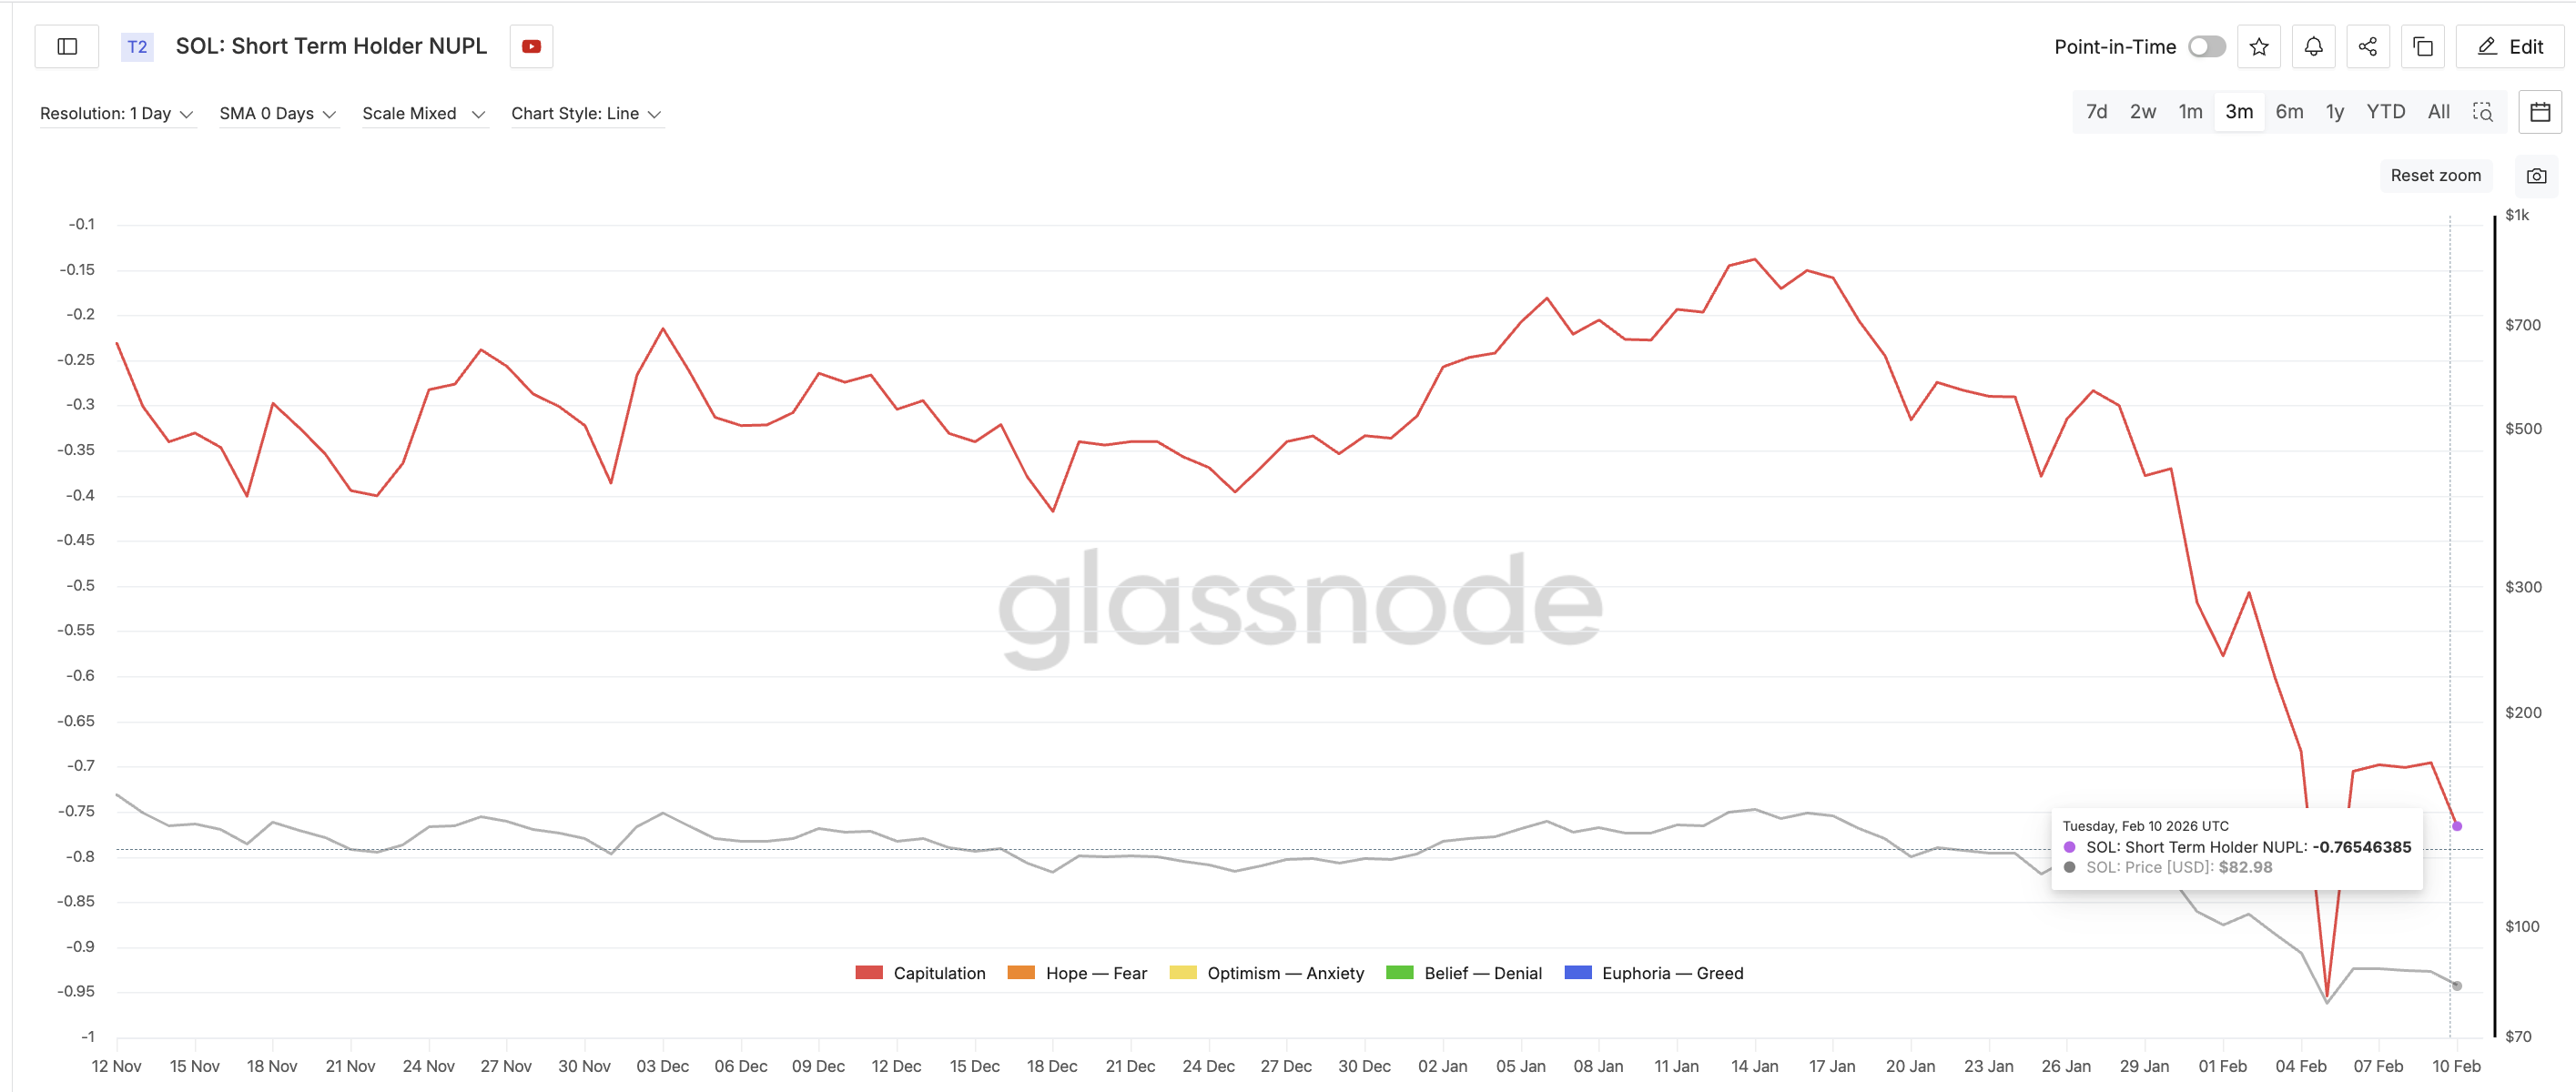
This explains why short-term holders are holding for now and why they are relied on to provide critical support. But it does not mean they will defend or support if losses deepen.
Solana Price Levels Point to $75 as the Make-or-Break Zone
With speculative buying dominant, the SOL price structure becomes critical.
The Solana price has already lost resistance near $89. The next major support sits near $75. This zone represents a psychological level and a possible short-term cost area for recent buyers. It is also close to where dip buyers may have begun accumulating after the February 6 correction.
If SOL holds above $75, short-term traders may continue defending their positions, keeping the price in consolidation. But this support is weak because it is not backed by strong long-term accumulation.
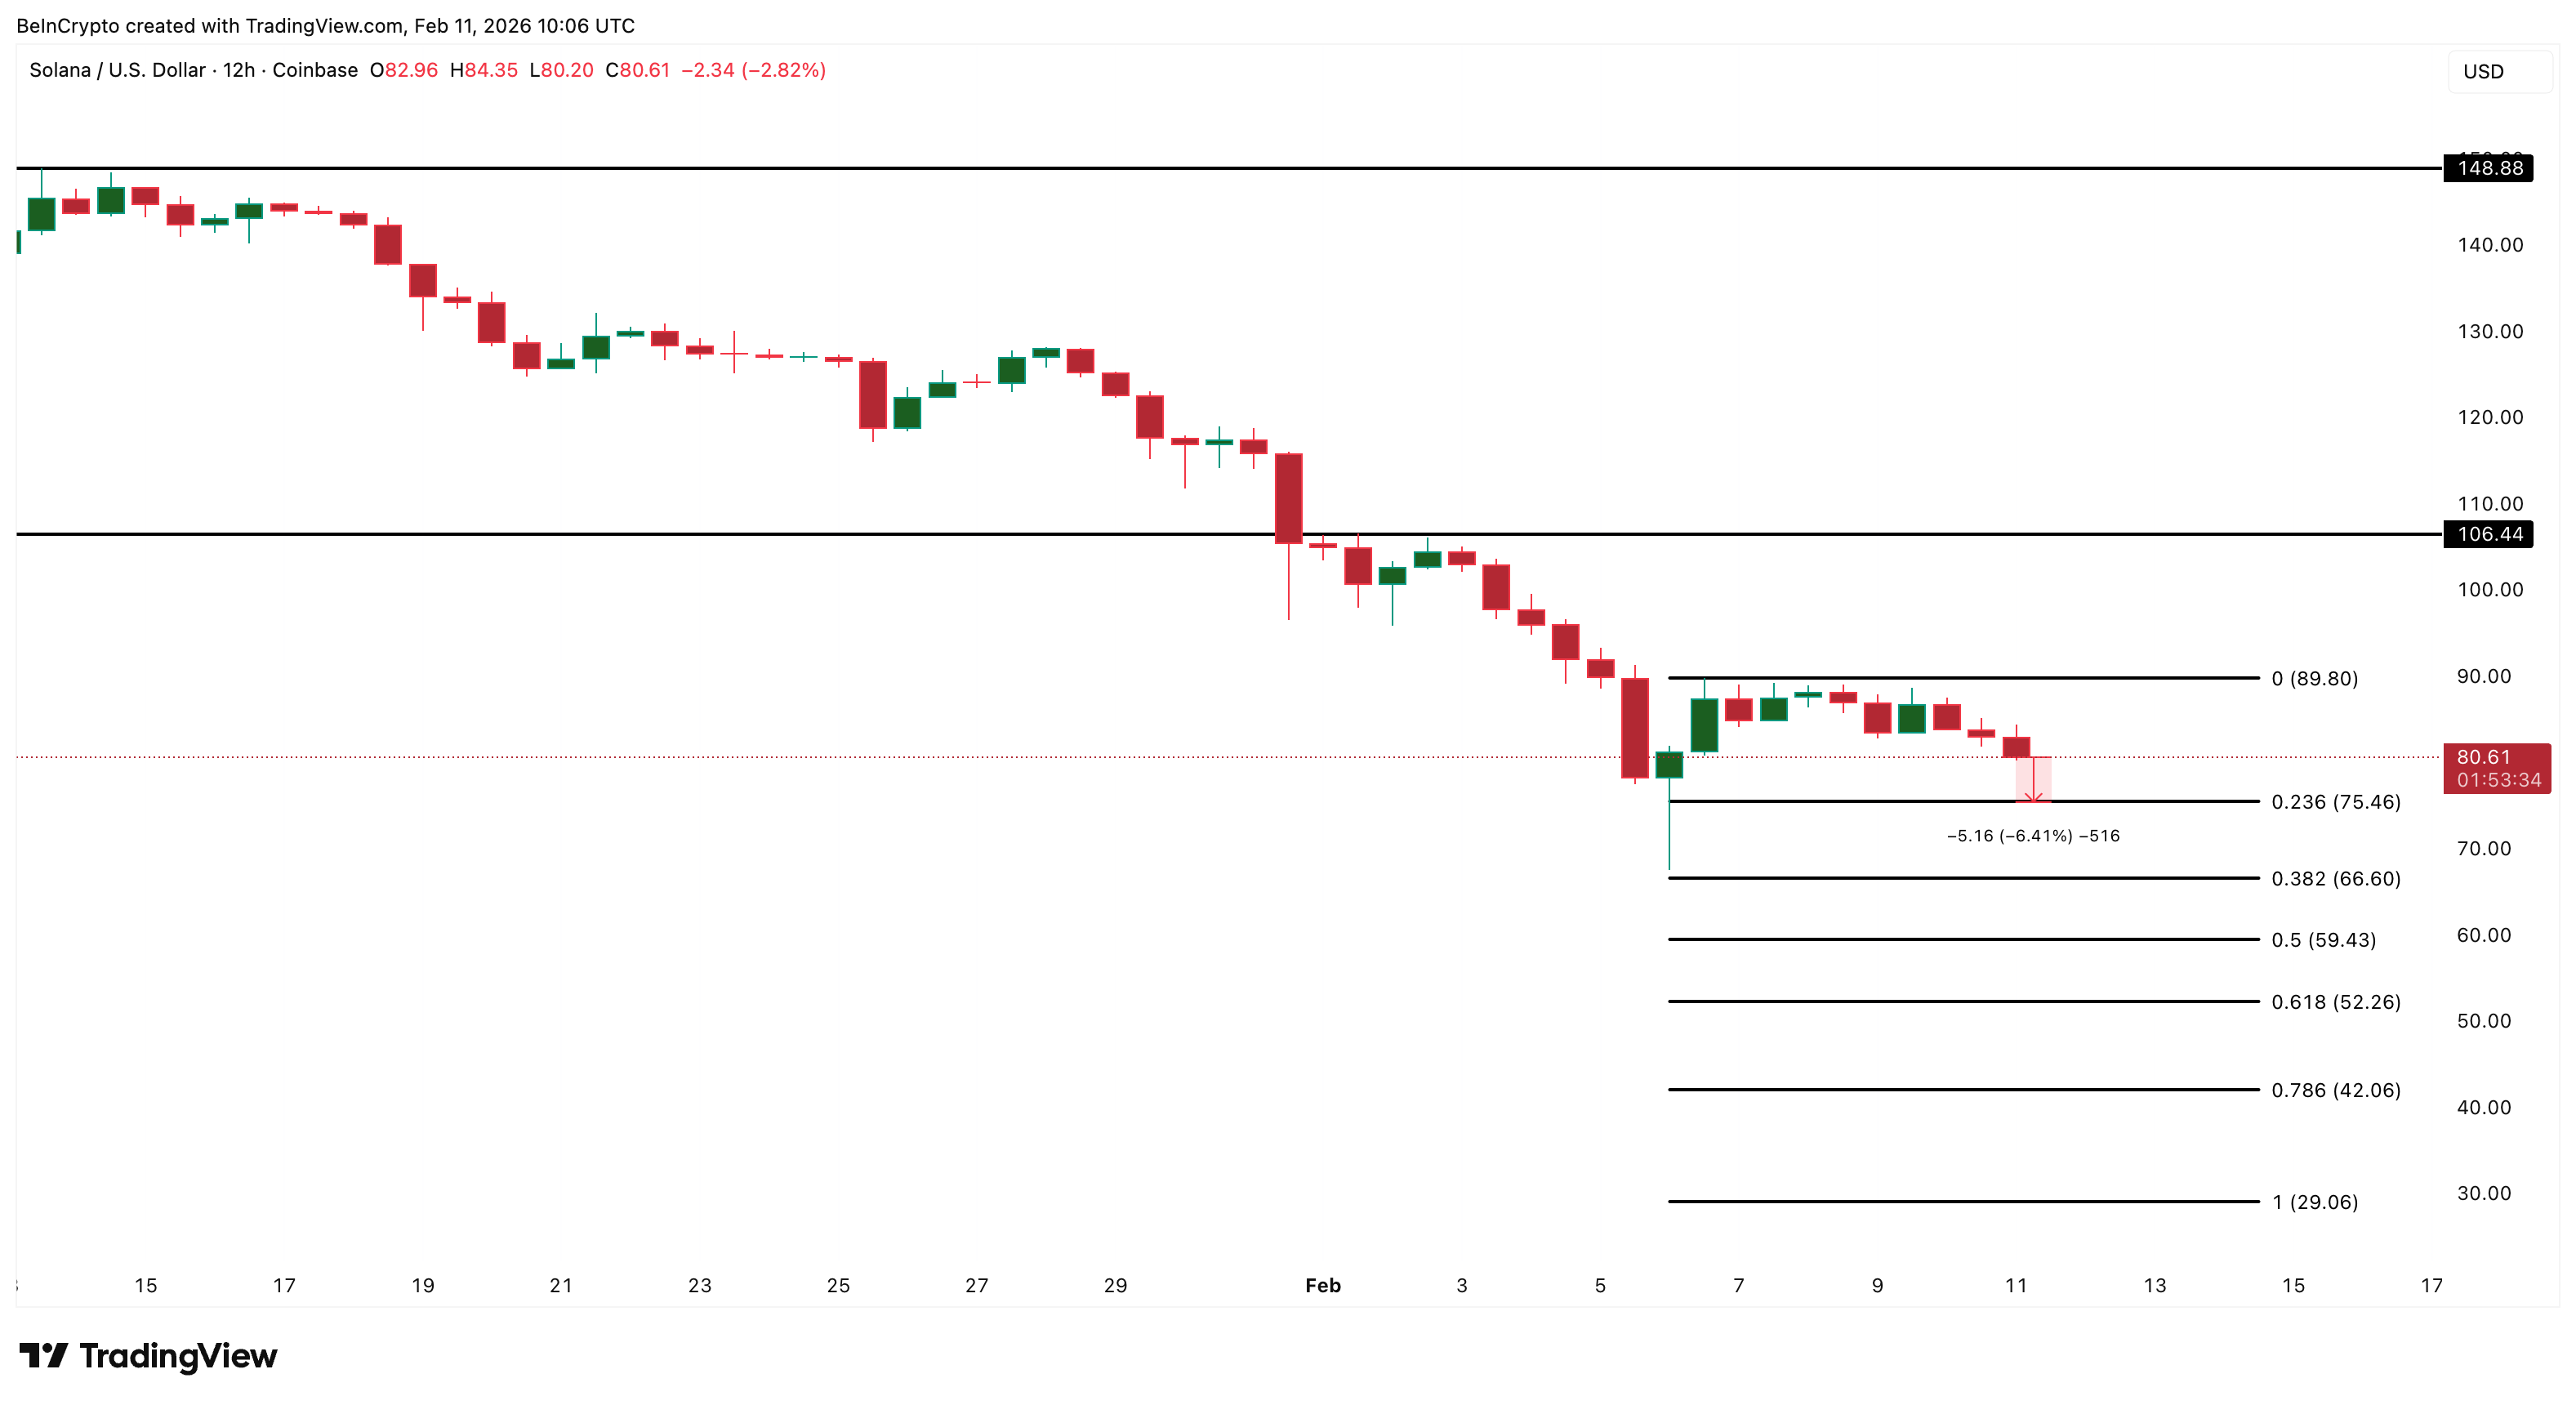
A clean 12-hour candle break below $75 would likely trigger a new wave of selling. Many recent buyers would move deeper into losses, increasing panic risk. If $75 fails, downside targets open near $66 and $59 in the short term.
On the upside, recovery remains difficult. Solana must first reclaim $89 to restore momentum.
Only above $106 would the broader structure begin to improve meaningfully.
* The content presented above, whether from a third party or not, is considered as general advice only. This article should not be construed as containing investment advice, investment recommendations, an offer of or solicitation for any transactions in financial instruments.


