


Top Crypto Gainers: XCN, PENGU, SUI – Hold momentum while Bitcoin slips under $119,000


Onyxcoin trendline breakout rally posts double-digit gains on Monday, targeting a crucial resistance level.
Pudgy Penguins tick higher amid a golden cross, eyeing further gains.
Sui trend reversal gains traction, targeting the $4 breakout.
Bitcoin (BTC) takes a breather after hitting a record high of $123,218 on Monday, resulting in a pullback under $119,000 at press time on Tuesday. The top altcoins are mirroring the pullback, while Onyxcoin (XCN), Pudgy Penguins (PENGU), and Sui (SUI) maintain bullish momentum, suggesting further gains if Bitcoin finds a support level.
XCN trendline breakout rally hits key resistance
Onyxcoin edges lower by 2% at press time on Tuesday, following the 13% surge from the previous day. XCN bounced off the 200-day Exponential Moving Average (EMA) and exceeded a resistance trendline formed by connecting the peaks of January 26 and May 16.
The breakout rally struggles to surpass the 50% Fibonacci retracement level at $0.019, drawn from the $0.050 peak of January 26 and the $0.007 low of April 7. A decisive close above this level could stretch the Onyxcoin rally to the April 11 peak of $0.029.
The Moving Average Convergence/Divergence (MACD) indicator displays a positive trend of MACD and signal line crossing above the zero line, suggesting a trend reversal.
The Relative Strength Index (RSI) reads 67 as it reverts from the overbought zone, suggesting a minor decline in bullish momentum with the intraday pullback.
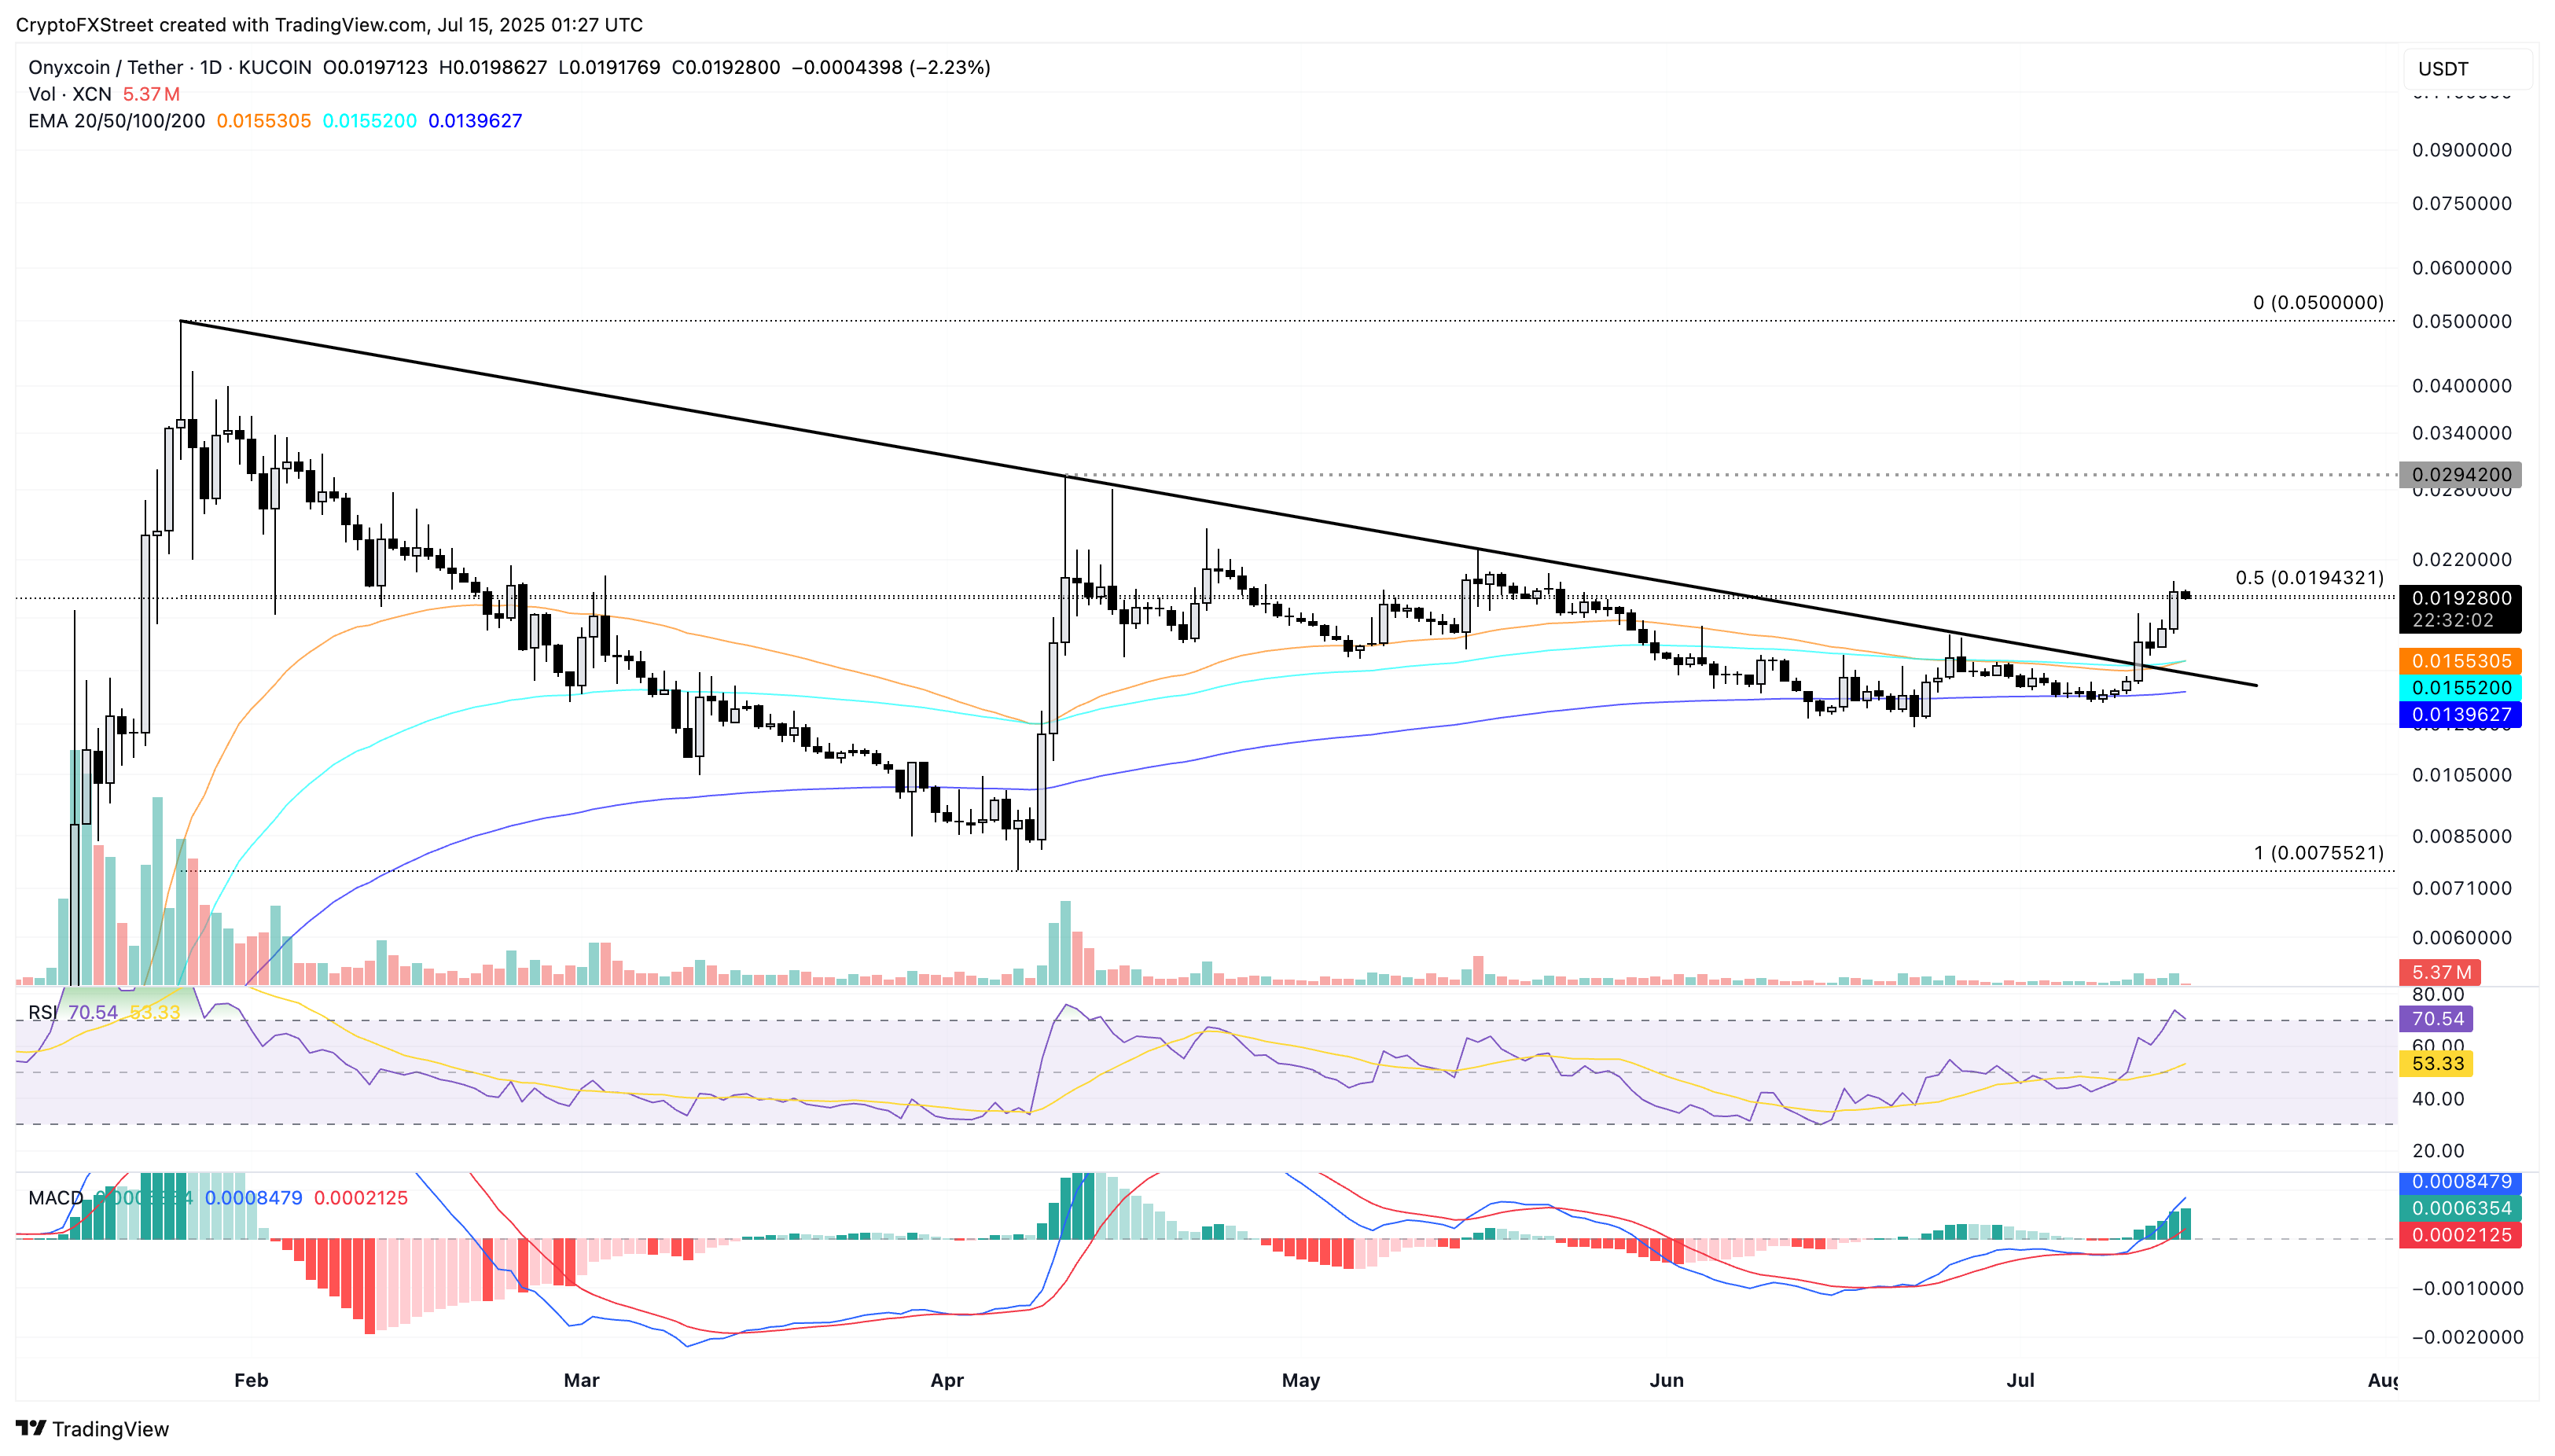
XCN/USDT daily price chart.
If XCN reverses from the 50% Fibonacci level at $0.019, it could result in a retest of the 50-day EMA at $0.015.
PENGU’s trend reversal nears crucial resistance level
Pudgy Penguins’ trend reversal rally holds near the $0.030 level, holding the 28% gains from Sunday. At the time of writing, the PENGU edges higher by 2% so far on Tuesday, trading between the 61.8% and 78.6% Fibonacci retracement levels of $0.022 and $0.037, drawn from the December 17 peak of $0.070 to the April 9 low of $0.003.
Sidelined investors could await a decisive close above $0.037 to confirm upside chances, with the next target at the $0.050 psychological mark.
The 50-day EMA crossing above the 200-day EMA marks a golden crossover, typically considered a trend reversal signal.
The momentum indicators, such as MACD with rising green histogram bars and RSI at 86 signaling overbought conditions, highlight a bullish bias.
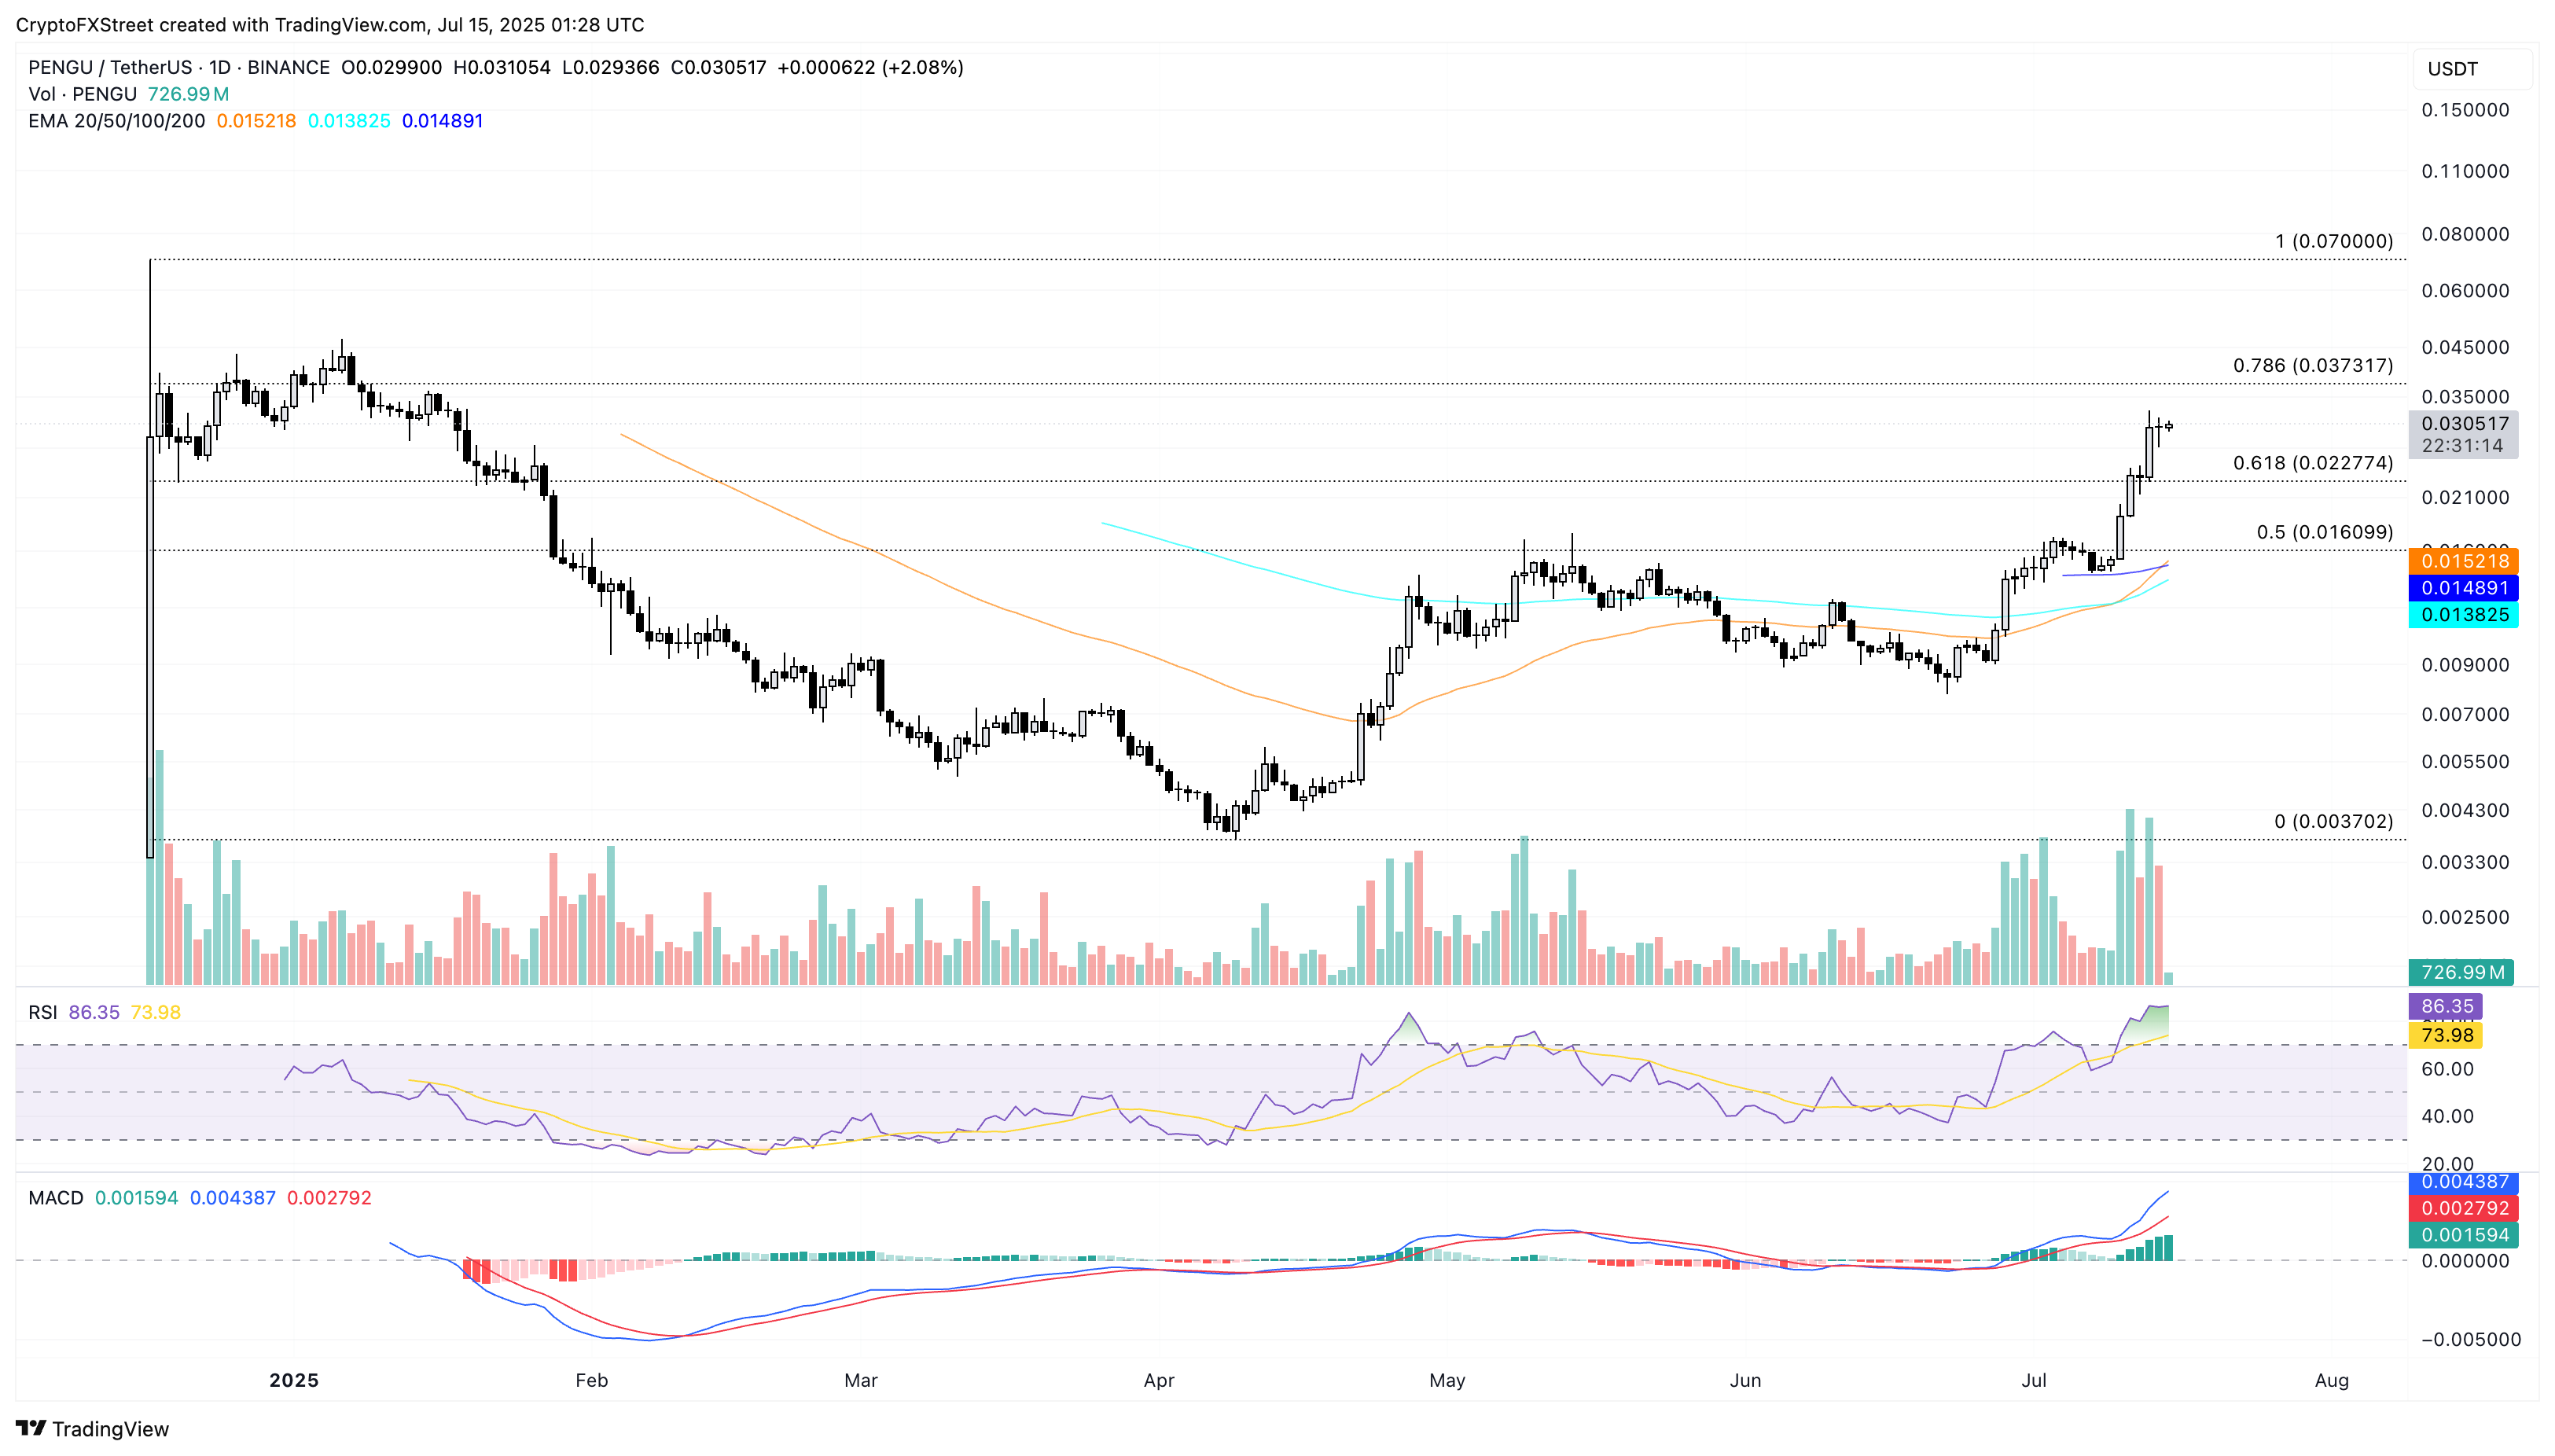
PENGU/USDT daily price chart.
If PENGU fails to uphold momentum, it could retest the 61.8% Fibonacci level at $0.022.
SUI bullish run eyes further gains beyond $4
SUI edges lower marginally by under 0.50% at press time on Tuesday as it holds an 11% gain from Monday. The altcoin broke out of a resistance trendline formed by connecting May 12 and June 10 peaks on Wednesday.
SUI inches closer to reclaiming the $4 milestone, while the bulls target the 78.6% Fibonacci retracement level at $4.20, drawn from $5.36 on January 6 to $1.71 on April 7. A clean push above this level could stretch the breakout rally to the January 6 peak of $5.36.
The 50-day and 100-day EMAs inch closer to a bullish crossover, a positive signal for buyers. The RSI at 70 hits the overbought boundary line, with the MACD indicator displaying an uptrend of green histogram bars, suggesting heightened bullish momentum.
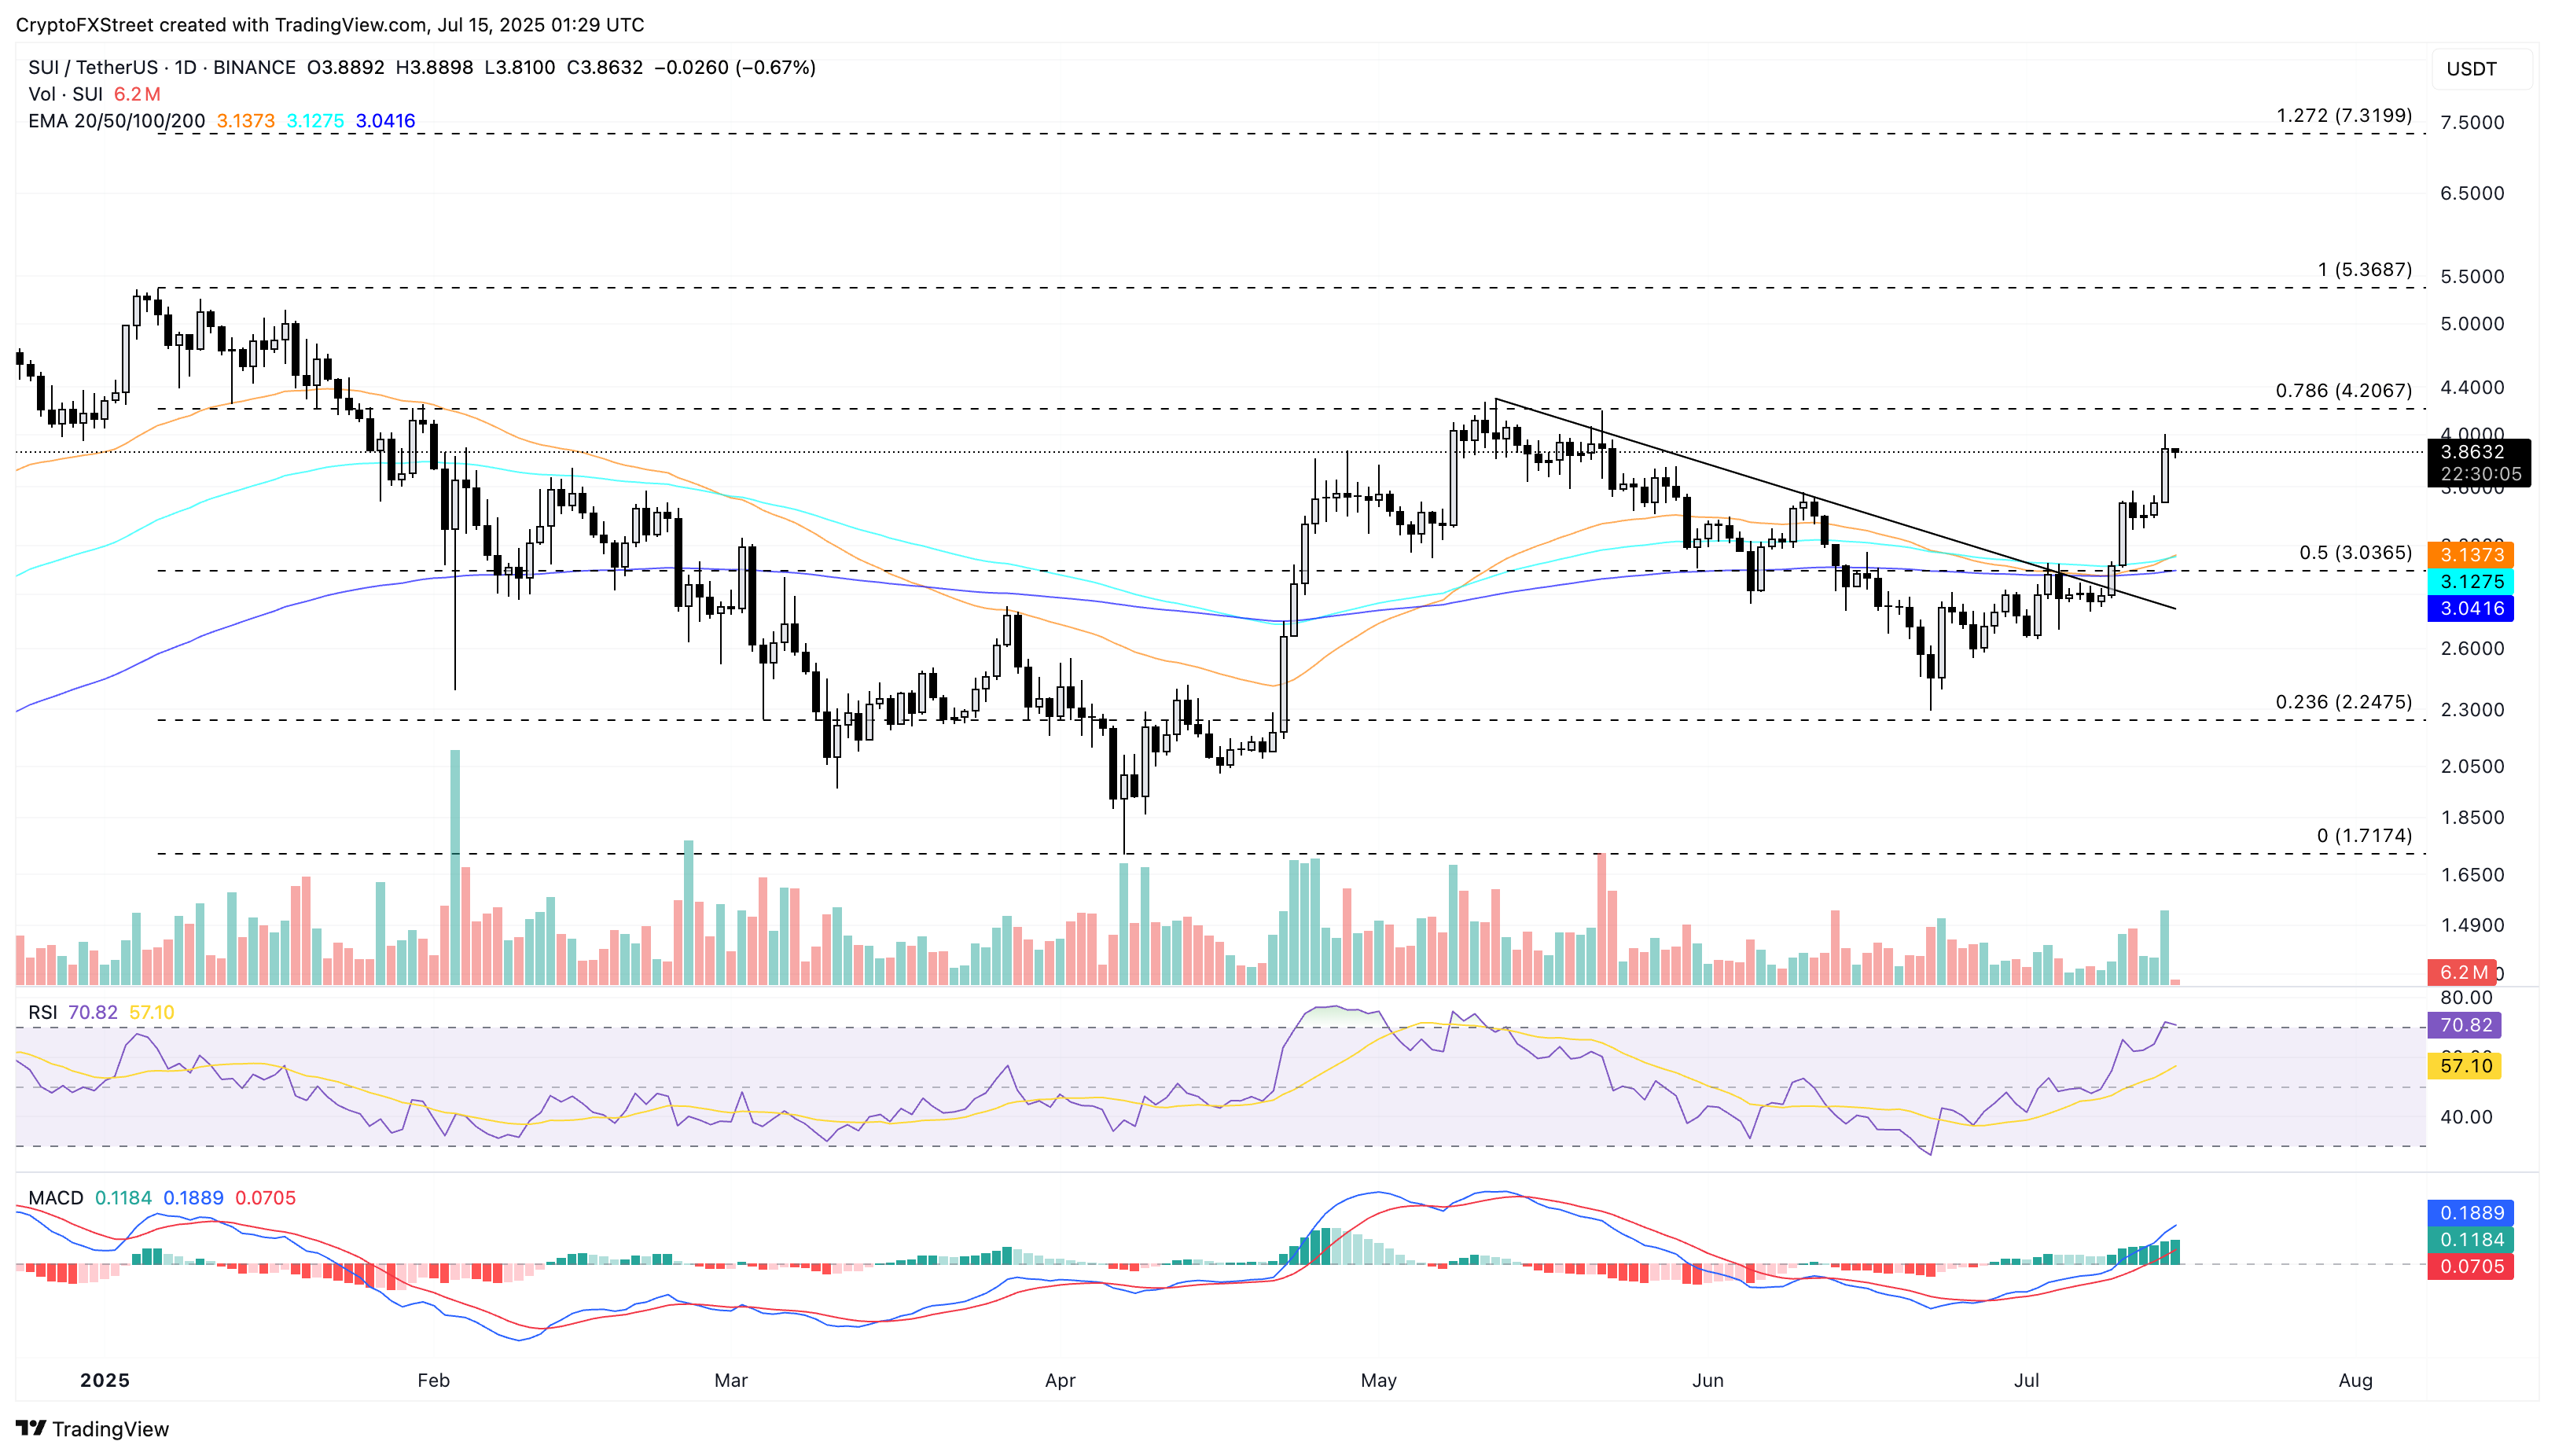
SUI/USDT daily price chart.
On the downside, a reversal in Sui could retest the 50-day EMA at $3.13.
* The content presented above, whether from a third party or not, is considered as general advice only. This article should not be construed as containing investment advice, investment recommendations, an offer of or solicitation for any transactions in financial instruments.


