


Top 3 Price Prediction: Bitcoin, Ethereum, Ripple – BTC shows mild signs of recovery, ETH and XRP remain under pressure


Bitcoin extends recovery on Friday after finding support at the midpoint of a horizontal parallel channel.
Ethereum price steadies around $2,960 after closing below the daily support earlier this week.
XRP edges below $1.91 after failing to close above the key resistance.
Bitcoin (BTC), Ethereum (ETH) and Ripple (XRP) show mixed signals at the time of writing on Friday as the broader crypto market attempts to stabilize after this week’s sell-off. BTC extends its recovery after finding support around a key level. Meanwhile, ETH and XRP remain under pressure after closing below their critical support zone, keeping the downside risk intact.
Bitcoin rebounds after retesting key support
Bitcoin price started the week on a negative note, closing below key support levels: the 50-day Exponential Moving Average (EMA) at $91,942 and the previously broken upper consolidation boundary at $90,000. On Wednesday, BTC rebounded slightly after retesting the midpoint of a horizontal parallel channel at $87,787 and continued its recovery the next day. At the time of writing on Friday, BTC is trading at around $89,900.
If BTC continues its ongoing recovery, it could extend the advance toward the 50-day EMA at $91,942.
The Relative Strength Index (RSI) on the daily chart is 44, pointing upward toward the neutral 50 level, indicating fading bearish momentum. For the bullish momentum to be sustained, the RSI must move above the neutral level. However, traders should be cautious, as the Moving Average Convergence Divergence (MACD) indicator showed a bearish crossover on Tuesday, suggesting a mild downward pressure.
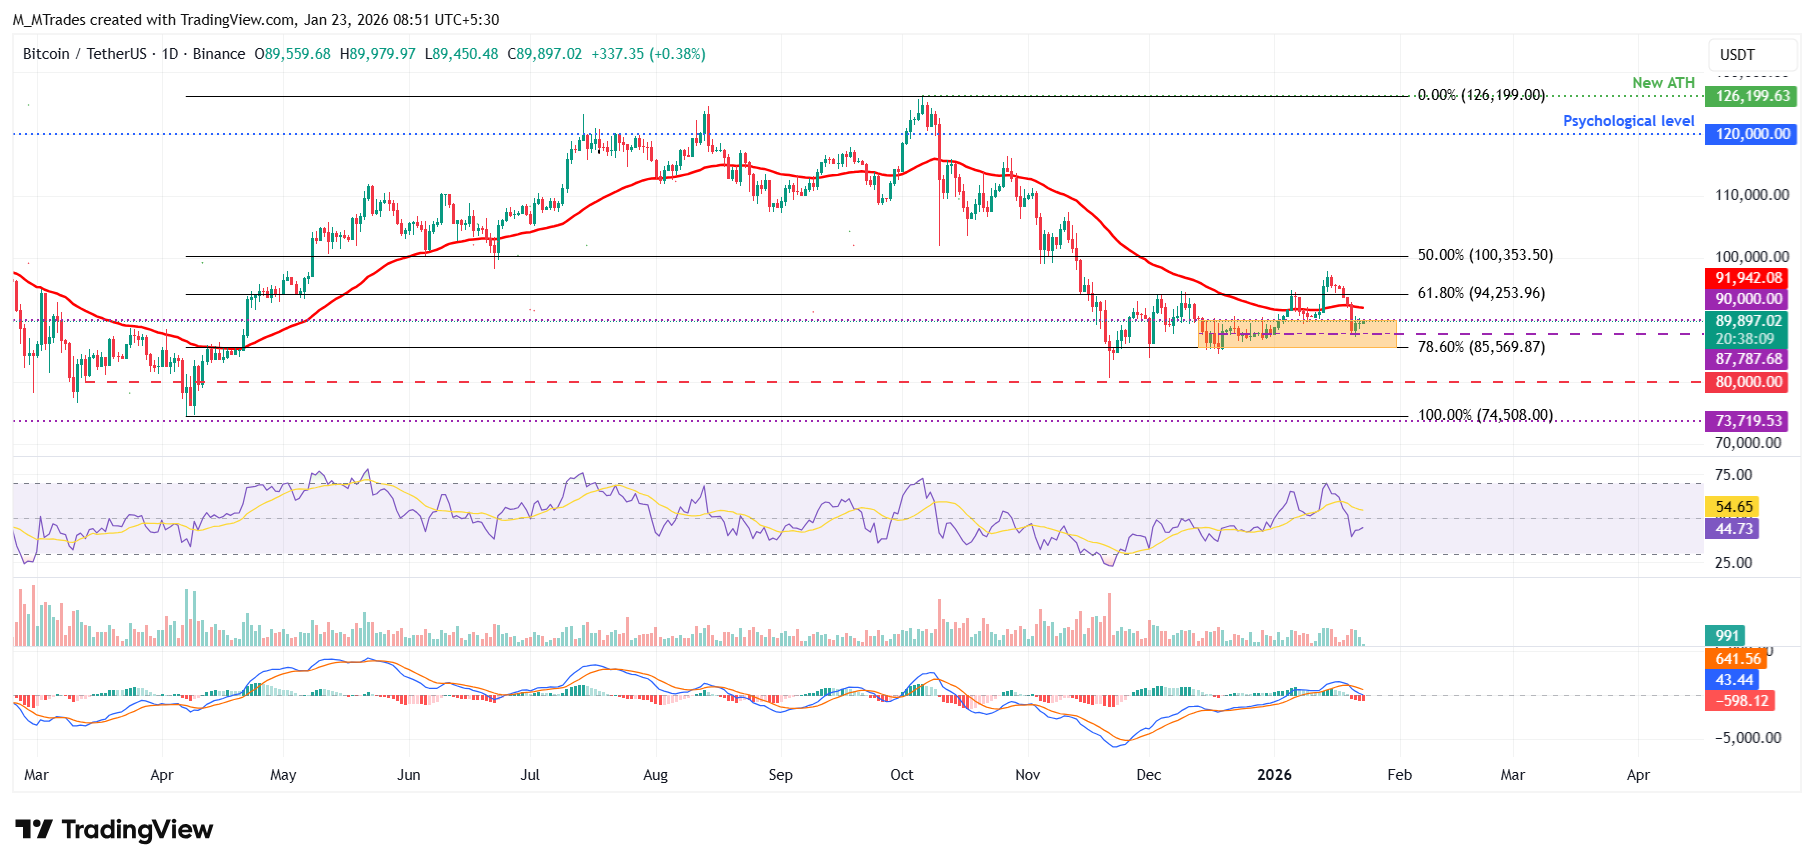
On the other hand, if BTC closes below the $87,787 support on a daily basis, it could extend the fall toward the lower consolidation boundary at $85,569, which coincides with the 78.6% Fibonacci retracement level.
Ethereum fails to close above the daily resistance at $3,017
Ethereum price extended its correction by more than 10% through Tuesday and closed below key support levels: the 50-day EMA at $3,135 and the daily support at $3,017. On Wednesday, ETH recovered slightly but failed to close above the daily level at $3,017 and declined slightly the next day. As of Friday, ETH hovers at $2,964.
If the daily level at $3,017 continues to hold as resistance, ETH could extend the decline toward the 61.8% Fibonacci retracement level (drawn from the April low of $1,385 to the August all-time high of $4,956) at $2,749.45.
The RSI on the daily chart reads 40, below the neutral level of 50, indicating bearish momentum gaining traction. The Moving Average Convergence Divergence (MACD) indicator also showed a bearish crossover on Tuesday, further supporting the downward view.
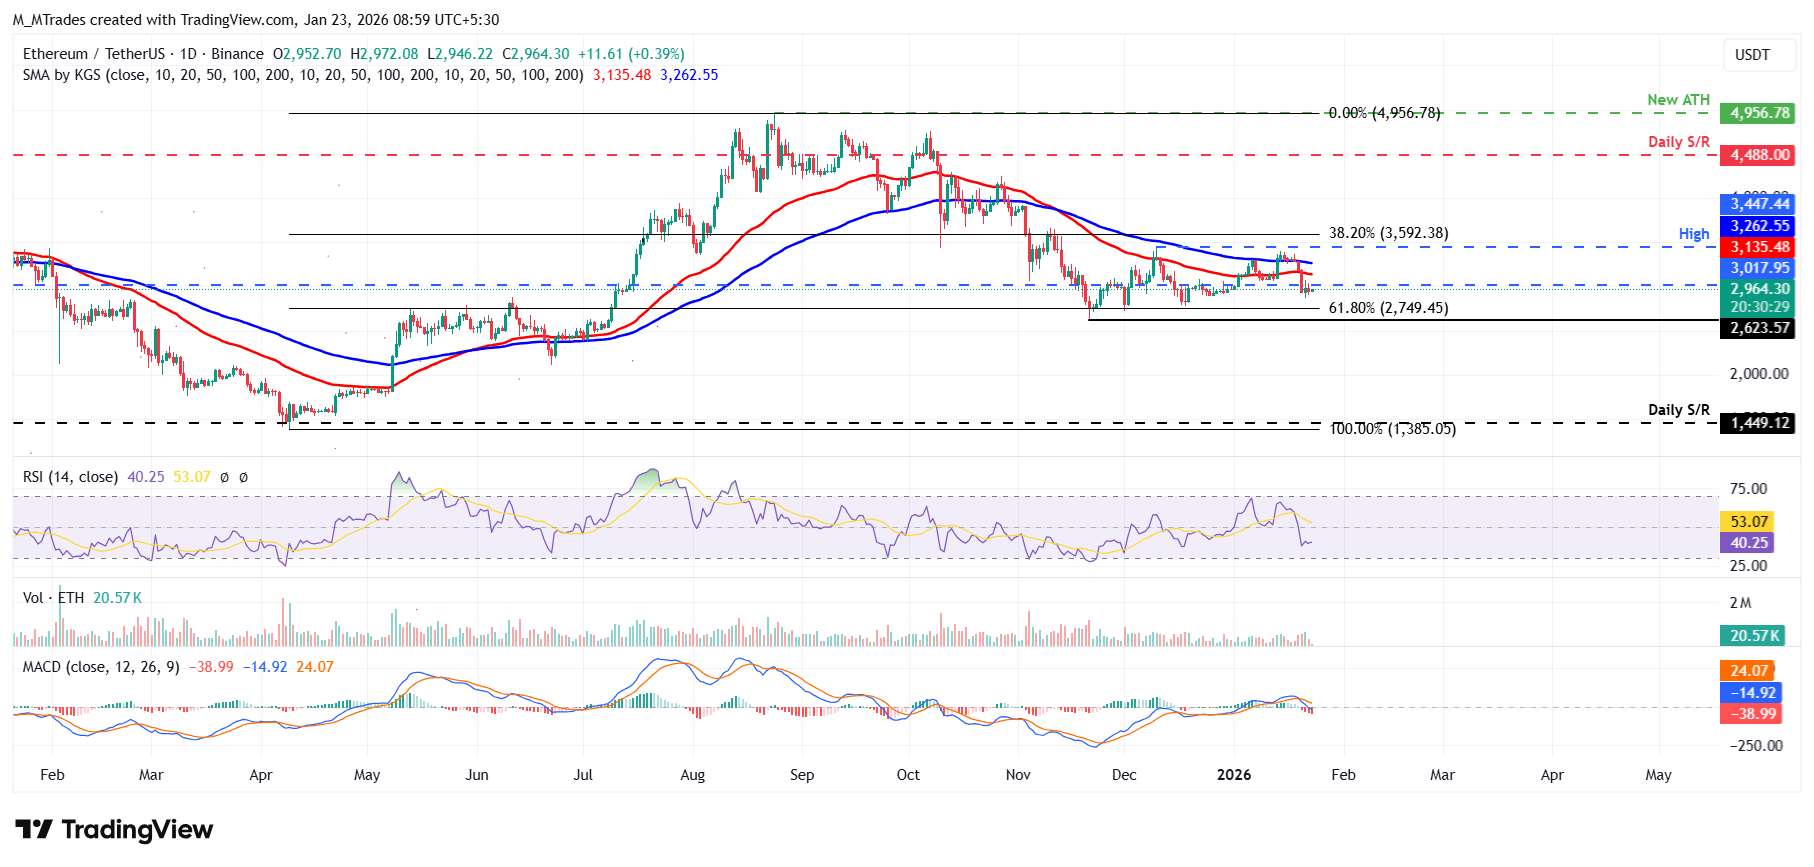
However, if ETH recovers and closes above the daily resistance at $3,017, it could extend the advance toward the 50-day EMA at $3,135.
XRP bears are aiming for the $1.77 mark
XRP price faced rejection from the 50-day EMA at $2.04 last week and has since lost more than 8% since the weekend, closing below the daily support at $1.96 on Tuesday. XRP recovered slightly on Wednesday but failed to close above the daily level at $1.96, declining slightly the next day. As of Friday, XRP is trading down at $1.91.
If XRP continues its correction, it could extend the decline toward the December 19 low of $1.77.
Like Ethereum, XRP's momentum indicators (RSI and MACD) also support a bearish view.
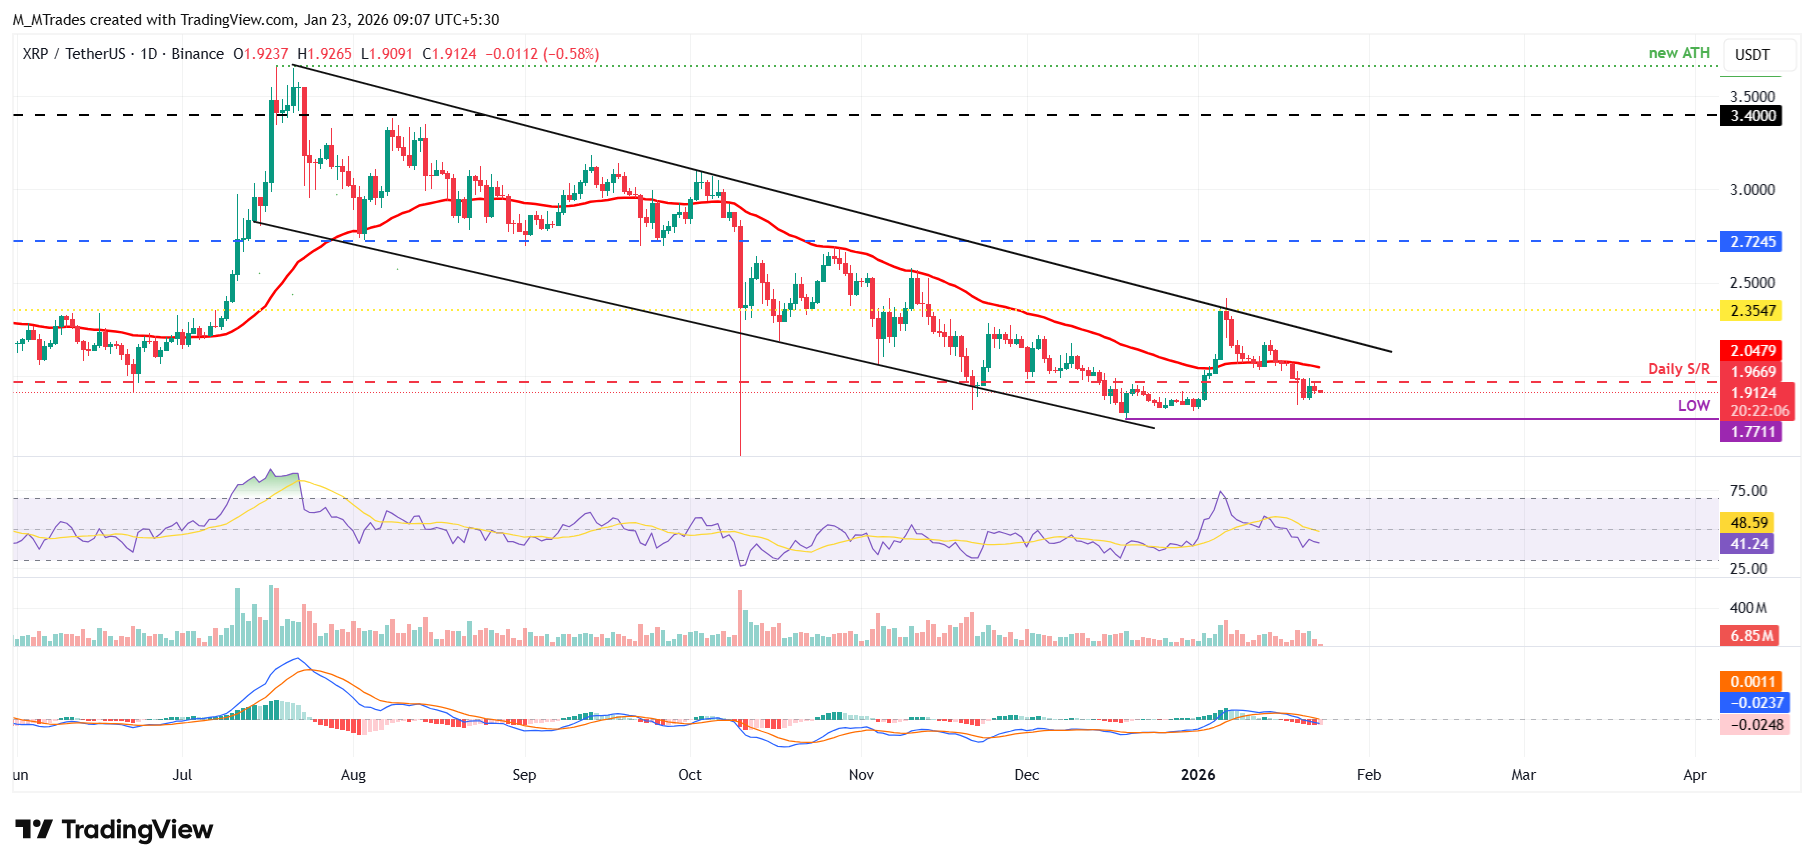
On the other hand, if XRP recovers and closes above the daily resistance at $1.966, it could extend the recovery toward the 50-day EMA at $2.04.
The above content was completed with the assistance of AI and has been reviewed by an editor.


