Solana Price Forecast: SOL flashes bearish signals, risks double-digit crash

แหล่งที่มา Fxstreet
  • Solana price trades red on Monday, nearing the 200-day EMA at $162.42; a decisive close below could trigger further downside.
  • Bearish sentiment spikes, with CoinGlass data showing short positions at their highest level over a month.
  • Momentum indicators show growing weakness, with a potential downside target near $141.41 if support fails.

Solana (SOL) price shows early signs of a potential breakdown as it trades lower at $165.40 on Monday. SOL is approaching a key support level that could determine its next major move. Technical indicators flash red, and bearish sentiment intensifies, with short positions hitting a monthly high. If SOL closes below its critical support level, the selling pressure could accelerate, potentially driving the token into a double-digit decline toward the $141 mark.

Solana shows a bearish bias in momentum indicators

Solana price faced rejection around the $184.13 daily resistance level on May 14 and declined nearly 10% until Saturday. However, it recovered slightly the next day after finding support around its 200-day EMA at $162.42. This level roughly coincides with the daily support at $160 and the ascending trendline (drawn by joining multiple low levels since April 7), and a breakdown indicates a bearish trend. At the time of writing on Monday, it trades down at around $165.40, approaching its critical support zone.

If SOL continues its correction and closes below $160 on a daily basis, it could extend the decline by 14.6% from its current levels to retest its May 6 low of $141.41.

The Relative Strength Index (RSI) on the daily chart reads 54, pointing toward its neutral level of 50, indicating fading bullish momentum. If the RSI moves below its neutral level of 50, it would give rise to strong bearish momentum and a sharp fall in Solana prices. The Moving Average Convergence Divergence (MACD) indicator is also switching to a bearish crossover on the daily chart. If the crossover occurs, it would confirm another sell signal.
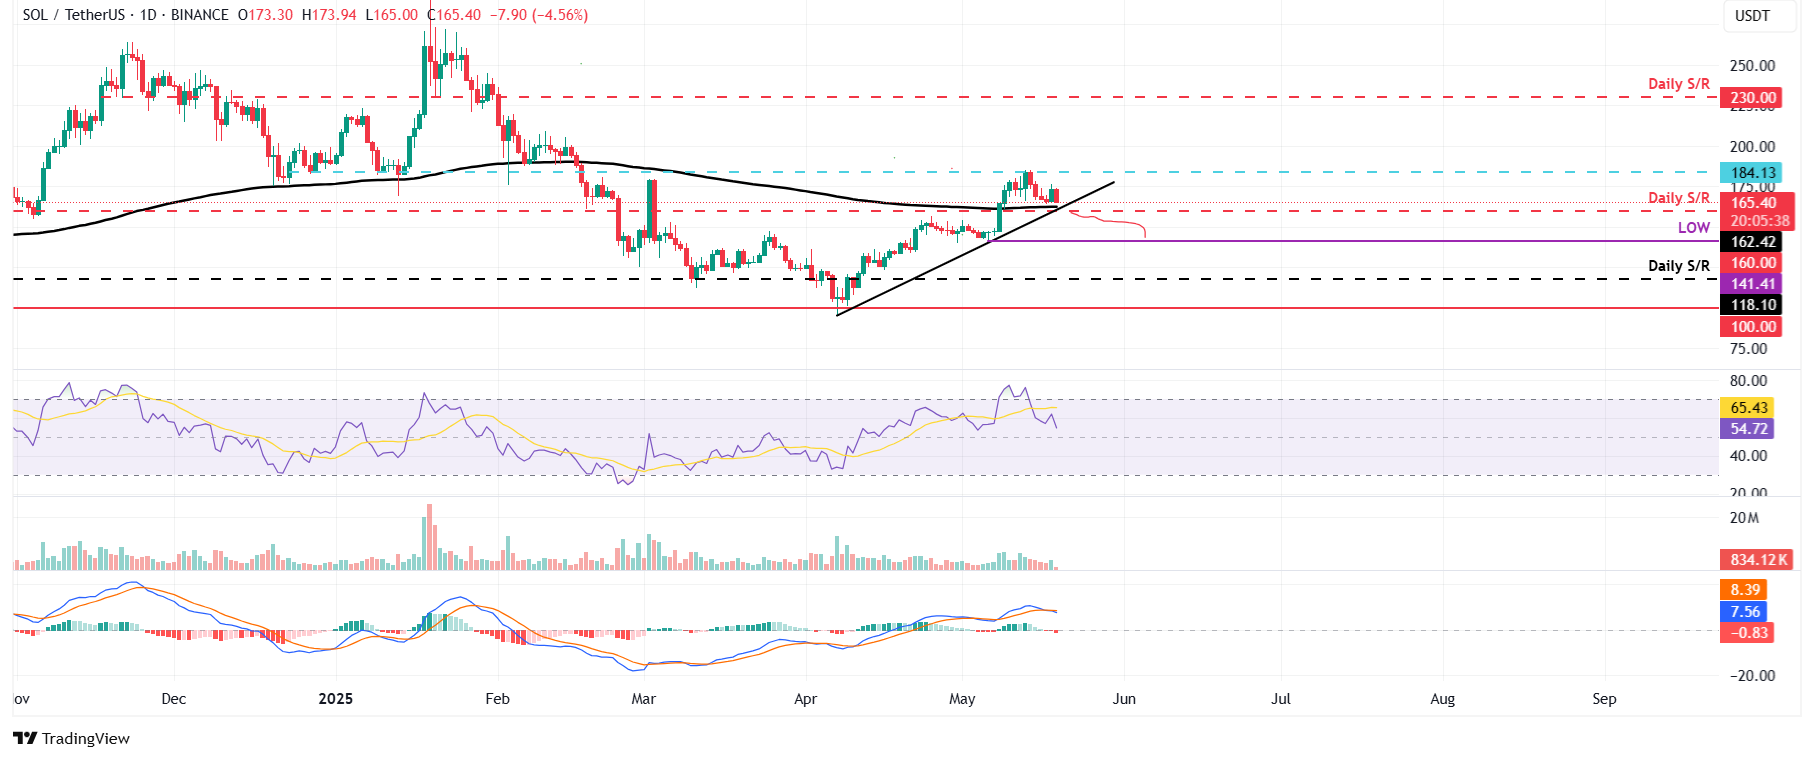
SOL/USDT daily chart

SOL/USDT daily chart

Another sign of a bearish outlook. According to Coinglass’s data, SOL’s long-to-short ratio reads 0.85, the lowest level over a month. This ratio below one reflects bearish sentiment in the markets as more traders are betting on Solana's price to fall.

Solana Long-to-short ratio chart. Source: Coinglass

Solana Long-to-short ratio chart. Source: Coinglass

However, if SOL finds support around the daily level at $160 and recovers, it could extend the recovery toward the next daily resistance at $184.13.

ข้อจำกัดความรับผิดชอบ: เพื่อการอ้างอิงเท่านั้น ผลการดำเนินงานในอดีตไม่ได้บ่งบอกถึงผลลัพธ์ในอนาคต
placeholder
การคาดการณ์ราคาเงิน: XAG/USD ลดลงมากกว่า 2% จากผลตอบแทนพันธบัตรสหรัฐที่สูง อยู่ใกล้ระดับ $32.00ราคาโลหะเงินลดลง 2% ในวันพุธท่ามกลางอัตราผลตอบแทนพันธบัตรรัฐบาลสหรัฐฯ ที่สูงขึ้น เนื่องจากนักลงทุนดูเหมือนมั่นใจว่าธนาคารกลางสหรัฐฯ (เฟด) จะไม่ปรับลดอัตราดอกเบี้ย ในขณะที่เขียนบทความนี้ XAG/USD ซื้อขายอยู่ที่ 32.20 ดอลลาร์ ไม่เปลี่ยนแปลงเมื่อเริ่มต้นเซสชันเอเชีย
ผู้เขียน  FXStreet
5 เดือน 15 วัน พฤหัส
ราคาโลหะเงินลดลง 2% ในวันพุธท่ามกลางอัตราผลตอบแทนพันธบัตรรัฐบาลสหรัฐฯ ที่สูงขึ้น เนื่องจากนักลงทุนดูเหมือนมั่นใจว่าธนาคารกลางสหรัฐฯ (เฟด) จะไม่ปรับลดอัตราดอกเบี้ย ในขณะที่เขียนบทความนี้ XAG/USD ซื้อขายอยู่ที่ 32.20 ดอลลาร์ ไม่เปลี่ยนแปลงเมื่อเริ่มต้นเซสชันเอเชีย
placeholder
ราคาทองคำพุ่งสูงขึ้นจากข้อมูลเศรษฐกิจสหรัฐที่อ่อนแอ อัตราผลตอบแทนสหรัฐที่ลดลง และความวิตกกังวลทางภูมิศาสตร์ราคาทองคำพุ่งขึ้นอย่างรวดเร็วในวันพฤหัสบดีหลังจากแตะระดับต่ำสุดในรอบสัปดาห์ที่ 3,120 ดอลลาร์ โดยบันทึกการเพิ่มขึ้นที่แข็งแกร่งกว่า 1.40% ได้รับแรงหนุนจากการอ่อนค่าของดอลลาร์สหรัฐอย่างกว้างขวางเนื่องจากรายงานดัชนีราคาผู้ผลิต (PPI) ที่น่าพอใจในสหรัฐฯ
ผู้เขียน  FXStreet
5 เดือน 16 วัน ศุกร์
ราคาทองคำพุ่งขึ้นอย่างรวดเร็วในวันพฤหัสบดีหลังจากแตะระดับต่ำสุดในรอบสัปดาห์ที่ 3,120 ดอลลาร์ โดยบันทึกการเพิ่มขึ้นที่แข็งแกร่งกว่า 1.40% ได้รับแรงหนุนจากการอ่อนค่าของดอลลาร์สหรัฐอย่างกว้างขวางเนื่องจากรายงานดัชนีราคาผู้ผลิต (PPI) ที่น่าพอใจในสหรัฐฯ
placeholder
GBP/JPY ดึงดูดผู้ขายบางรายใต้ 193.50 แม้จะมีข้อมูล GDP ที่ไม่ดีของญี่ปุ่นคู่เงิน GBP/JPY ขยายการปรับตัวลงมาอยู่ใกล้ 193.40 ในช่วงเช้าของการซื้อขายในยุโรปวันศุกร์ เงินเยนญี่ปุ่น (JPY) แข็งค่าขึ้นเมื่อเทียบกับปอนด์สเตอร์ลิง (GBP) แม้จะมีรายงาน GDP ของญี่ปุ่นที่น่าผิดหวัง
ผู้เขียน  FXStreet
5 เดือน 16 วัน ศุกร์
คู่เงิน GBP/JPY ขยายการปรับตัวลงมาอยู่ใกล้ 193.40 ในช่วงเช้าของการซื้อขายในยุโรปวันศุกร์ เงินเยนญี่ปุ่น (JPY) แข็งค่าขึ้นเมื่อเทียบกับปอนด์สเตอร์ลิง (GBP) แม้จะมีรายงาน GDP ของญี่ปุ่นที่น่าผิดหวัง
placeholder
ราคาทองคำปรับตัวสูงขึ้นใกล้ $3250 เนื่องจากความต้องการสินทรัพย์ปลอดภัยและความกังวลเกี่ยวกับเศรษฐกิจสหรัฐฯทองคํา (XAU/USD) กำลังฟื้นตัวจากการขาดทุนในช่วงที่ผ่านมา โดยมีการซื้อขายใกล้ $3,230 ต่อออนซ์ในช่วงเซสชันเอเชียของวันจันทร์ การฟื้นตัวนี้ได้รับแรงหนุนจากความต้องการสินทรัพย์ปลอดภัยที่เพิ่มขึ้นท่ามกลางความกังวลที่เพิ่มขึ้นเกี่ยวกับแนวโน้มเศรษฐกิจและสุขภาพการคลังของสหรัฐฯ
ผู้เขียน  FXStreet
6 ชั่วโมงที่แล้ว
ทองคํา (XAU/USD) กำลังฟื้นตัวจากการขาดทุนในช่วงที่ผ่านมา โดยมีการซื้อขายใกล้ $3,230 ต่อออนซ์ในช่วงเซสชันเอเชียของวันจันทร์ การฟื้นตัวนี้ได้รับแรงหนุนจากความต้องการสินทรัพย์ปลอดภัยที่เพิ่มขึ้นท่ามกลางความกังวลที่เพิ่มขึ้นเกี่ยวกับแนวโน้มเศรษฐกิจและสุขภาพการคลังของสหรัฐฯ
placeholder
โลหะเงินยังคงอยู่ต่ำกว่า $32.50 โดยมีแนวโน้มการปรับตัวขึ้นที่เป็นไปได้เนื่องจากความไม่แน่นอนทางเศรษฐกิจของสหรัฐฯราคาโลหะเงิน (XAG/USD) ปรับตัวลดลงต่อเนื่องเป็นวันที่สอง โดยซื้อขายอยู่ที่ประมาณ $32.30 ต่อออนซ์ในช่วงชั่วโมงการลงทุนเอเชียวันจันทร์
ผู้เขียน  FXStreet
1 ชั่วโมงที่แล้ว
ราคาโลหะเงิน (XAG/USD) ปรับตัวลดลงต่อเนื่องเป็นวันที่สอง โดยซื้อขายอยู่ที่ประมาณ $32.30 ต่อออนซ์ในช่วงชั่วโมงการลงทุนเอเชียวันจันทร์
ตราสารที่เกี่ยวข้อง
goTop
quote