Why is the crypto market up today? Weak CPI boosts market confidence
- The crypto market cap jumped above $3.5 trillion on Tuesday, following a weak headline CPI of 2.3% in April.
- Bitcoin's 10-week lag of the Global M2 money supply indicates its price could soar higher.
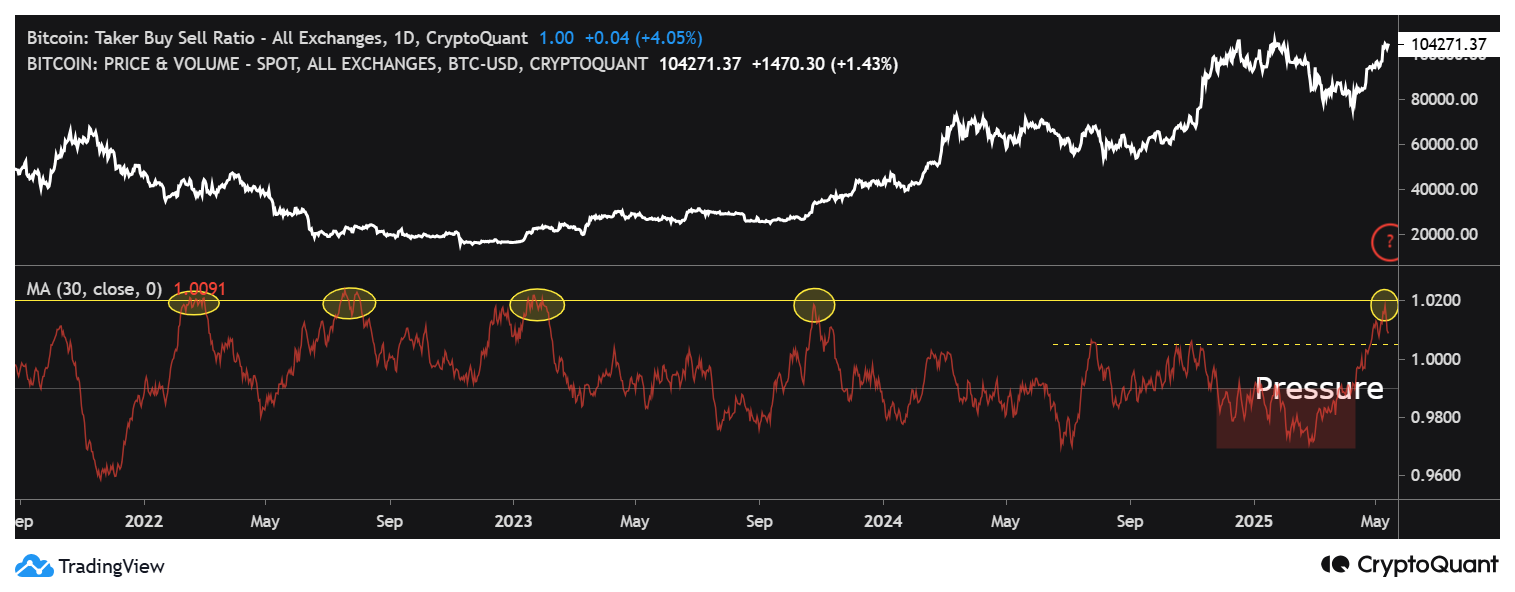
- BTC's spot Taker Buy Sell Ratio rose toward 1.02, signaling a strong capital inflow into the spot market.
- Ethereum saw a 9% gain as the altcoin market showed renewed strength alongside Bitcoin.
Bitcoin (BTC) saw a 1.4% uptick on Tuesday — reclaiming $104,000 — and Ethereum (ETH) gained 9% after the US Consumer Price Index (CPI) for April came in at 2.3%, below market expectations of 2.4%. The move was supported by a surge in Bitcoin's spot Taker Buy/Sell Ratio and its ongoing correlation with the Global M2 money supply, indicating strong upward momentum.
Bitcoin shapes up for further gains, altcoins show strong momentum
The total crypto market capitalization hit $3.5 trillion for the first time since February 2, following a lower-than-expected CPI report for April.
The headline CPI came in at 2.3% annually, underperforming market forecasts of 2.4% — its lowest level since February 2021 — and a modest monthly increase of 0.2%. April's unadjusted core CPI annual rate was 2.8%, which aligns with market expectations.
Investors quickly capitalized on the weak inflation data, increasing buying pressure across top cryptocurrencies. Bitcoin reclaimed the $104,000 psychological level, posting a mild 1.4% gain after a brief decline to $101,700.
BTC's rise is also attributed to President Donald Trump's call for the Federal Reserve (Fed) Chair Jerome Powell to cut rates. Trump said he should "just let it all happen, it will be a beautiful thing."
The recent price rise has also seen the number one crypto asset continuing its correlation with the Global M2 money supply, which it has been tracking with a 10-week lag. BTC could rip to a new all-time high if the historical pattern holds.
Likewise, Bitcoin's spot Taker Buy/Sell Ratio across centralized exchanges has surged near the 1.02 level, according to data from CryptoQuant. The indicator, which tracks the ratio of aggressive buy-to-sell orders at market price, last hit such levels at the 2022 bottom near $15,000 and the breakout past $30,000 in late 2023, which were crucial turning points in the market.

Spot BTC Taker Buy Sell Ratio. Source: CryptoQuant
"The pattern is repeating itself now, with the BTC price approaching its all-time high and the indicator coming out of a long phase of selling pressure," noted CryptoQuant analyst Gaah.
Altcoins are also witnessing a rally, led by Ethereum, which is up 9% on the day, stretching its weekly gains toward the 50% mark. The meme coin sector also posted a 4% gain amid broader market strength. Dogecoin (DOGE), PEPE, Shiba Inu (SHIB), and TRUMP led the charge, with gains of 5%, 8%, 4% and 6%, respectively.
The Artificial Intelligence (AI) tokens sector also witnessed a 3% uptick, led by Artificial Superintelligence (FET), Internet Computer (ICP), and RENDER with an 8%, 4.4% and 4% increase, respectively.
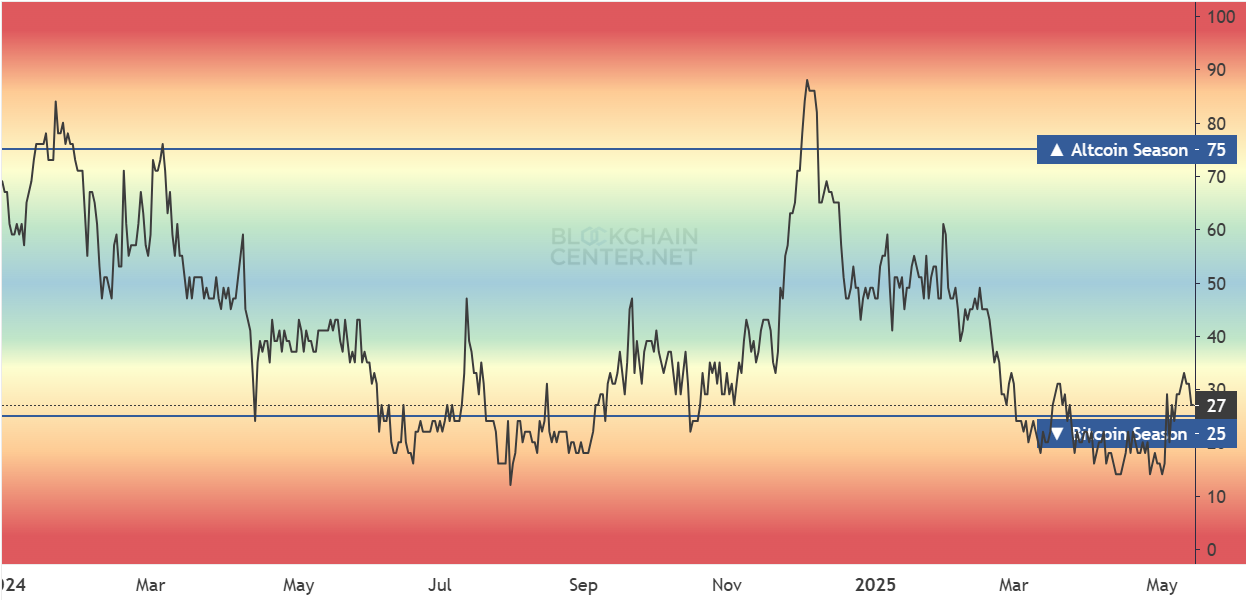
Ethereum's outperformance of Bitcoin in the past week has triggered calls of a potential altcoin season. However, the altcoin season index shows that Bitcoin still maintains a high dominance.

Altcoin Season Index. Source: Blockchain Centre
Meanwhile, short traders saw another day of increased liquidations after the recent rise wiped out $239.02 million in short liquidations. Ethereum short traders were the major casualties, with liquidated positions worth $109.24 million — nearly triple the $37 million wiped from Bitcoin shorts, according to Coinglass data. The largest single liquidation occurred on Binance, where a trader lost $12 million on an ETH/USDT position.
The crypto market's rebound comes in correlation with a rise in the US stock market, where the S&P 500 has erased all of its post-reciprocal tariff losses and is now up 0.31% year-to-date (YTD), per Google Finance data.


