Avalanche Price Forecast: AVAX eyes $30 as bullish momentum builds across key metrics

แหล่งที่มา Fxstreet
  • Avalanche price approaches critical resistance at $26.07; a breakout could trigger a fresh rally.
  • On-chain data shows AVAX’s Spot Taker CVD is positive and rising, signaling buy-side dominance.
  • The technical outlook backs a continued upward move, with bulls targeting the $30 level.

Avalanche (AVAX) price shows signs of renewed bullish strength as it approaches a key resistance level at around $26.07 at the time of writing on Wednesday. Supported by positive on-chain metrics and a favorable technical outlook, the altcoin appears poised for further upside. With buying pressure increasing and momentum shifting in favor of the bulls, AVAX could be on track to hit the $30 mark in the coming days. 

Avalanche bulls take control of the momentum

CryptoQuant data, as shown in the graph below, highlights buying pressure on AVAX. The Taker CVD (Cumulative Volume Delta) for AVAX has been positive and has increased since early May. This indicator measures the cumulative difference between market buy and sell volumes over 3 months. When 90-day CVD is positive and increasing, it suggests the Taker Buy Dominant Phase, while a negative and decreasing value indicates the Taker Sell Dominant Phase.

AVAX Spot Taker CVD chart. Source: CryptoQuant

AVAX Spot Taker CVD chart. Source: CryptoQuant

CoinGlass’ data shows that the futures’ Open Interest (OI) in AVAX at exchanges rose from $488.25 million on Friday to $622.54 million on Wednesday, levels not seen since early February. An increasing OI represents new or additional money entering the market and new buying, which could fuel the current AVAX price rally.

AVAX open interest chart. Source: Coinglass

AVAX open interest chart. Source: Coinglass

Avalanche bulls could hit $30 if it closes above its key resistance 

Avalanche price has faced resistance around its 200-day Exponential Moving Average at $26.07 since Sunday. However, earlier this week, it retested and found support around its 100-day EMA at $23.21. At the time of writing on Wednesday, it approaches its key resistance at $26.07.

If AVAX breaks and closes above its 200-day EMA at $26.07 on a daily basis, it could extend the rally to retest its psychological barrier at $30.

The Relative Strength Index (RSI) on the daily chart reads 69, pointing upward toward its overbought levels of 70, indicating strong bullish momentum. However, traders should be cautious as the chances of a pullback are high due to the overbought condition. Another possibility is that the RSI remains above the overbought level of 70 and continues its upward trend.
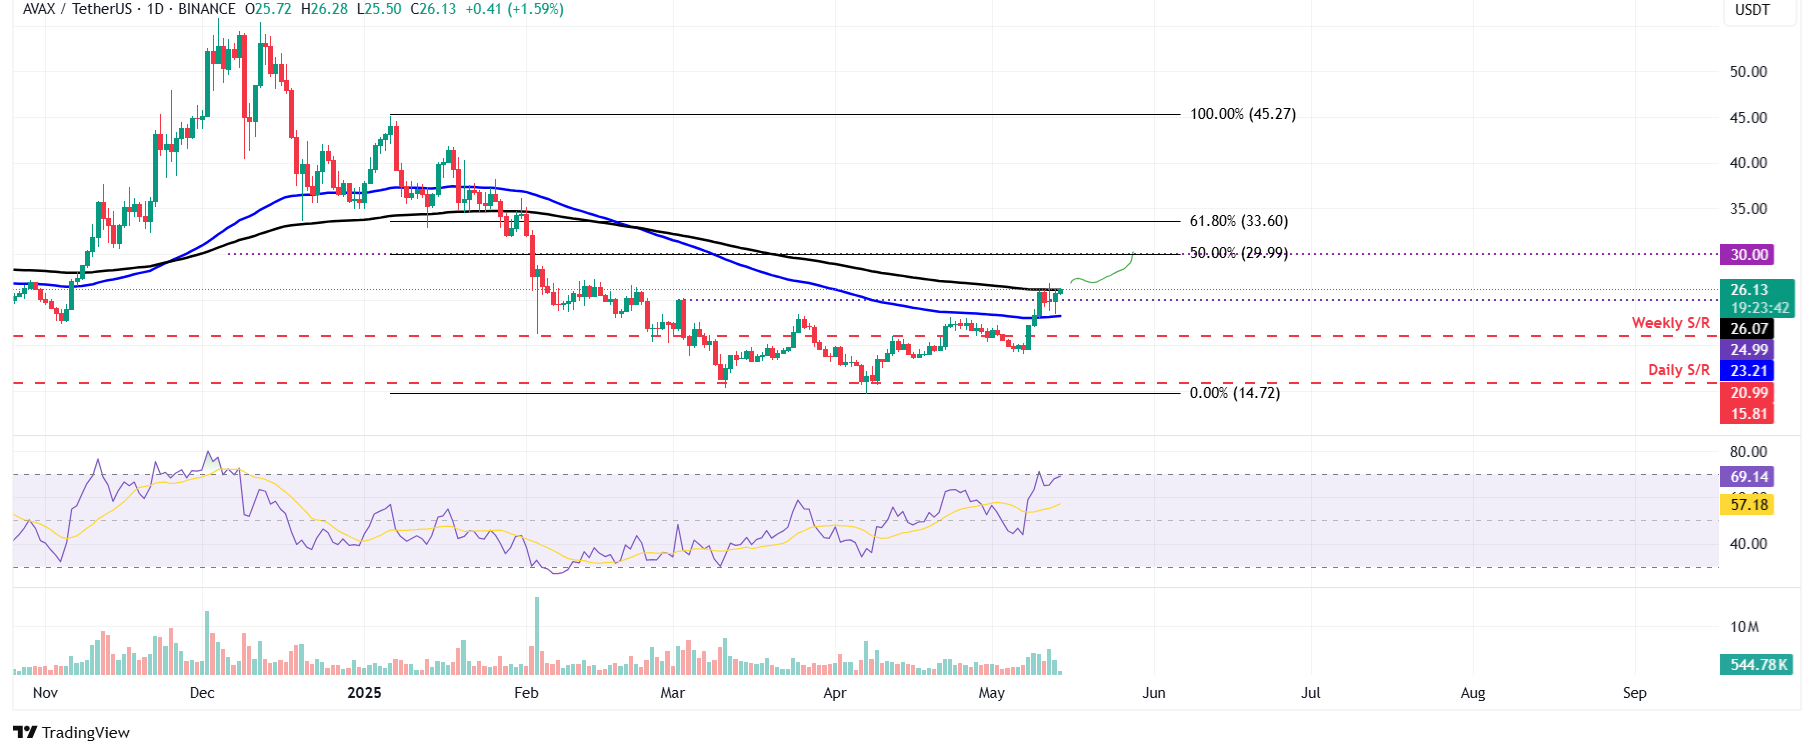
AVAX/USDT daily chart

AVAX/USDT daily chart

However, if AVAX faces a correction, it could extend the decline to test its 100-day EMA level at $23.21.

ข้อจำกัดความรับผิดชอบ: เพื่อการอ้างอิงเท่านั้น ผลการดำเนินงานในอดีตไม่ได้บ่งบอกถึงผลลัพธ์ในอนาคต
placeholder
คาดการณ์ XAUUSD: ราคาทองคำยังคงอยู่ในภาวะป้องกันท่ามกลางสัญญาณเชิงบวกจากการเจรจาการค้าสหรัฐฯ-จีนในช่วงเช้าของตลาดลงทุนเอเชียวันอังคาร ราคาทองคำ (XAU/USD) ขยับลงมาอยู่ที่ประมาณ $3,235 สินทรัพย์มีค่าดังกล่าวยังคงอยู่ในภาวะป้องกันตัวเนื่องจากดอลลาร์สหรัฐ (USD) ที่แข็งค่าขึ้น อัตราผลตอบแทนพันธบัตรของสหรัฐฯ ที่สูงขึ้น และความหวังเกี่ยวกับข้อตกลงการค้าระหว่างสหรัฐฯ กับจีน
ผู้เขียน  FXStreet
เมื่อวาน 02: 25
ในช่วงเช้าของตลาดลงทุนเอเชียวันอังคาร ราคาทองคำ (XAU/USD) ขยับลงมาอยู่ที่ประมาณ $3,235 สินทรัพย์มีค่าดังกล่าวยังคงอยู่ในภาวะป้องกันตัวเนื่องจากดอลลาร์สหรัฐ (USD) ที่แข็งค่าขึ้น อัตราผลตอบแทนพันธบัตรของสหรัฐฯ ที่สูงขึ้น และความหวังเกี่ยวกับข้อตกลงการค้าระหว่างสหรัฐฯ กับจีน
placeholder
การคาดการณ์ราคาโลหะเงิน: XAGUSD ขยับขึ้นใกล้ $33.00 โดยมีแนวโน้มขาขึ้นที่กำลังเกิดขึ้นราคาโลหะเงิน (XAG/USD) ปรับตัวเพิ่มขึ้นต่อเนื่องเป็นวันที่สี่ ติดต่อกัน โดยซื้อขายอยู่ที่ประมาณ $33.00 ต่อออนซ์ในช่วงชั่วโมงการลงทุนเอเชียวันอังคาร การวิเคราะห์ทางเทคนิคในกราฟรายวันชี้ให้เห็นถึงแนวโน้มขาขึ้น เนื่องจากโลหะมีค่ายังคงซื้อขายอยู่ภายในรูปแบบกรอบราคาขาขึ้น
ผู้เขียน  FXStreet
เมื่อวาน 06: 14
ราคาโลหะเงิน (XAG/USD) ปรับตัวเพิ่มขึ้นต่อเนื่องเป็นวันที่สี่ ติดต่อกัน โดยซื้อขายอยู่ที่ประมาณ $33.00 ต่อออนซ์ในช่วงชั่วโมงการลงทุนเอเชียวันอังคาร การวิเคราะห์ทางเทคนิคในกราฟรายวันชี้ให้เห็นถึงแนวโน้มขาขึ้น เนื่องจากโลหะมีค่ายังคงซื้อขายอยู่ภายในรูปแบบกรอบราคาขาขึ้น
placeholder
Coinbase พุ่งกว่า 10%! ร่วม S&P 500 กลายเป็นดาวเด่นใหม่ของคริปโตTradingKey – Coinbase ได้รับคัดเลือกเข้าเป็นสมาชิกในดัชนี S&P 500 ส่งผลให้ราคาหุ้นทะยานขึ้นมากกว่า 10% และสะท้อนถึงอิทธิพลที่เพิ่มขึ้นของคริปโตในตลาดแบบดั้งเดิมเมื่อวันจันทร์ที่ 12 พฤษภาคม (เวลา ET) S
ผู้เขียน  TradingKey
23 ชั่วโมงที่แล้ว
TradingKey – Coinbase ได้รับคัดเลือกเข้าเป็นสมาชิกในดัชนี S&P 500 ส่งผลให้ราคาหุ้นทะยานขึ้นมากกว่า 10% และสะท้อนถึงอิทธิพลที่เพิ่มขึ้นของคริปโตในตลาดแบบดั้งเดิมเมื่อวันจันทร์ที่ 12 พฤษภาคม (เวลา ET) S
placeholder
WTI ปรับตัวขึ้นต่อเหนือ $63.00 หลังจากความตึงเครียดทางการค้าลดลงน้ำมันดิบเวสต์เทกซัสอินเตอร์มีเดียต (WTI) ซึ่งเป็นเกณฑ์มาตรฐานน้ำมันดิบของสหรัฐฯ ซื้อขายอยู่ที่ประมาณ 63.25 ดอลลาร์ในช่วงเวลาการซื้อขายของเอเชียในวันพุธ ราคาของ WTI ขยายตัวขึ้นท่ามกลางความตึงเครียดทางการค้าที่ลดลงระหว่างสหรัฐฯ และจีน ซึ่งกระตุ้นให้เทรดเดอร์ลดความน่าจะเป็นของภาวะถดถอย
ผู้เขียน  FXStreet
7 ชั่วโมงที่แล้ว
น้ำมันดิบเวสต์เทกซัสอินเตอร์มีเดียต (WTI) ซึ่งเป็นเกณฑ์มาตรฐานน้ำมันดิบของสหรัฐฯ ซื้อขายอยู่ที่ประมาณ 63.25 ดอลลาร์ในช่วงเวลาการซื้อขายของเอเชียในวันพุธ ราคาของ WTI ขยายตัวขึ้นท่ามกลางความตึงเครียดทางการค้าที่ลดลงระหว่างสหรัฐฯ และจีน ซึ่งกระตุ้นให้เทรดเดอร์ลดความน่าจะเป็นของภาวะถดถอย
placeholder
USDCAD อ่อนค่าลงต่ำกว่า 1.3950 เนื่องจากเงินเฟ้อในสหรัฐฯ ชะลอตัวลงมากกว่าที่คาดการณ์ไว้ในเดือนเมษายนในช่วงเช้าของตลาดลงทุนเอเชียวันพุธ คู่ USDCAD ปรับตัวลดลงใกล้ 1.3925 ดอลลาร์สหรัฐ (USD) ขยับลงเมื่อเทียบกับดอลลาร์แคนาดา (CAD) หลังจากข้อมูลอัตราเงินเฟ้อออกมาต่ำกว่าคาดการณ์ของตลาด
ผู้เขียน  FXStreet
6 ชั่วโมงที่แล้ว
ในช่วงเช้าของตลาดลงทุนเอเชียวันพุธ คู่ USDCAD ปรับตัวลดลงใกล้ 1.3925 ดอลลาร์สหรัฐ (USD) ขยับลงเมื่อเทียบกับดอลลาร์แคนาดา (CAD) หลังจากข้อมูลอัตราเงินเฟ้อออกมาต่ำกว่าคาดการณ์ของตลาด
goTop
quote