
Meme Coins Price Prediction: TRUMP token rallies on World Liberty Financial launch as DOGE, PEPE struggle
- Dogecoin clings to the 200-day EMA, avoiding a drop to the $0.20 psychological support.
- Pepe eyes further losses as a steady rise in bearish momentum continues.
- The official Trump token recovers amid the buzz surrounding Donald Trump’s World Liberty Financial token listing.
The Official TRUMP (TRUMP) token leads the meme coin recovery, as segment leaders Dogecoin (DOGE) and Pepe (PEPE) face a growing risk of downside moves. The launch of US President Donald Trump’s World Liberty Financial on Binance and Bithumb exchanges is a driving factor behind the TRUMP token’s renewed interest.
TRUMP meme coin takes the spotlight in the derivatives market
CoinGlass data shows that the Open Interest (OI) of the TRUMP token has increased by over 26% in the last 24 hours, reaching $516.28 million. This significant capital inflow in TRUMP derivatives refers to increased traders’ interest.
Dogecoin OI remains relatively stable, increasing by 0.41%, at $3.34 billion, while the PEPE OI drops over 3% in the same time period, reaching $553.96 million.
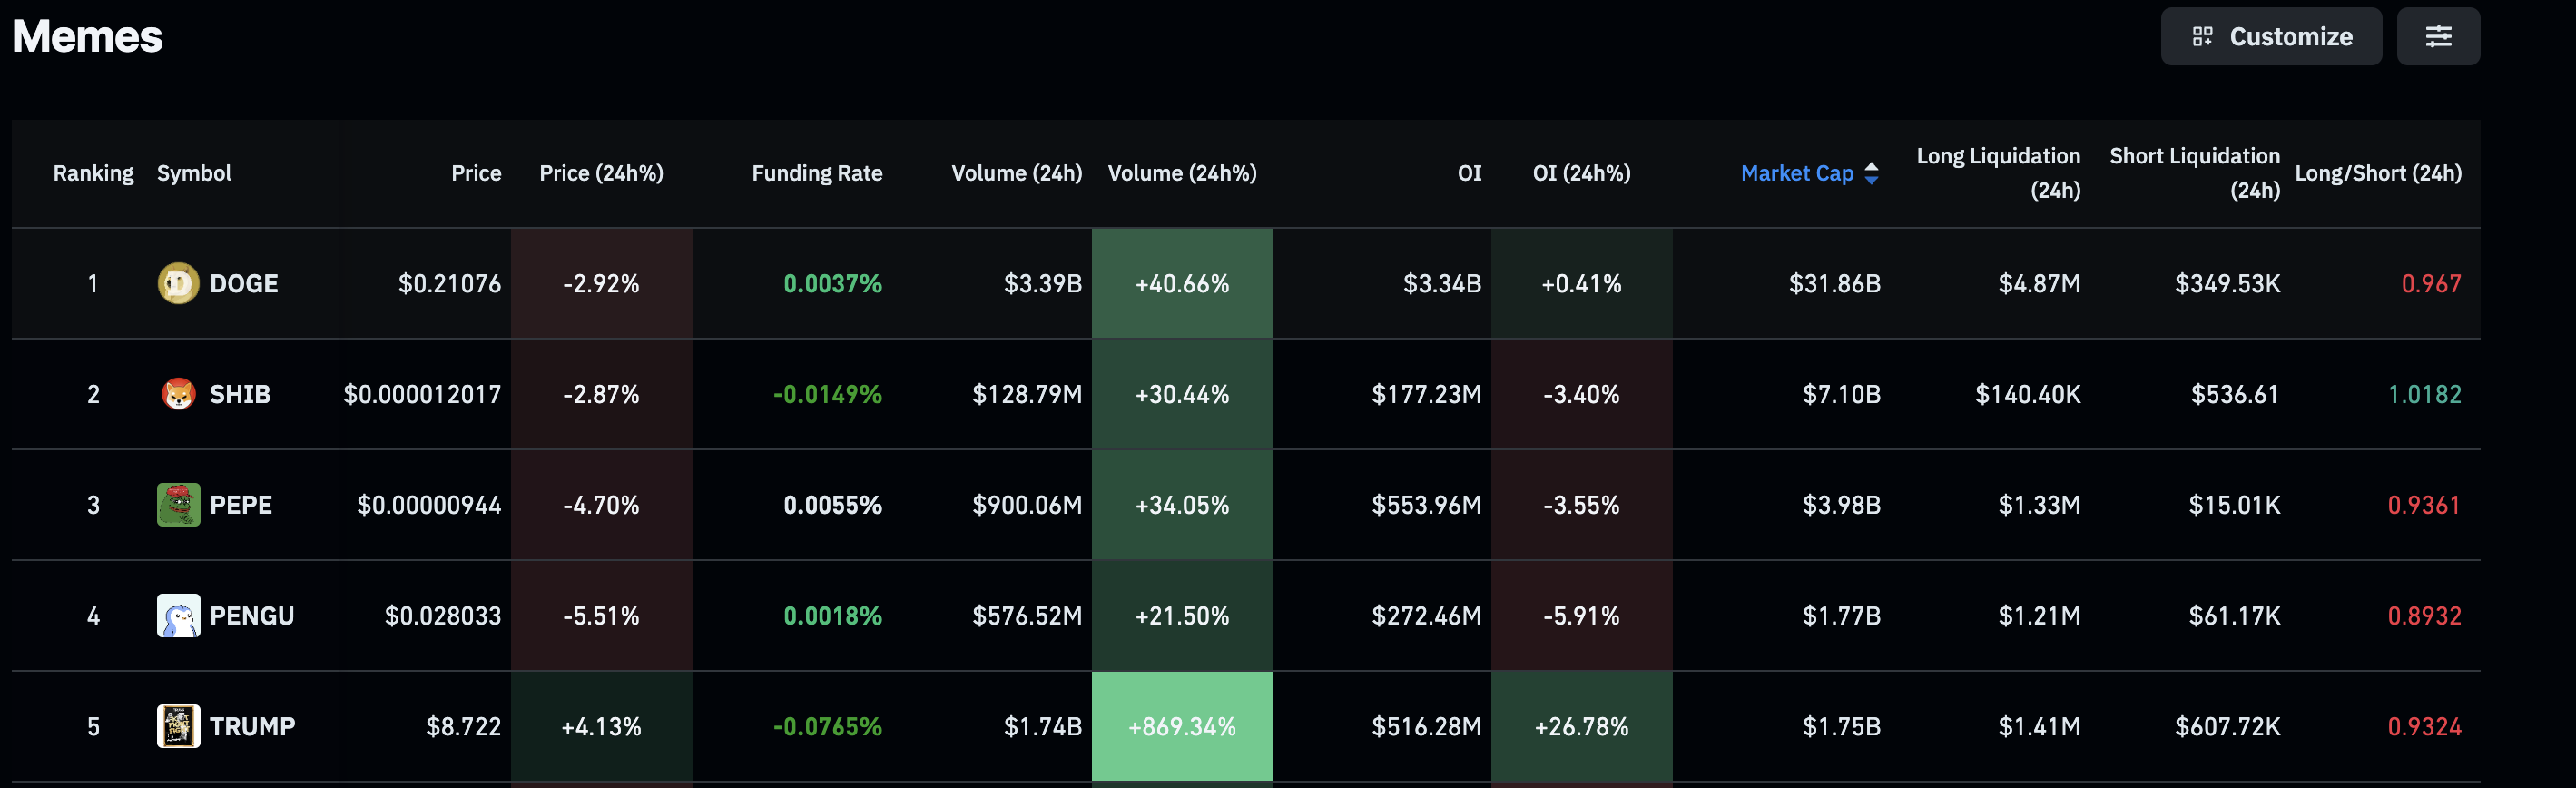
Meme Coins Open Interest. Source: Coinglass
Trump token’s trendline breakout signals a potential bullish trend revival
The Official Trump token, backed by US President Donald Trump, is gradually gaining traction, with trading volume surging over 800% in the last 24 hours. The renewed interest is supported by the launch of WLFI listing on crypto exchanges such as Binance and Bithumb, accompanied by the USD1 stablecoin launch on Solana.
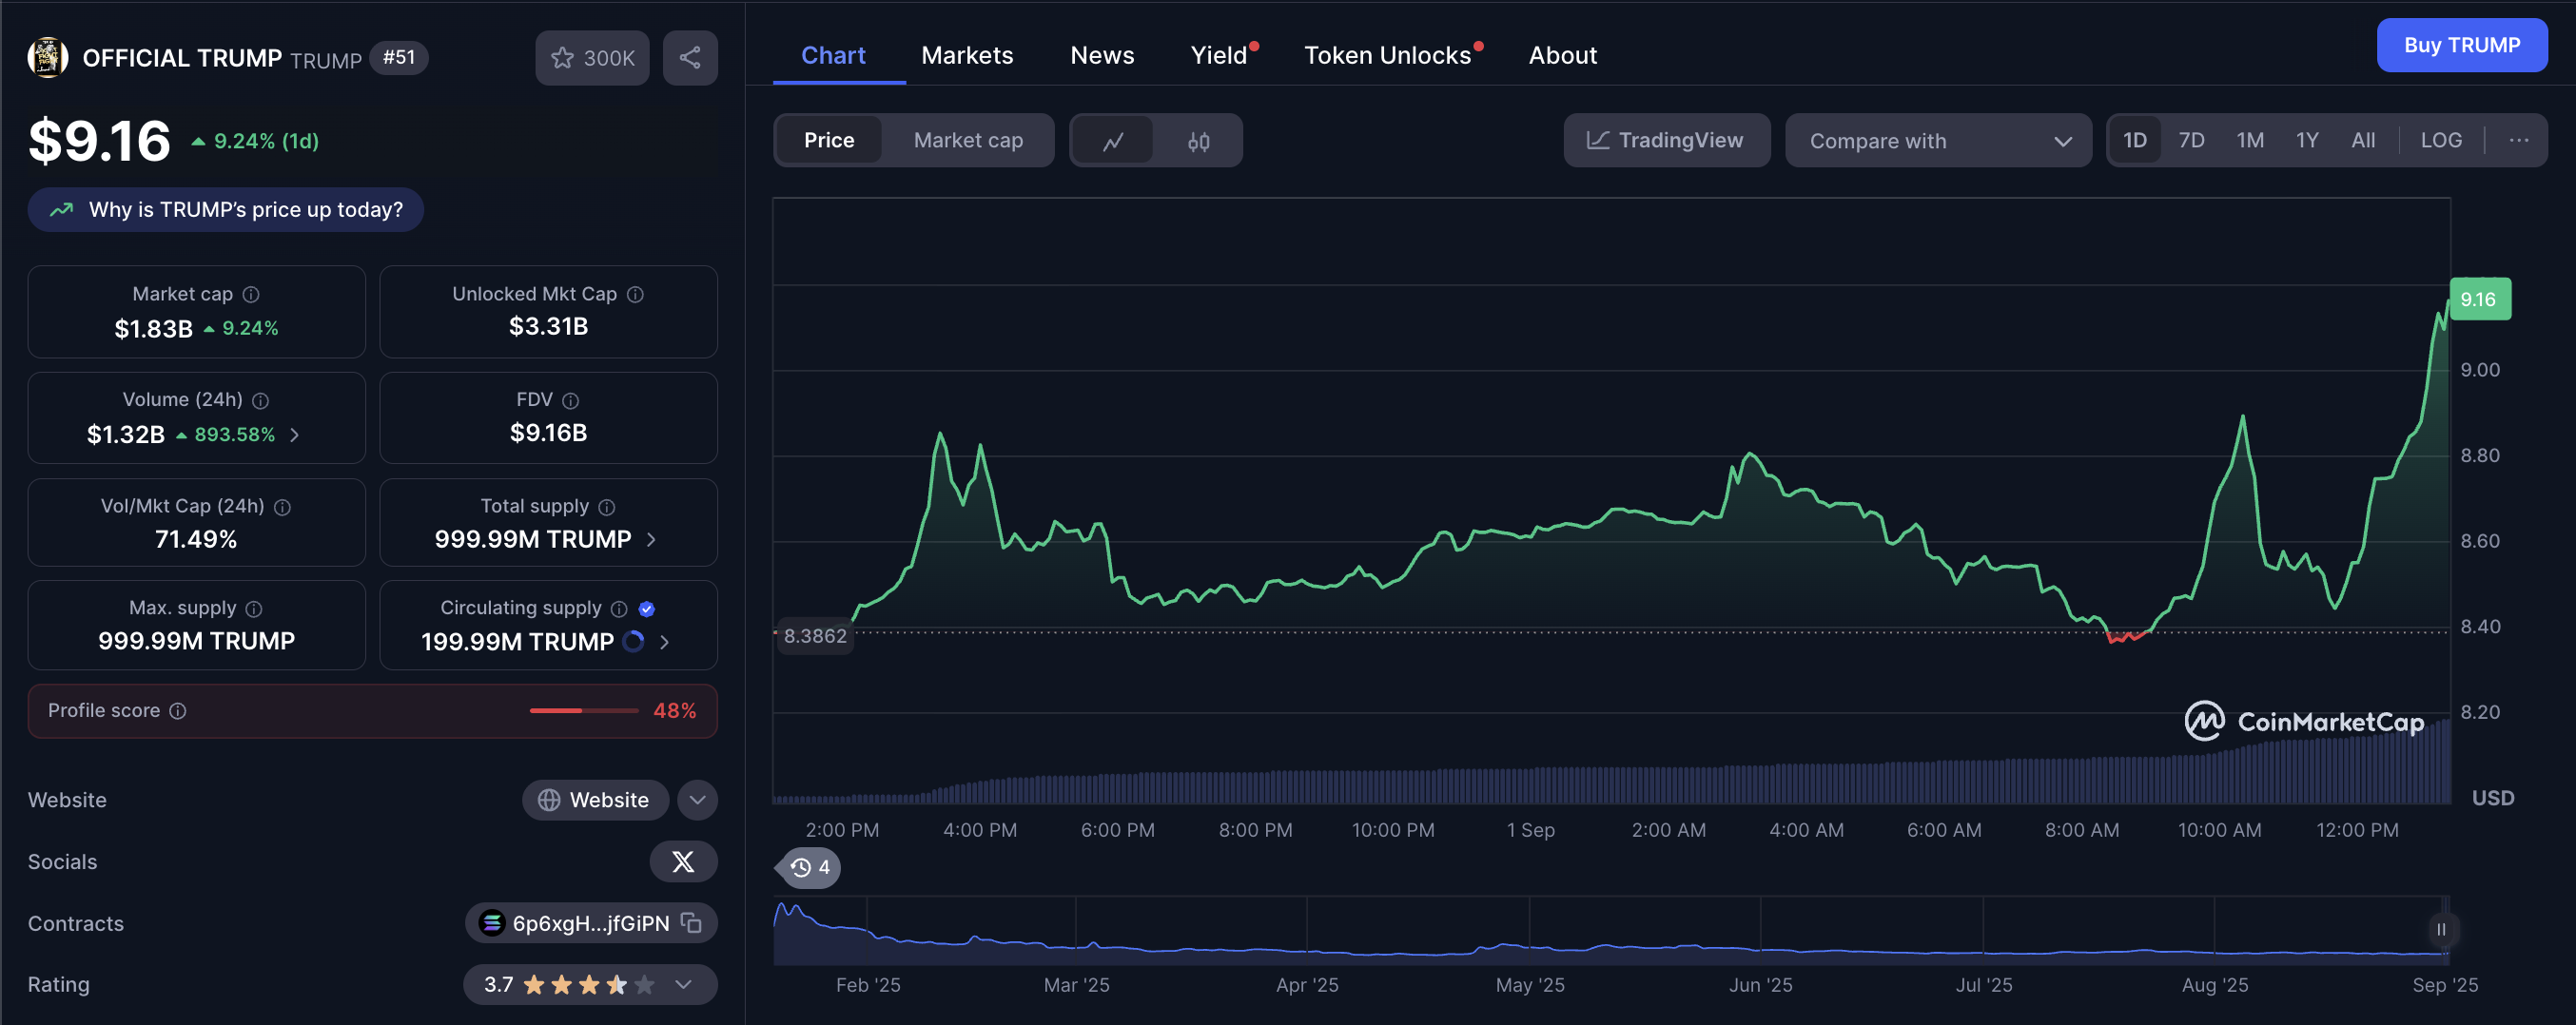
TRUMP market data. Source: CoinMarketCap
TRUMP edges higher by 6% at press time on Monday, crossing the 50-day Exponential Moving Average (EMA) at $9.13. The meme coin also exceeds the resistance trendline formed by connecting the May 22 and August 14 peaks.
A decisive close above this EMA could extend the uptrend towards the R1 pivot level at $9.89.
The recovery in bullish momentum fuels the Moving Average Convergence Divergence (MACD) above its signal line, flashing a buy signal. Furthermore, the Relative Strength Index (RSI) at 54, indicating a bullish exit from neutral levels, suggests that buying pressure is intensifying.
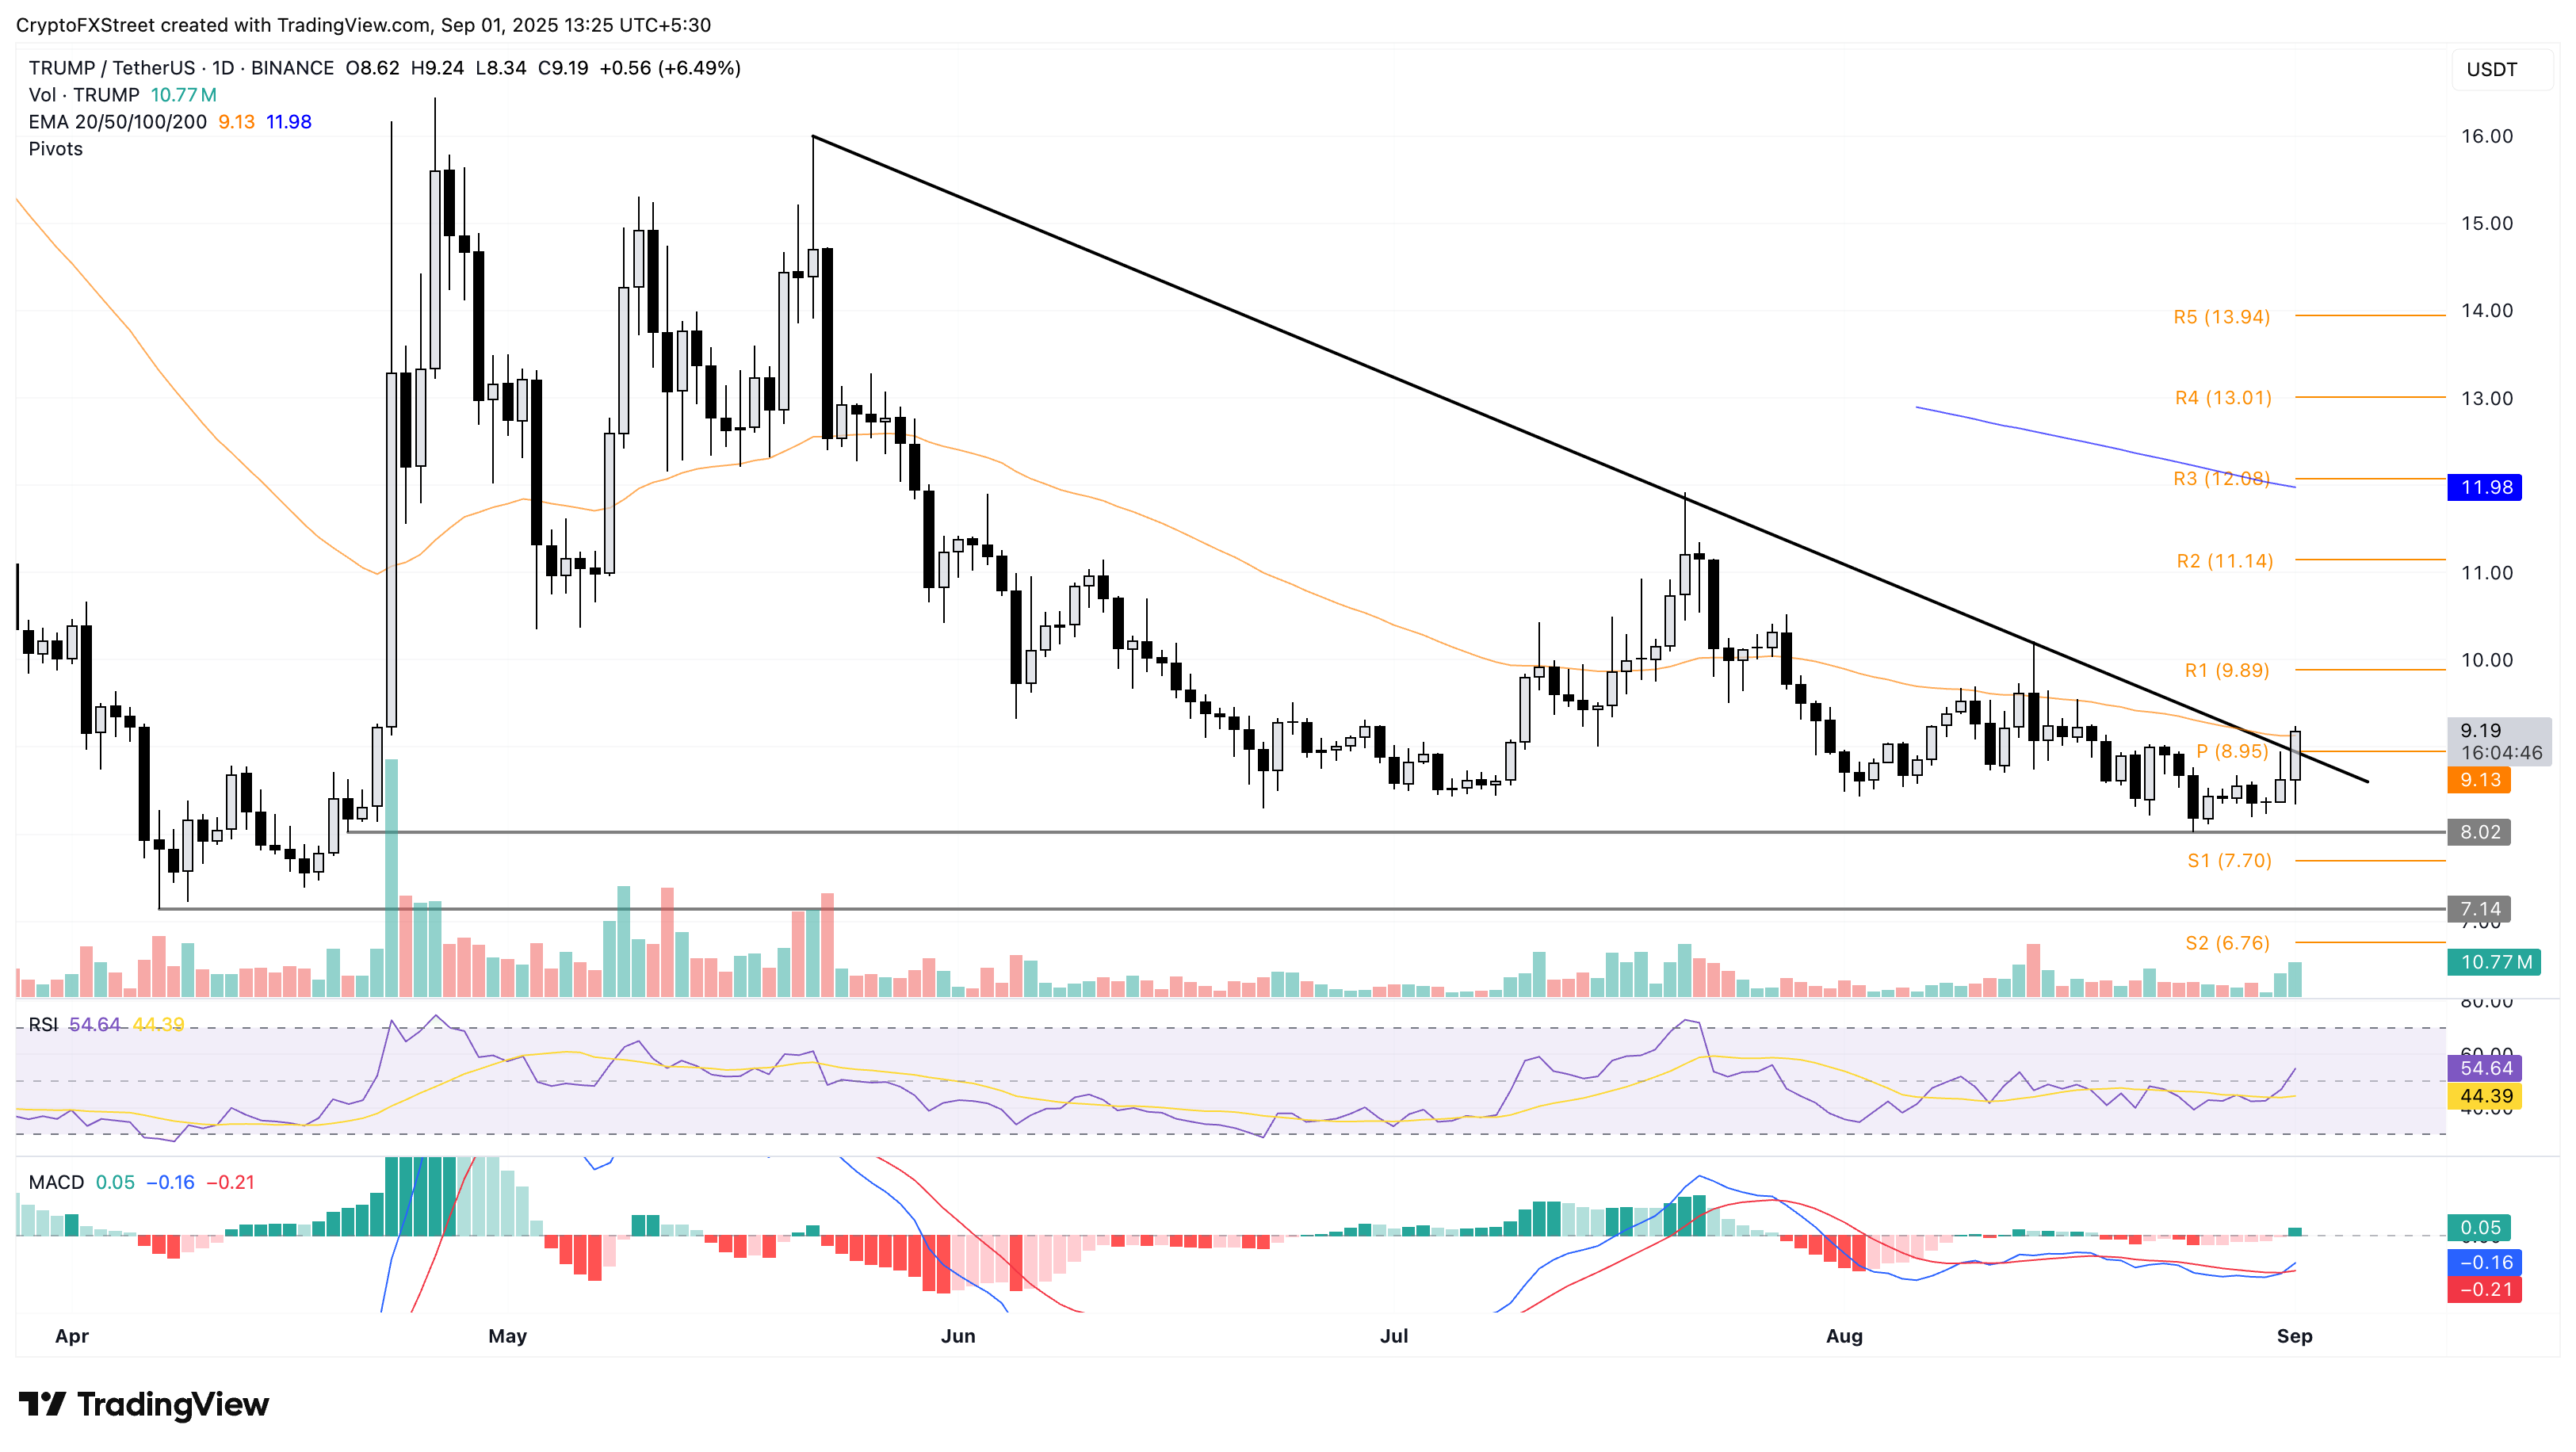
TRUMP/USDT daily price chart.
Looking down, a reversal in the TRUMP token could retest the support level at $8.02, last tested on August 25.
Dogecoin clings to the 200-day EMA as downside risk persists
Dogecoin bounces off by over 1% from the 200-day EMA at press time on Monday, with bulls actively trying to avoid further losses. To reinforce a recovery run, DOGE should surpass the peak from Thursday at $0.2257, which could result in an extension to the $0.2407 resistance, last tested on August 24.
The RSI at 48 moves almost flat near the halfway line, projecting a neutral standpoint. Still, the MACD and signal lines are slightly declining, which indicates a bearish tilt in trend momentum.
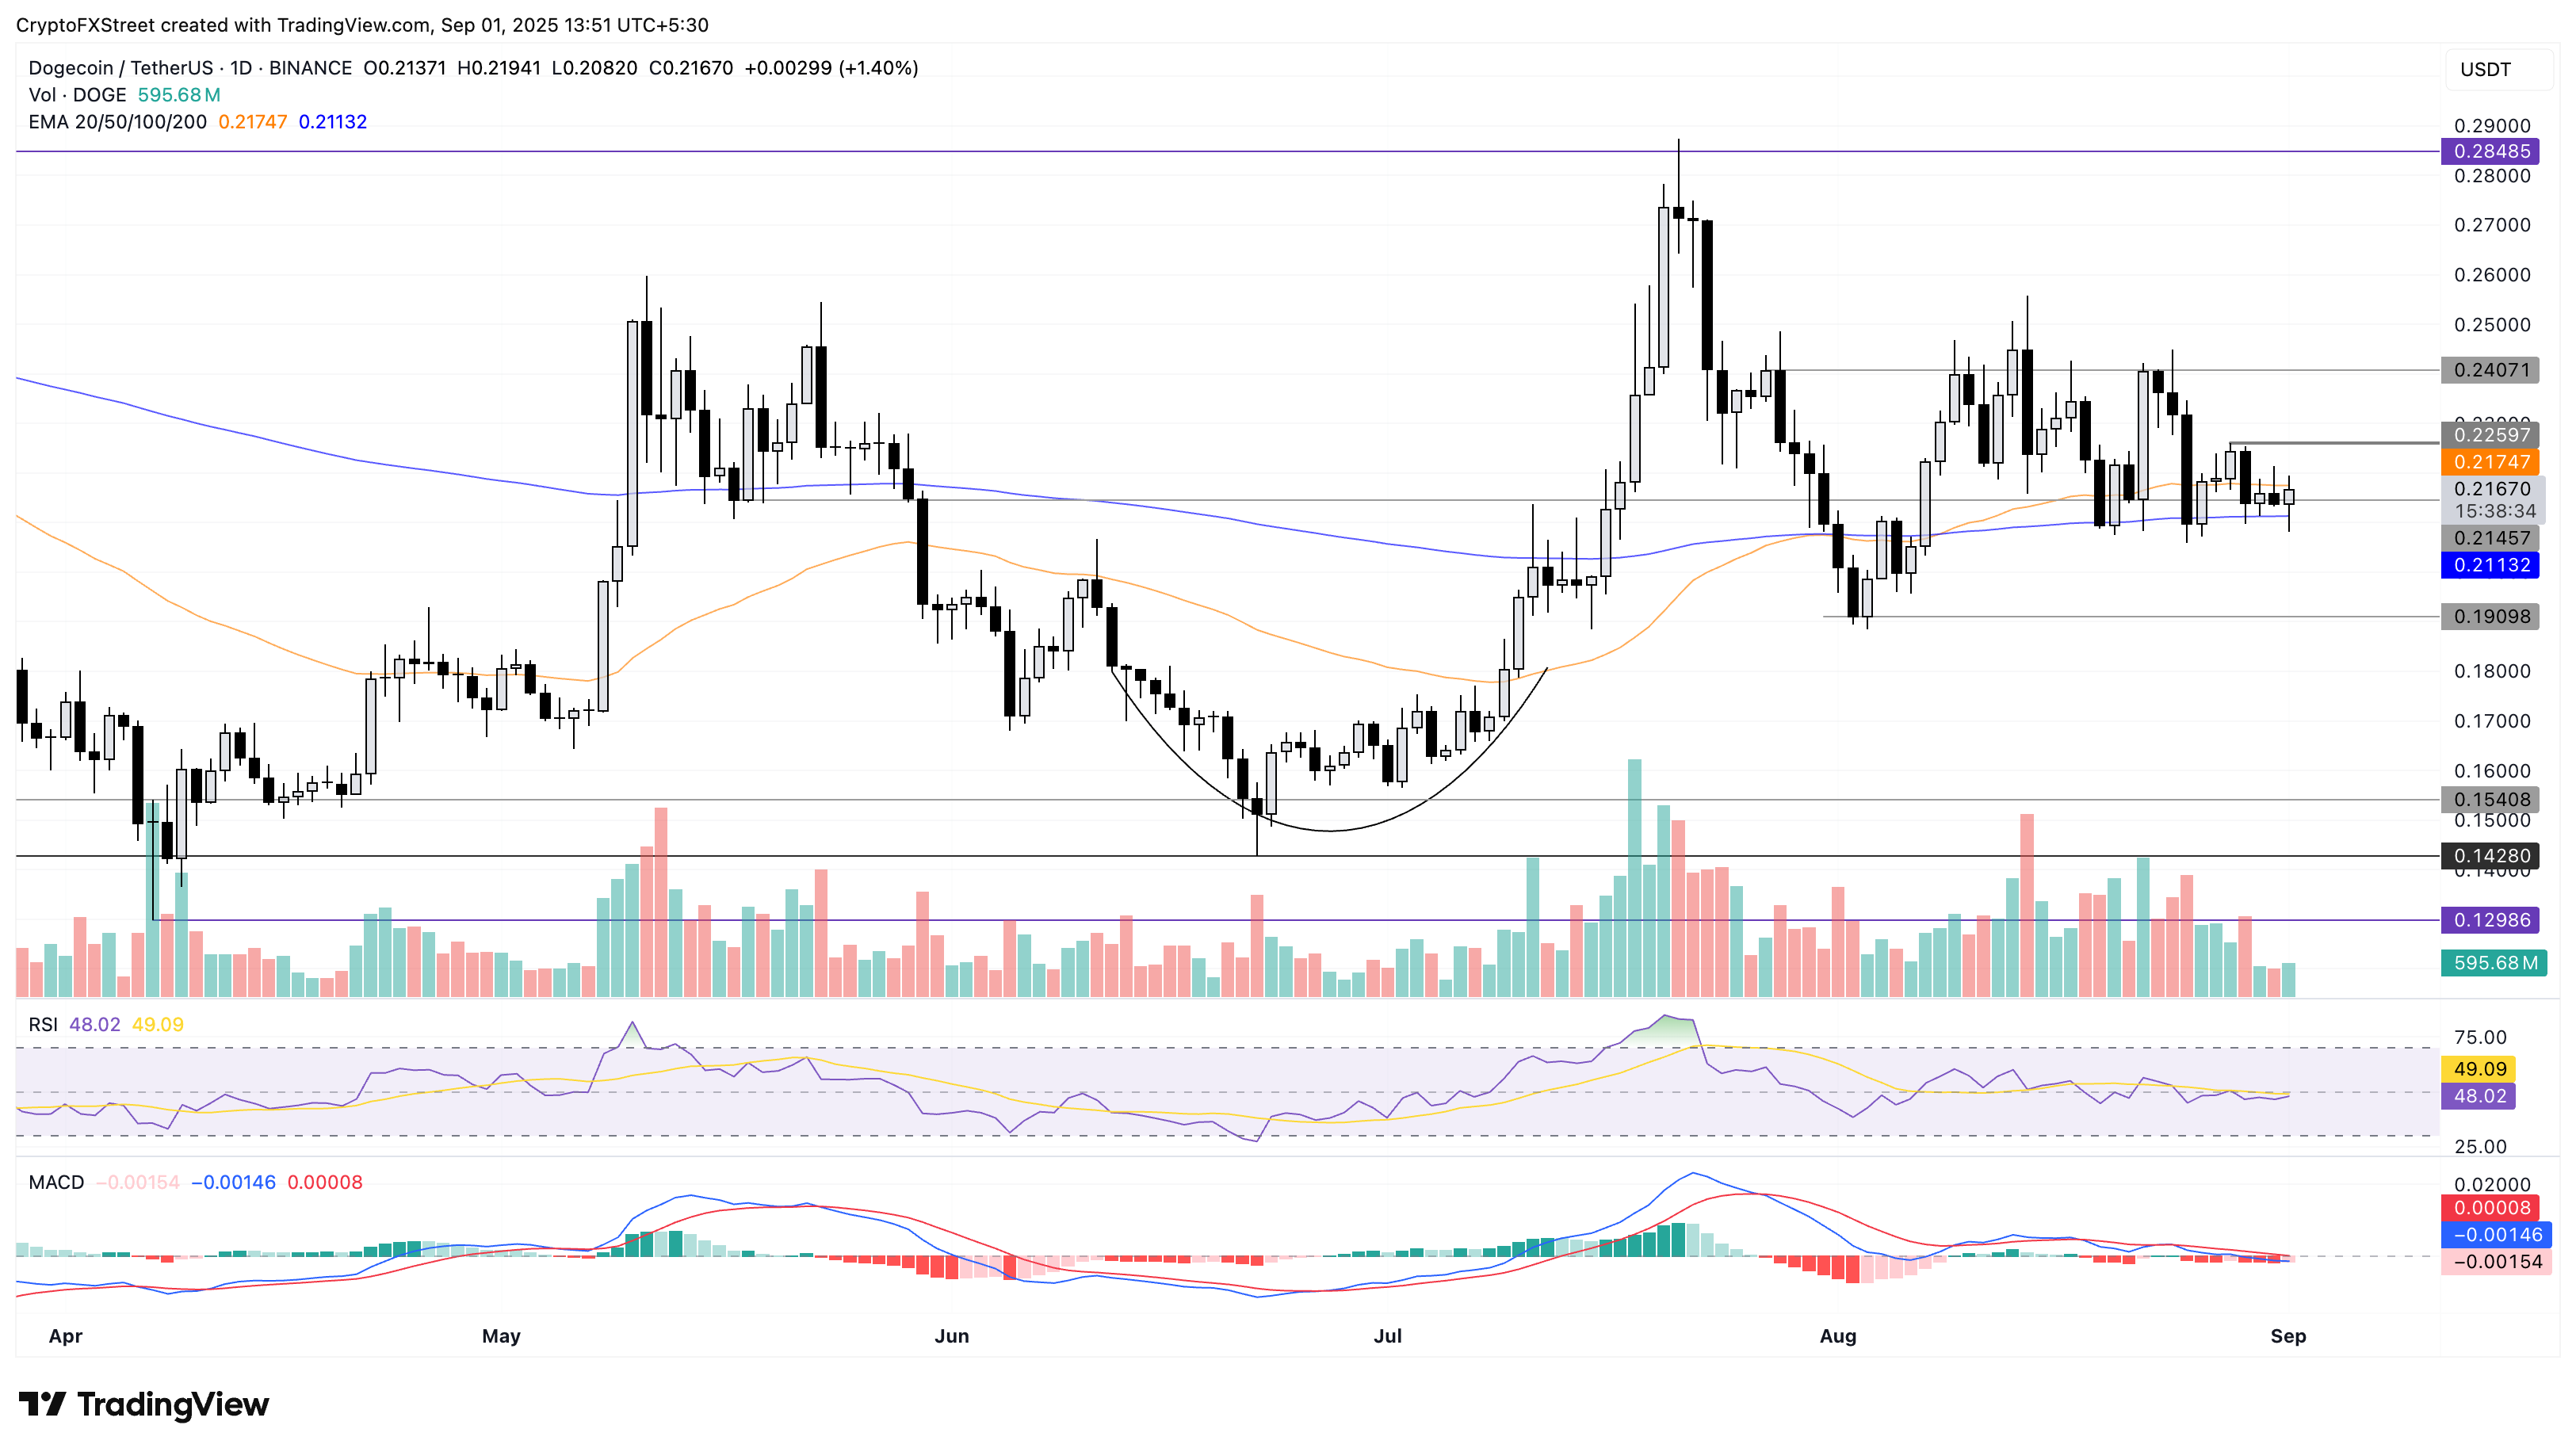
DOGE/USDT daily price chart.
If Dogecoin marks a daily close below the 200-day EMA at $0.2113, it could extend the decline to $0.1909 support level.
Pepe risks further losses amid a Death Cross pattern
PEPE starts the week on a recovering note, gaining almost 1% at the time of writing on Monday, following the 10.9% drop last week. The frog-themed meme coin dropped below the $0.00001000 psychological level last week as the 50-day EMA crossed below the 200-day EMA, signaling a Death Cross pattern, which translates to a sell signal as short-term bearishness outpaces the prevailing trend.
The declining trend in PEPE targets the $0.00000887 support level, marked by the June 22 close, the lowest in three months.
Adding to the downside risk, the momentum indicators, such as the RSI at 41, indicate room for further correction. Additionally, the MACD and its signal line are on a downtrend, suggesting the bearish momentum is on the rise.
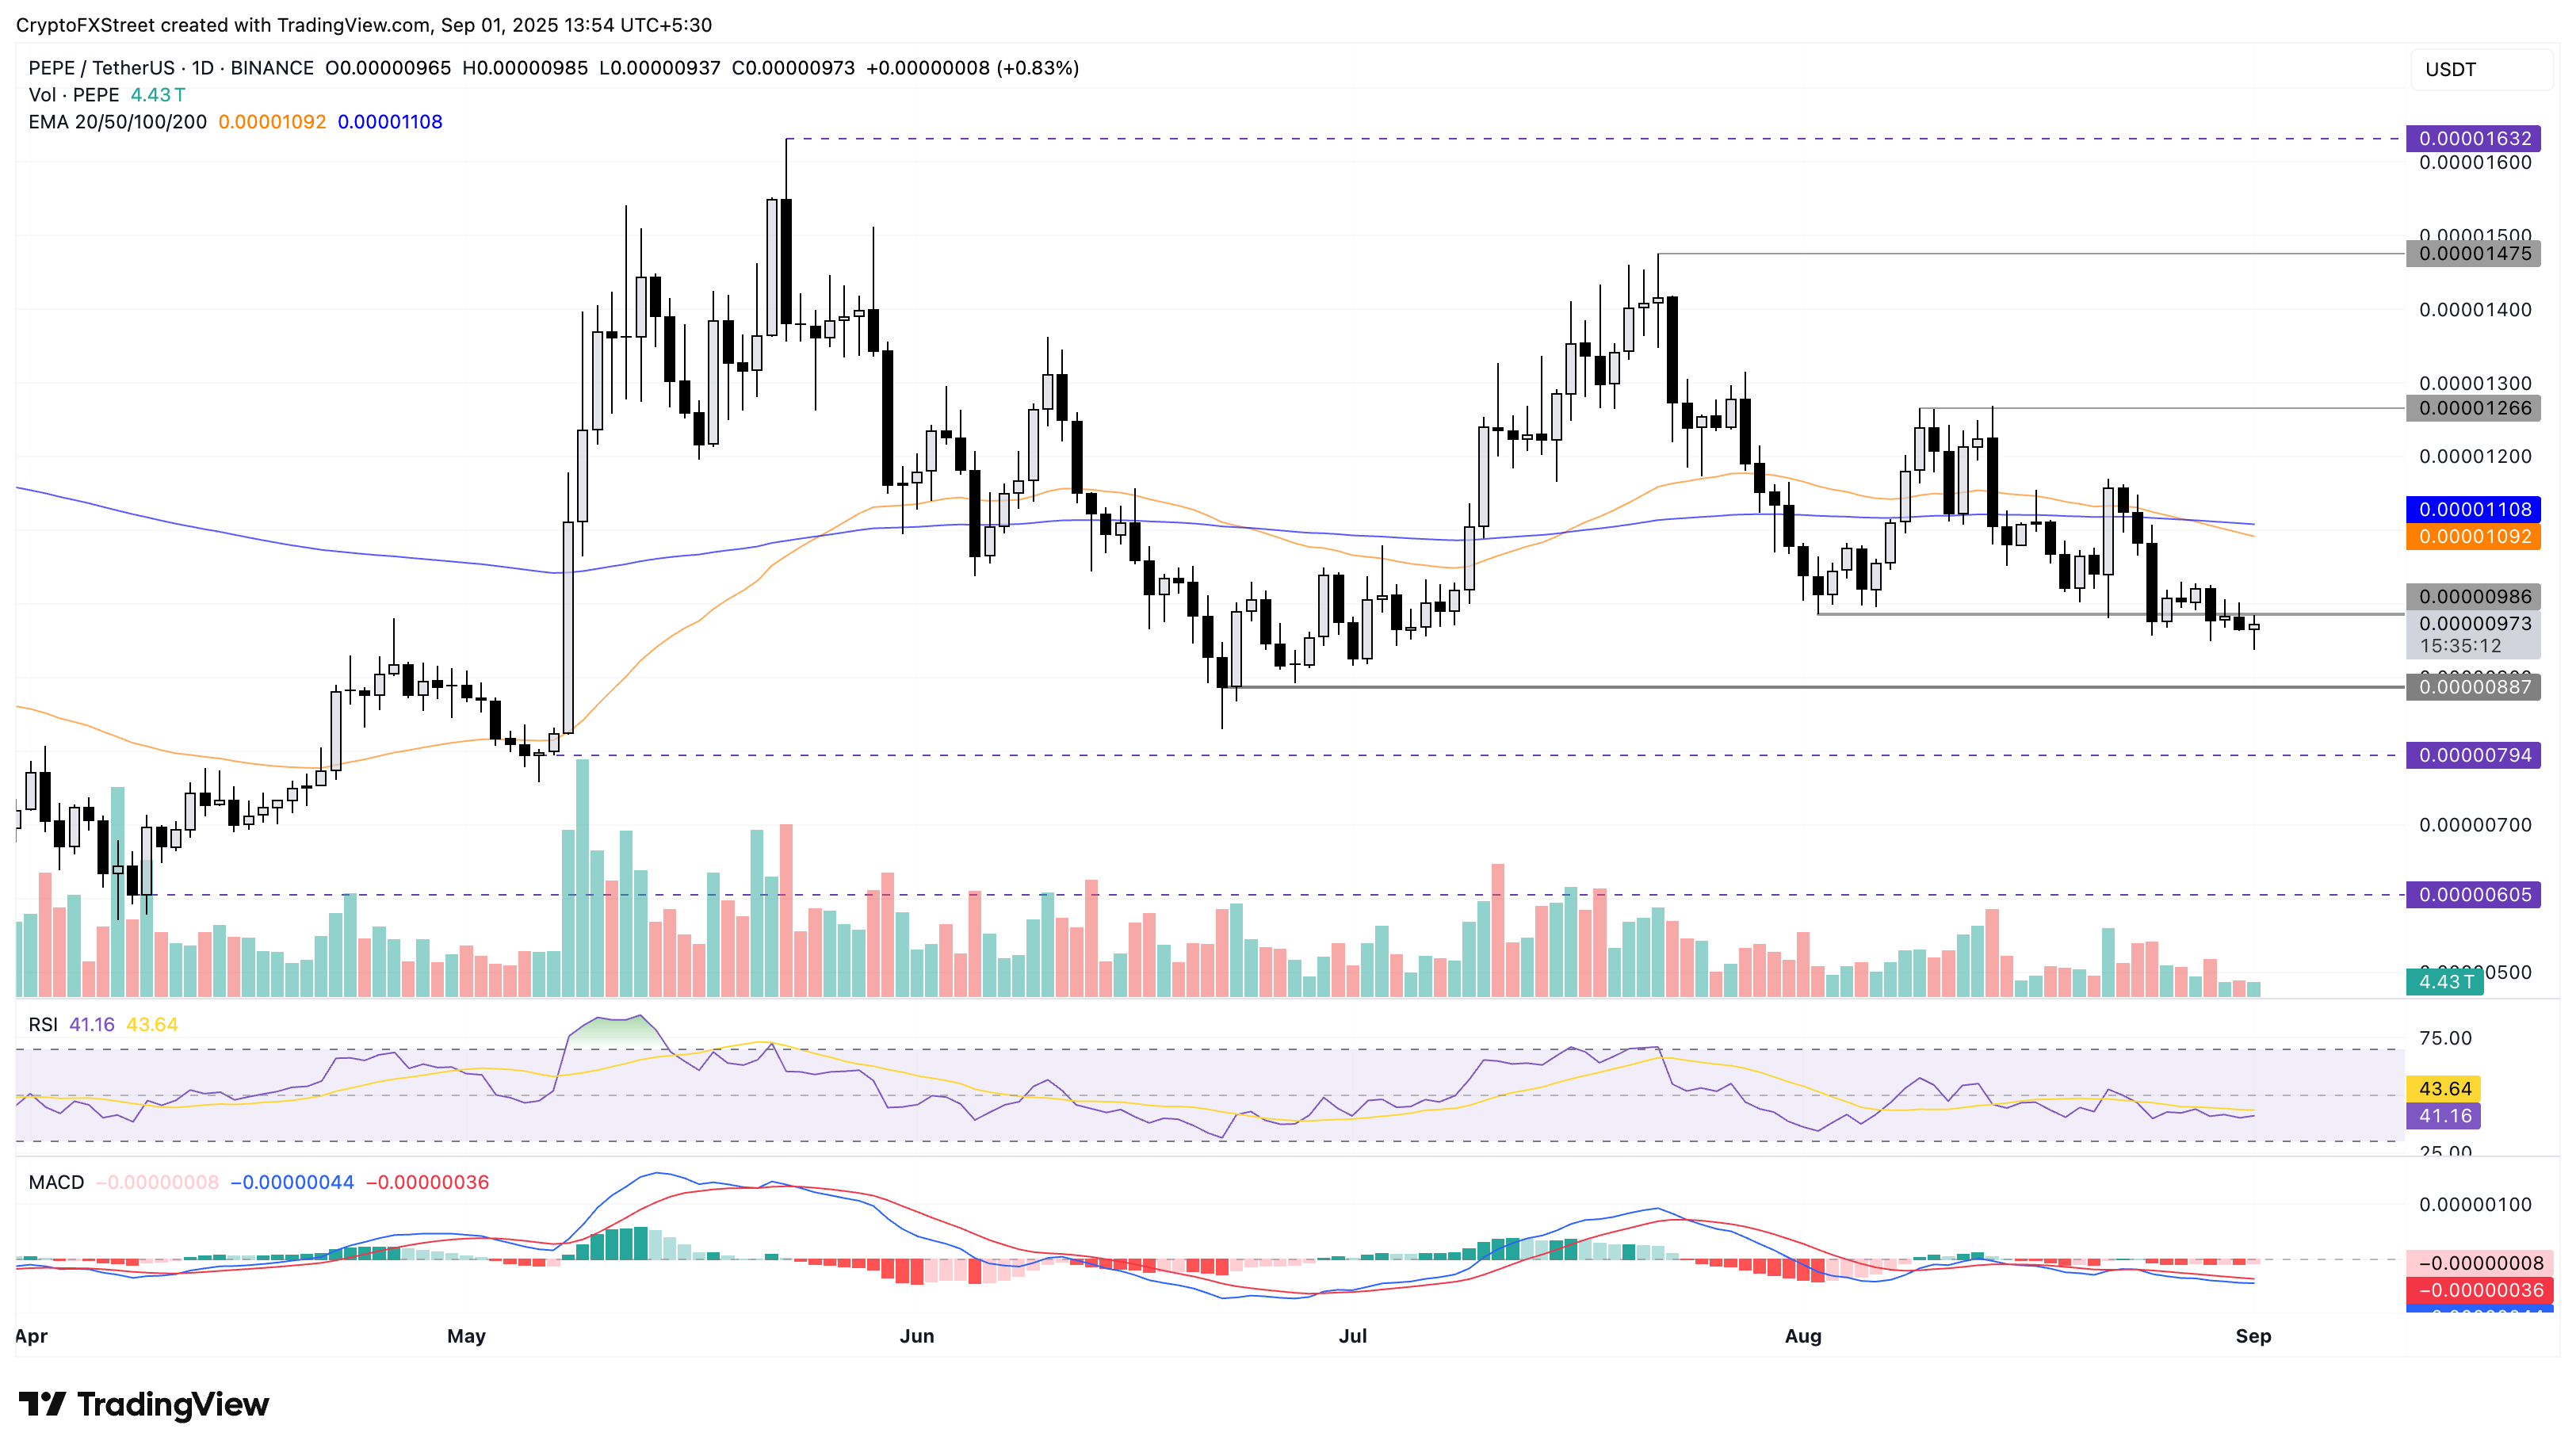
PEPE/USDT daily price chart.
Looking up, PEPE should reclaim the $0.00001000 psychological level to reinforce a bullish trend.
บทความแนะนำ


