


Bitcoin vs Gold Forecast: BTC and XAU extend losses ahead of Fed Minutes
- Bitcoin slides and tests the short-term support at $64,000 as risk-off sentiment deepens.
- Gold falls for the third consecutive day, trading below $3,800 on Wednesday.
- Market participants turn their attention to the Fed’s October meeting Minutes release ahead of the December FOMC.
Bitcoin (BTC) and Gold (XAU/USD) are trading under increasing selling pressure on Wednesday. The largest cryptocurrency by market capitalization is down about 1.5%, testing support at $64,000, while Gold hovers below $3,800, as traders appear to be repositioning ahead of the release of the Federal Open Market Committee (FOMC) October meeting Minutes.
Focus shifts to FOMC Minutes
Market participants are awaiting the release of October’s FOMC meeting Minutes later on Wednesday. The Minutes are likely to offer detailed views from Federal Reserve (Fed) officials on monetary policy, data, and risks emphasized during the meeting, as well as the degree of consensus or disagreement. In other words, the Minutes explain the reasons behind the policy decision, helping investors reinforce their expectations of the interest rate path and direction.
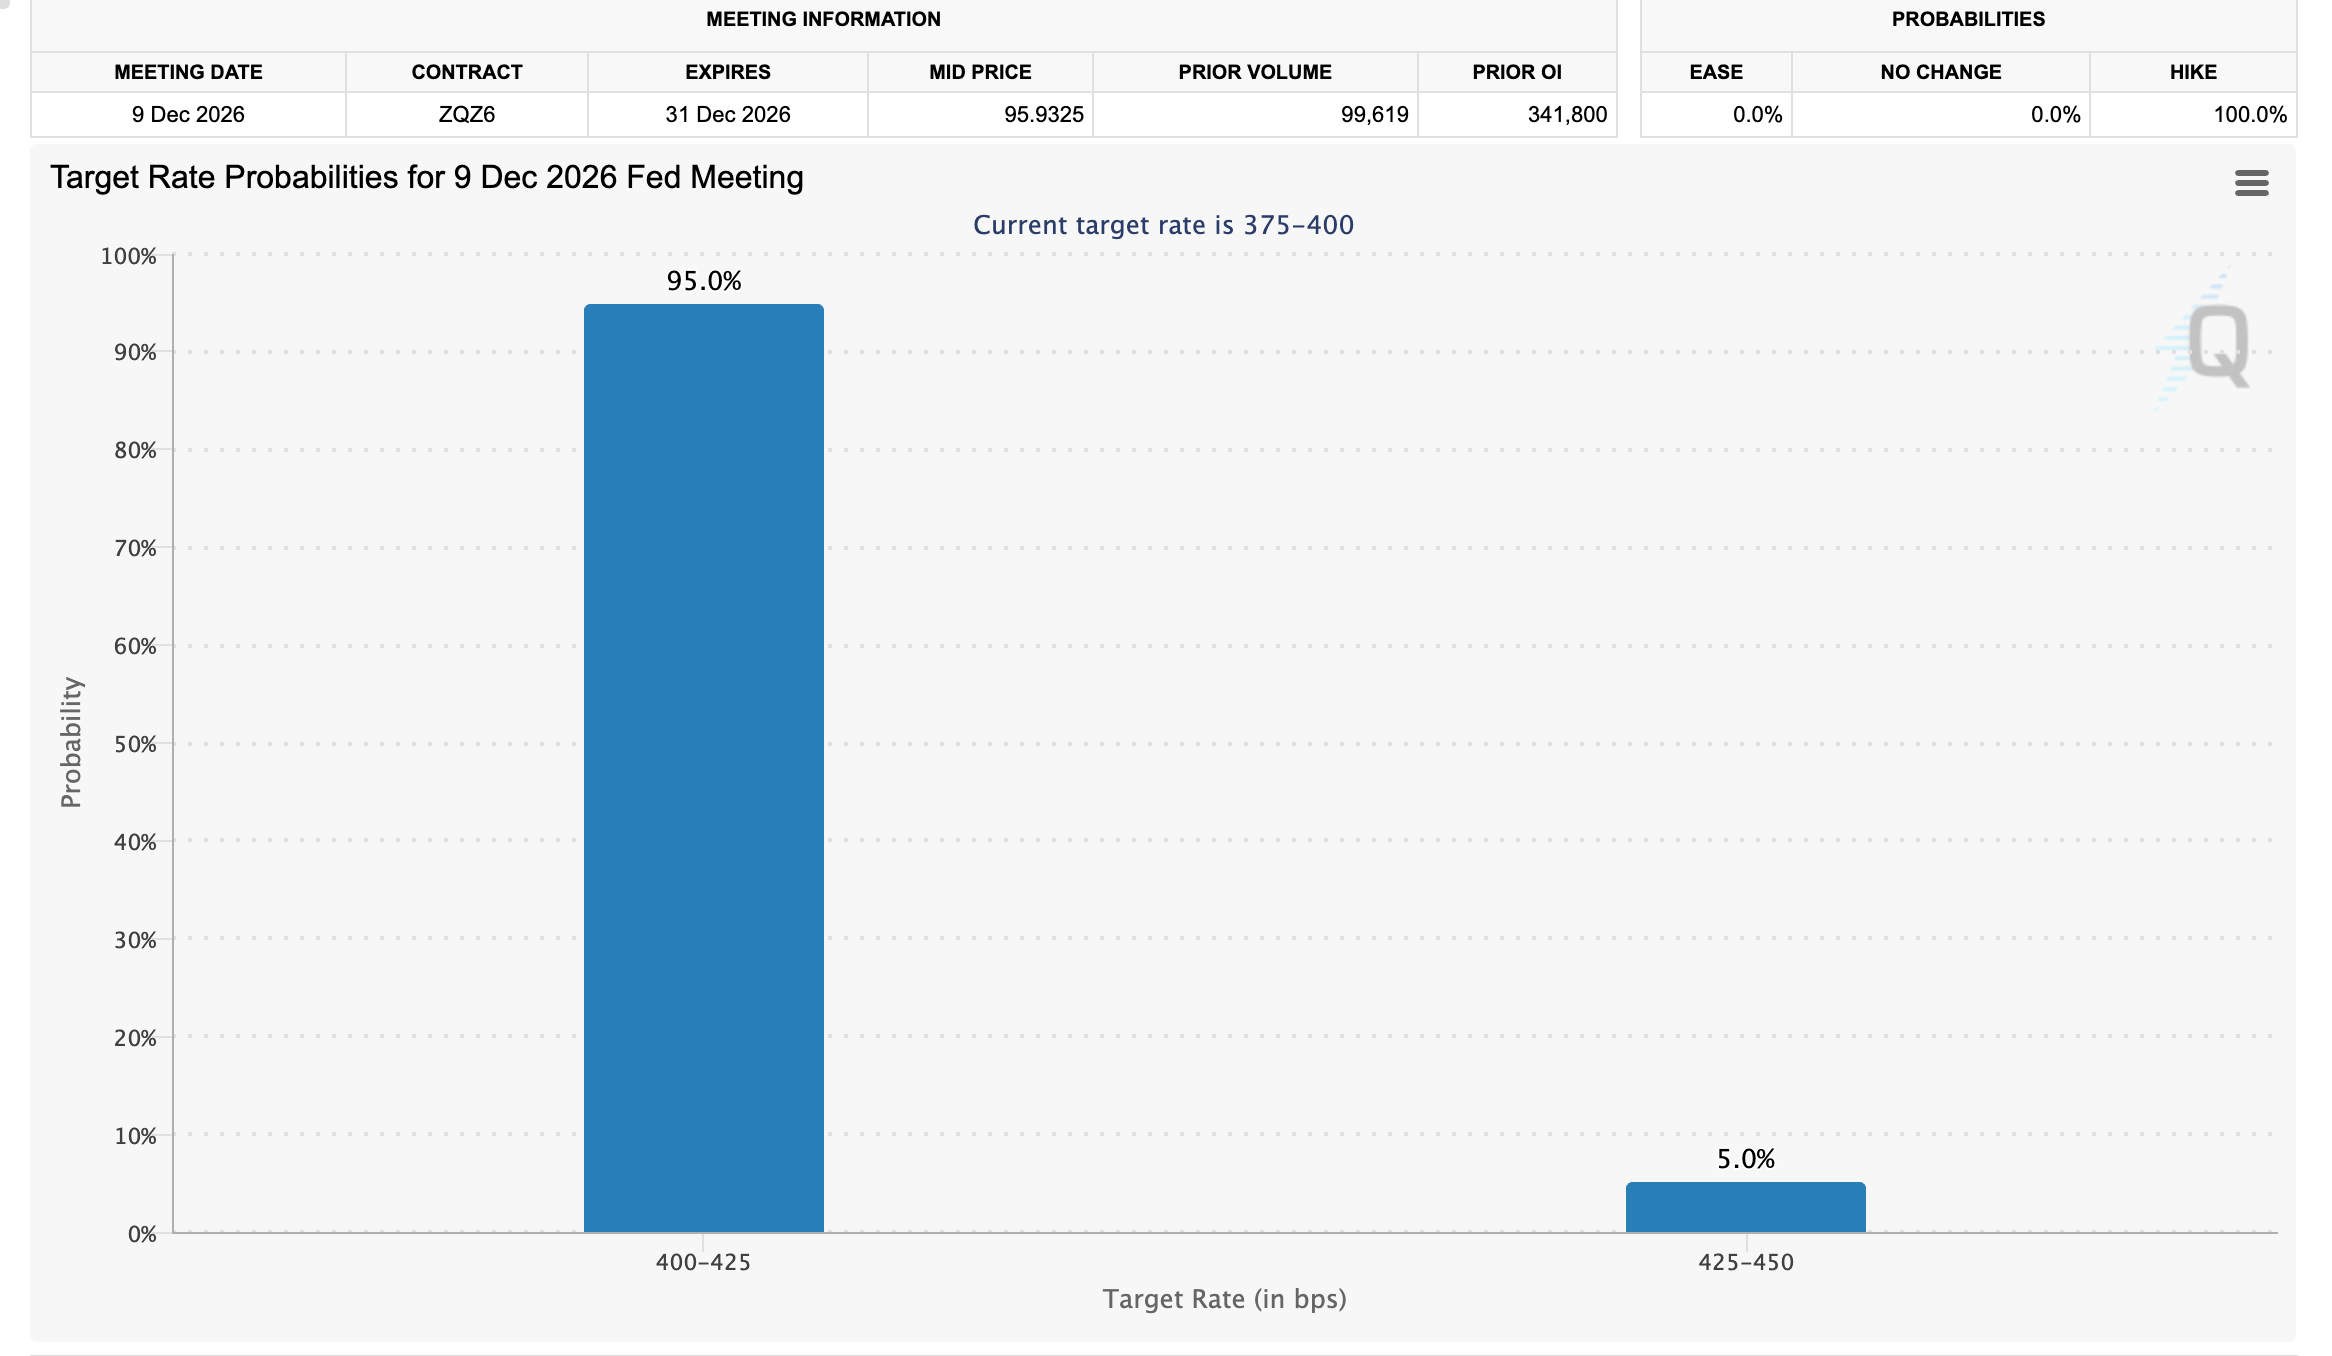
The CME Group’s FedWatch Tool currently shows 95% odds that the Fed will hike interest rates by 25 basis points in December to the 4.00-4.25% range. Only 5% of derivatives traders expect a 50-basis-point hike to the 4.25-4.50% range.
The central bank remains committed to bringing inflation in the United States (US) down to the 2% long-term target. However, sticky price pressures suggest the journey to this target could be an uphill battle in the Fed’s dual mandate to promote maximum employment while stabilizing prices.
Meanwhile, the Fear & Greed Index is at 11 in Extreme Fear territory on Wednesday, down only marginally from 12 the day before, still in the same range. This setup suggests appetite continues to fade, weighing on demand for risk assets, especially crypto.
Technical analysis: Bitcoin sellers tighten grip
Bitcoin trades at $64,031, extending a sharp bearish phase as it holds well below the 50-day, 100-day and 200-day Exponential Moving Averages (EMAs) clustered between roughly $75,750 and $76,000, which now sit far above price and underscore a heavy downside bias.
The Moving Average Convergence Divergence (MACD) indicator remains deeply negative, while the Relative Strength Index (RSI) falls to about 23, signaling oversold conditions that could slow selling pressure but have yet to trigger a meaningful rebound.
On the downside, with spot already trading significantly under the major moving average cluster, immediate reference support is psychological and horizontal rather than trend-based, as the key EMAs at $75,754 (50-day), $75,765 (200-day) and $75,997 (100-day) stay well above current price and will act as notable resistance on any sustained recovery attempt.
A daily close back toward this EMA cluster would be needed to ease the current bearish grip. Below this range, oversold momentum suggests any bounces are likely to be corrective within a still-dominant downward phase.
Technical analysis: Gold decline deepens
Gold trades at $3,784, extending a pronounced decline and holding well below its main moving averages, which keeps the near-term bias firmly bearish. The 50-day EMA at $4,089, the 100-day EMA at $4,188, and the 200-day EMA at $4,234 all run overhead, suggesting a mature topping phase and reinforcing the idea of rallies being sold.
Momentum readings back this negative tone, with the RSI hovering near the oversold boundary at 33 and the MACD indicator deeply negative, hinting that downside pressure remains dominant.
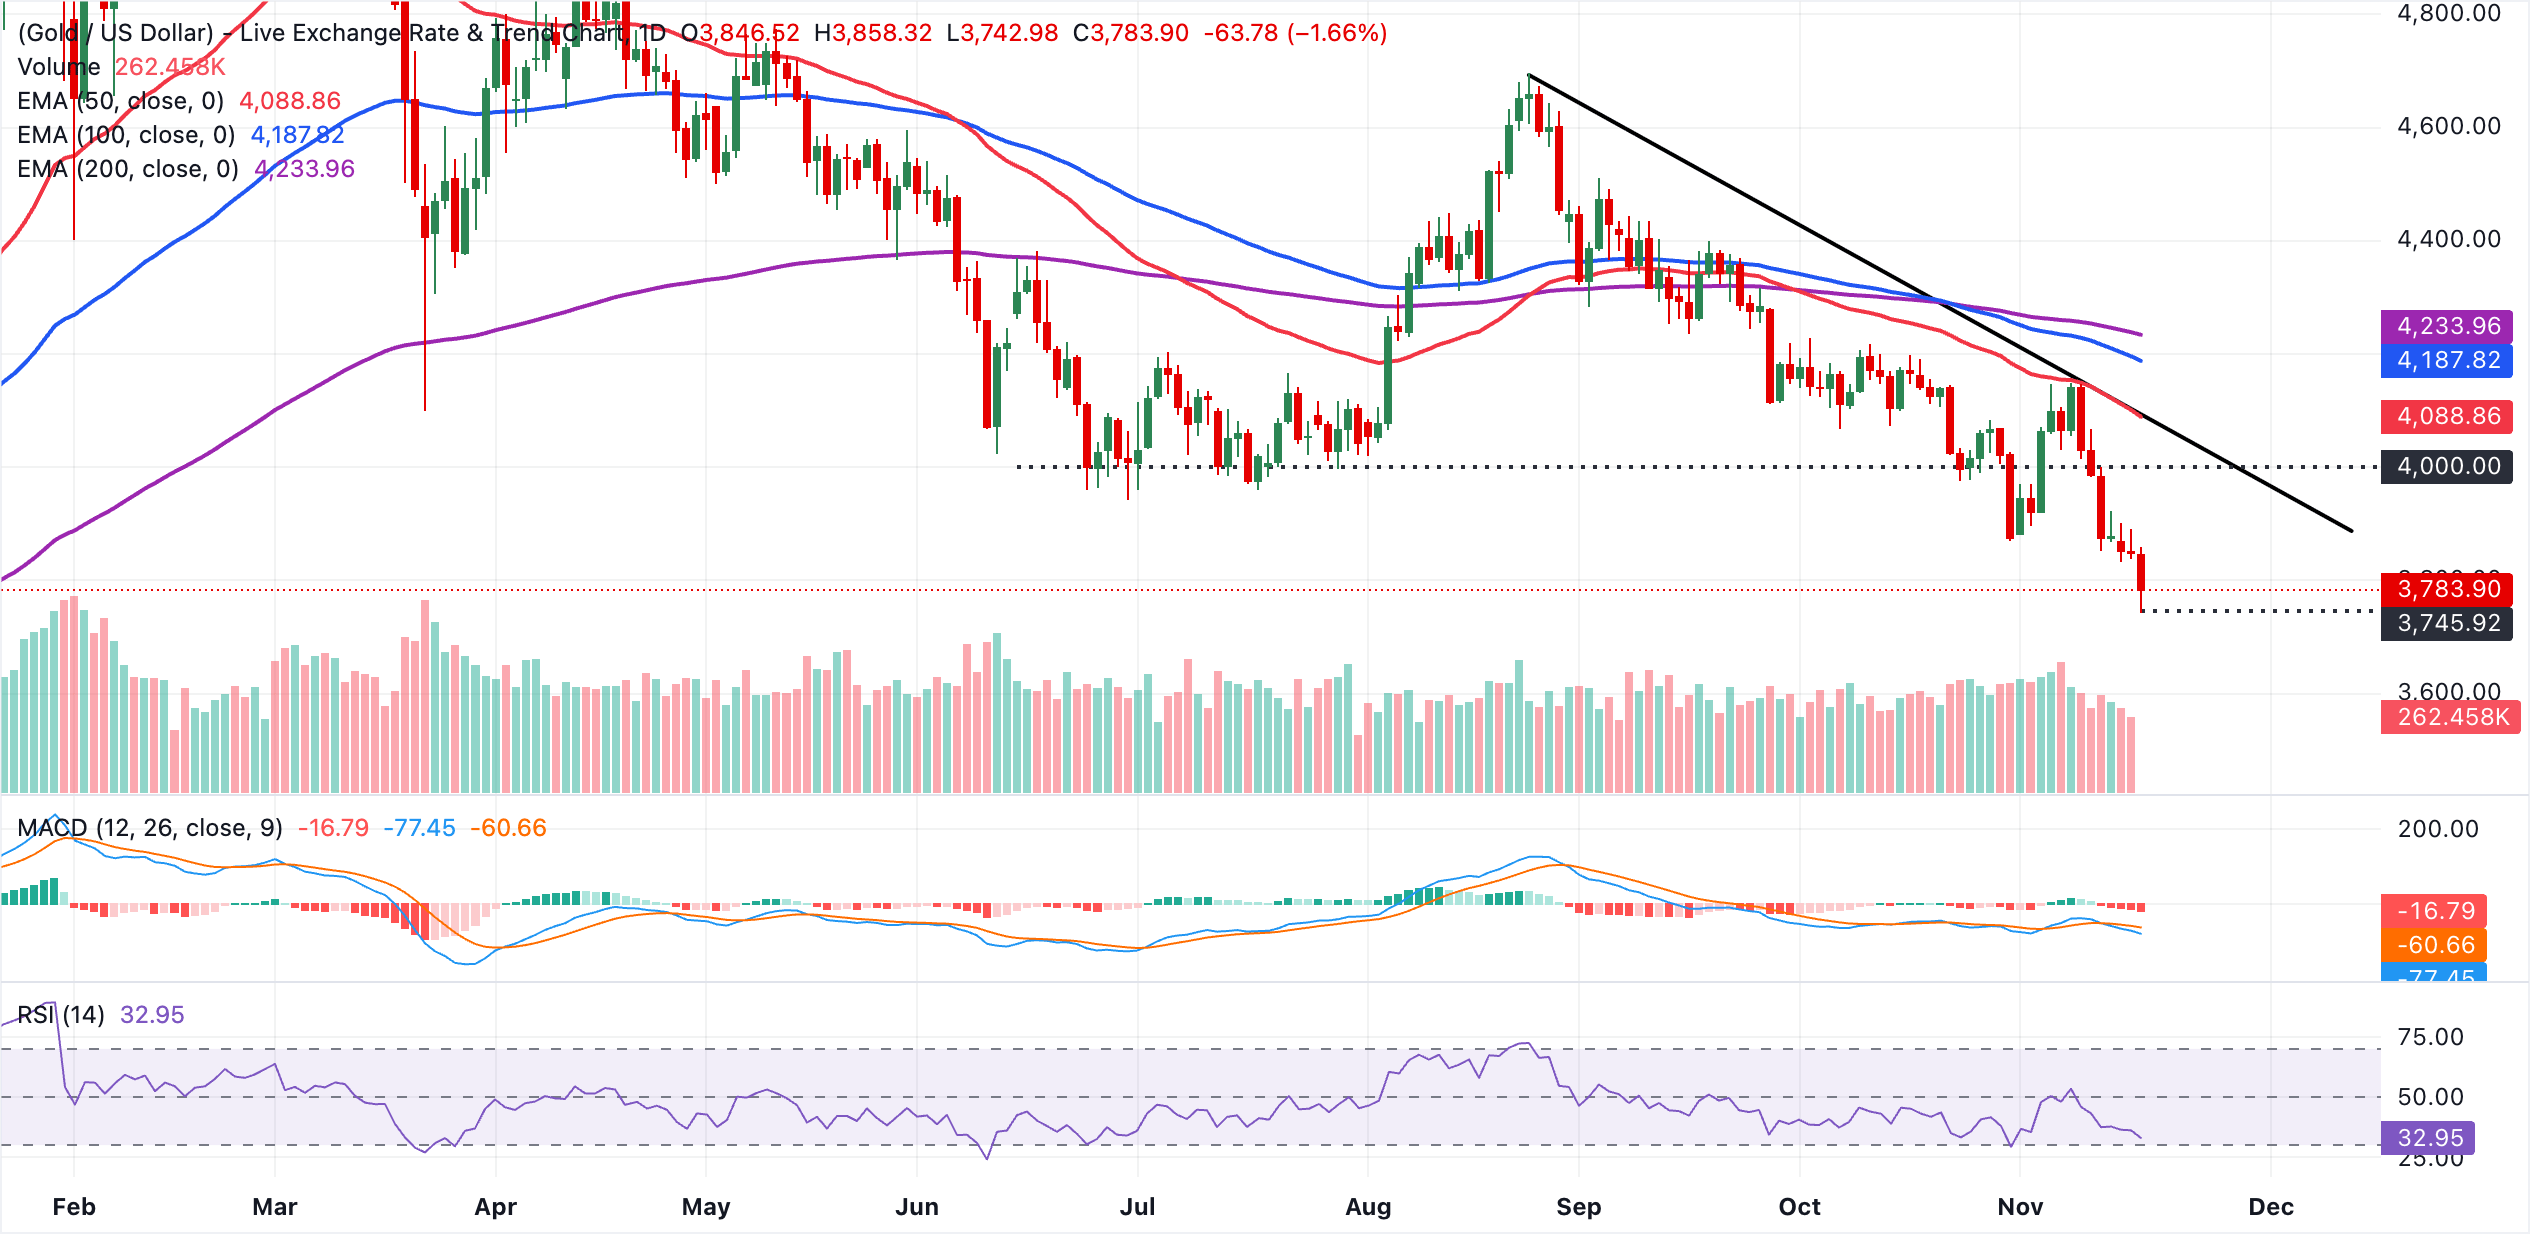
Initial resistance lies near the former descending trendline break region around $4,042, where any recovery could first struggle to gain traction. Above that, the 50-day EMA at $4,089 is the next important cap, followed by the 100-day EMA at $4,188 and the 200-day EMA at $4,234, which together define a broad supply zone likely to limit the upside unless decisively reclaimed.
With no clearly defined support levels from the provided indicators on the daily chart, traders may look to prior swing lows and intraday price action for potential basing signals, but the prevailing structure still favors further weakness while spot holds beneath the clustered daily EMAs.
(The technical analysis of this story was written with the help of an AI tool. Know more.)
Bitcoin, altcoins, stablecoins FAQs
Bitcoin is the largest cryptocurrency by market capitalization, a virtual currency designed to serve as money. This form of payment cannot be controlled by any one person, group, or entity, which eliminates the need for third-party participation during financial transactions.
Altcoins are any cryptocurrency apart from Bitcoin, but some also regard Ethereum as a non-altcoin because it is from these two cryptocurrencies that forking happens. If this is true, then Litecoin is the first altcoin, forked from the Bitcoin protocol and, therefore, an “improved” version of it.
Stablecoins are cryptocurrencies designed to have a stable price, with their value backed by a reserve of the asset it represents. To achieve this, the value of any one stablecoin is pegged to a commodity or financial instrument, such as the US Dollar (USD), with its supply regulated by an algorithm or demand. The main goal of stablecoins is to provide an on/off-ramp for investors willing to trade and invest in cryptocurrencies. Stablecoins also allow investors to store value since cryptocurrencies, in general, are subject to volatility.
Bitcoin dominance is the ratio of Bitcoin's market capitalization to the total market capitalization of all cryptocurrencies combined. It provides a clear picture of Bitcoin’s interest among investors. A high BTC dominance typically happens before and during a bull run, in which investors resort to investing in relatively stable and high market capitalization cryptocurrency like Bitcoin. A drop in BTC dominance usually means that investors are moving their capital and/or profits to altcoins in a quest for higher returns, which usually triggers an explosion of altcoin rallies.
Artigos Recomendados


