


Crypto Today: Bitcoin pressured below $65K, ETH tests $1,800 while XRP reclaims $1.00
- Bitcoin stalls below $65,000 as bears stay in control amid low risk appetite.
- Ethereum edges lower and tests the psychological support near $1,800, weighed down by weak technicals.
- XRP gains momentum as bulls reposition above the critical $1.00 level.
Cryptocurrency prices are sending mixed signals on Wednesday, with Bitcoin (BTC) hovering below $65,000 and Ethereum (ETH) seeking support near $1,800. Meanwhile, XRP ticks higher as bulls reclaim their position above the pivotal $1.00 level.
Crypto market sentiment deteriorates
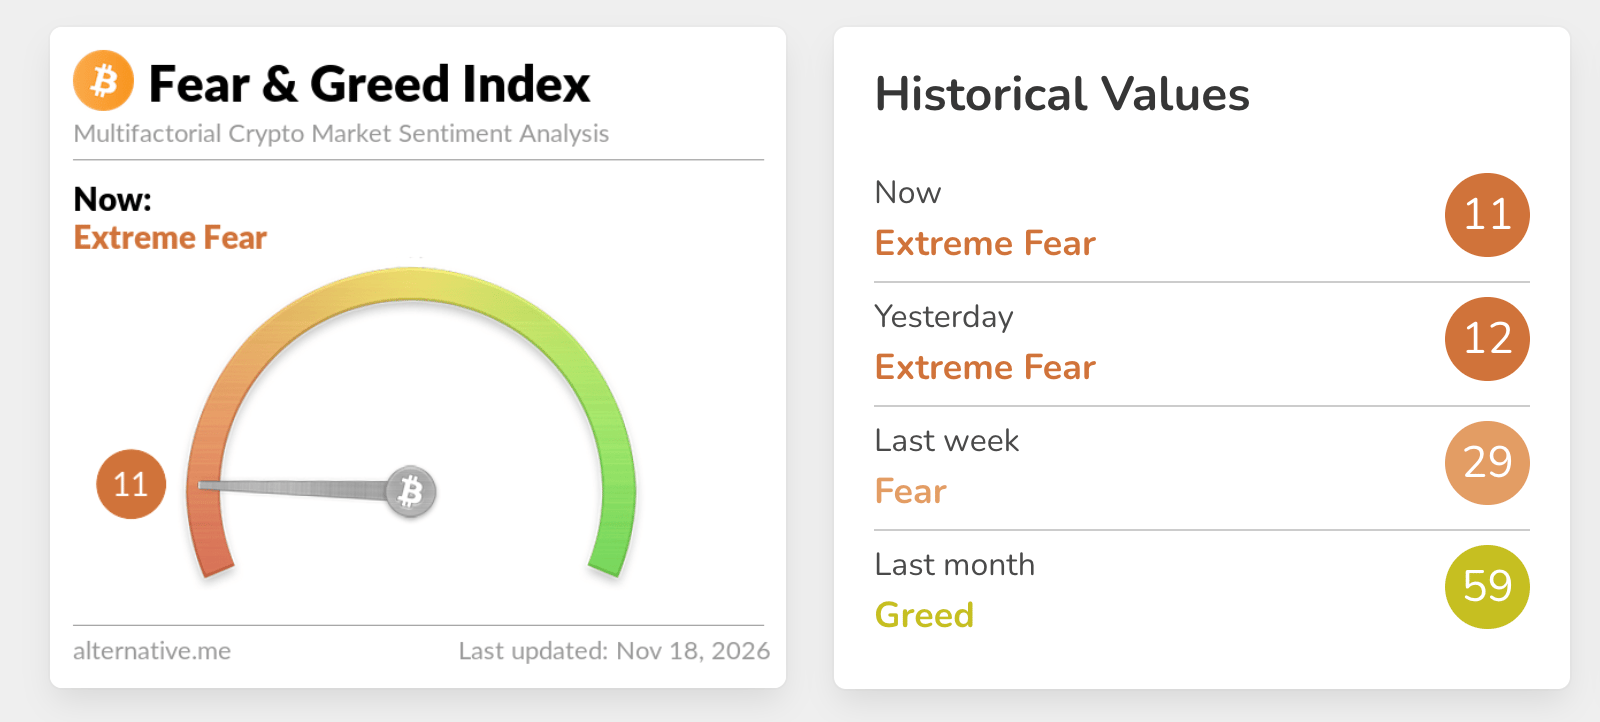
The Fear & Greed Index is down to 11 in the Extreme Fear territory, down only marginally from 12 the day in the same range the day before. This setup suggests appetite has significantly faded, weighing on demand for risk assets. If sustained, recovery could remain an uphill battle, raising the odds of an extended sell-off.
Market participants look forward to the release of the Federal Open Market Committee (FOMC) Minutes on Wednesday, which may offer clues into the Federal Reserve’s (Fed) monetary policy direction. Derivatives traders also widely anticipate the central bank will hike interest rates by 25 basis points to 4.00-4.25% in December.
The Fed remains committed to bringing US inflation down to the long-term 2% target despite sustained price pressures. However, tighter monetary policy rarely favors risk assets, as it tends to drive liquidity into stable assets, including US Treasuries.
“Demand is shrinking fast. Total demand growth is contracting at its fastest pace since July 1, led by spot buyers,” CryptoQuant said in a recent report.
Technical analysis: Bitcoin falters amid sticky resistance
Bitcoin trades at $64,718, well below the 50-day, 100-day, and 200-day Exponential Moving Averages (EMAs) clustered between roughly $75,781 and $76,012, keeping the broader tone decisively bearish despite the bounce from recent lows.
The Parabolic SAR at $67,142 also sits overhead, reinforcing a layer of nearby dynamic resistance, while the Relative Strength Index (RSI) around 24 shows oversold conditions that may slow, but not yet reverse, the prevailing downside pressure.
Initial resistance appears at the Parabolic SAR barrier near $67,142, ahead of a heavier supply zone defined by the 50-day EMA at $75,781, the 200-day EMA at $75,879, and the 100-day EMA at $76,012. The Moving Average Convergence Divergence (MACD) indicator remains in negative territory, suggesting that bearish momentum still dominates and that recovery attempts are likely to face selling interest into this overhead cluster.
"Traders are down 20% on average, and a large on-chain cluster at $62,000-$65,000 may act as support. Bottoms tend to form here, though the process usually takes at least two months," CryptoQuant added in the report.
Ethereum technical analysis: ETH consolidates amid broader bearish outlook
Ethereum trades at $1,812, extending a bearish near-term bias as price holds well below the 50-day, 100-day and 200-day Exponential Moving Averages (EMAs) clustered between roughly $2,225 and $2,280. The Parabolic SAR at 2,044 also sits above spot, reinforcing a capped structure despite the RSI slipping into oversold territory near 25, while the MACD remains negative with a weak histogram, suggesting downside pressure persists even as conditions look stretched.
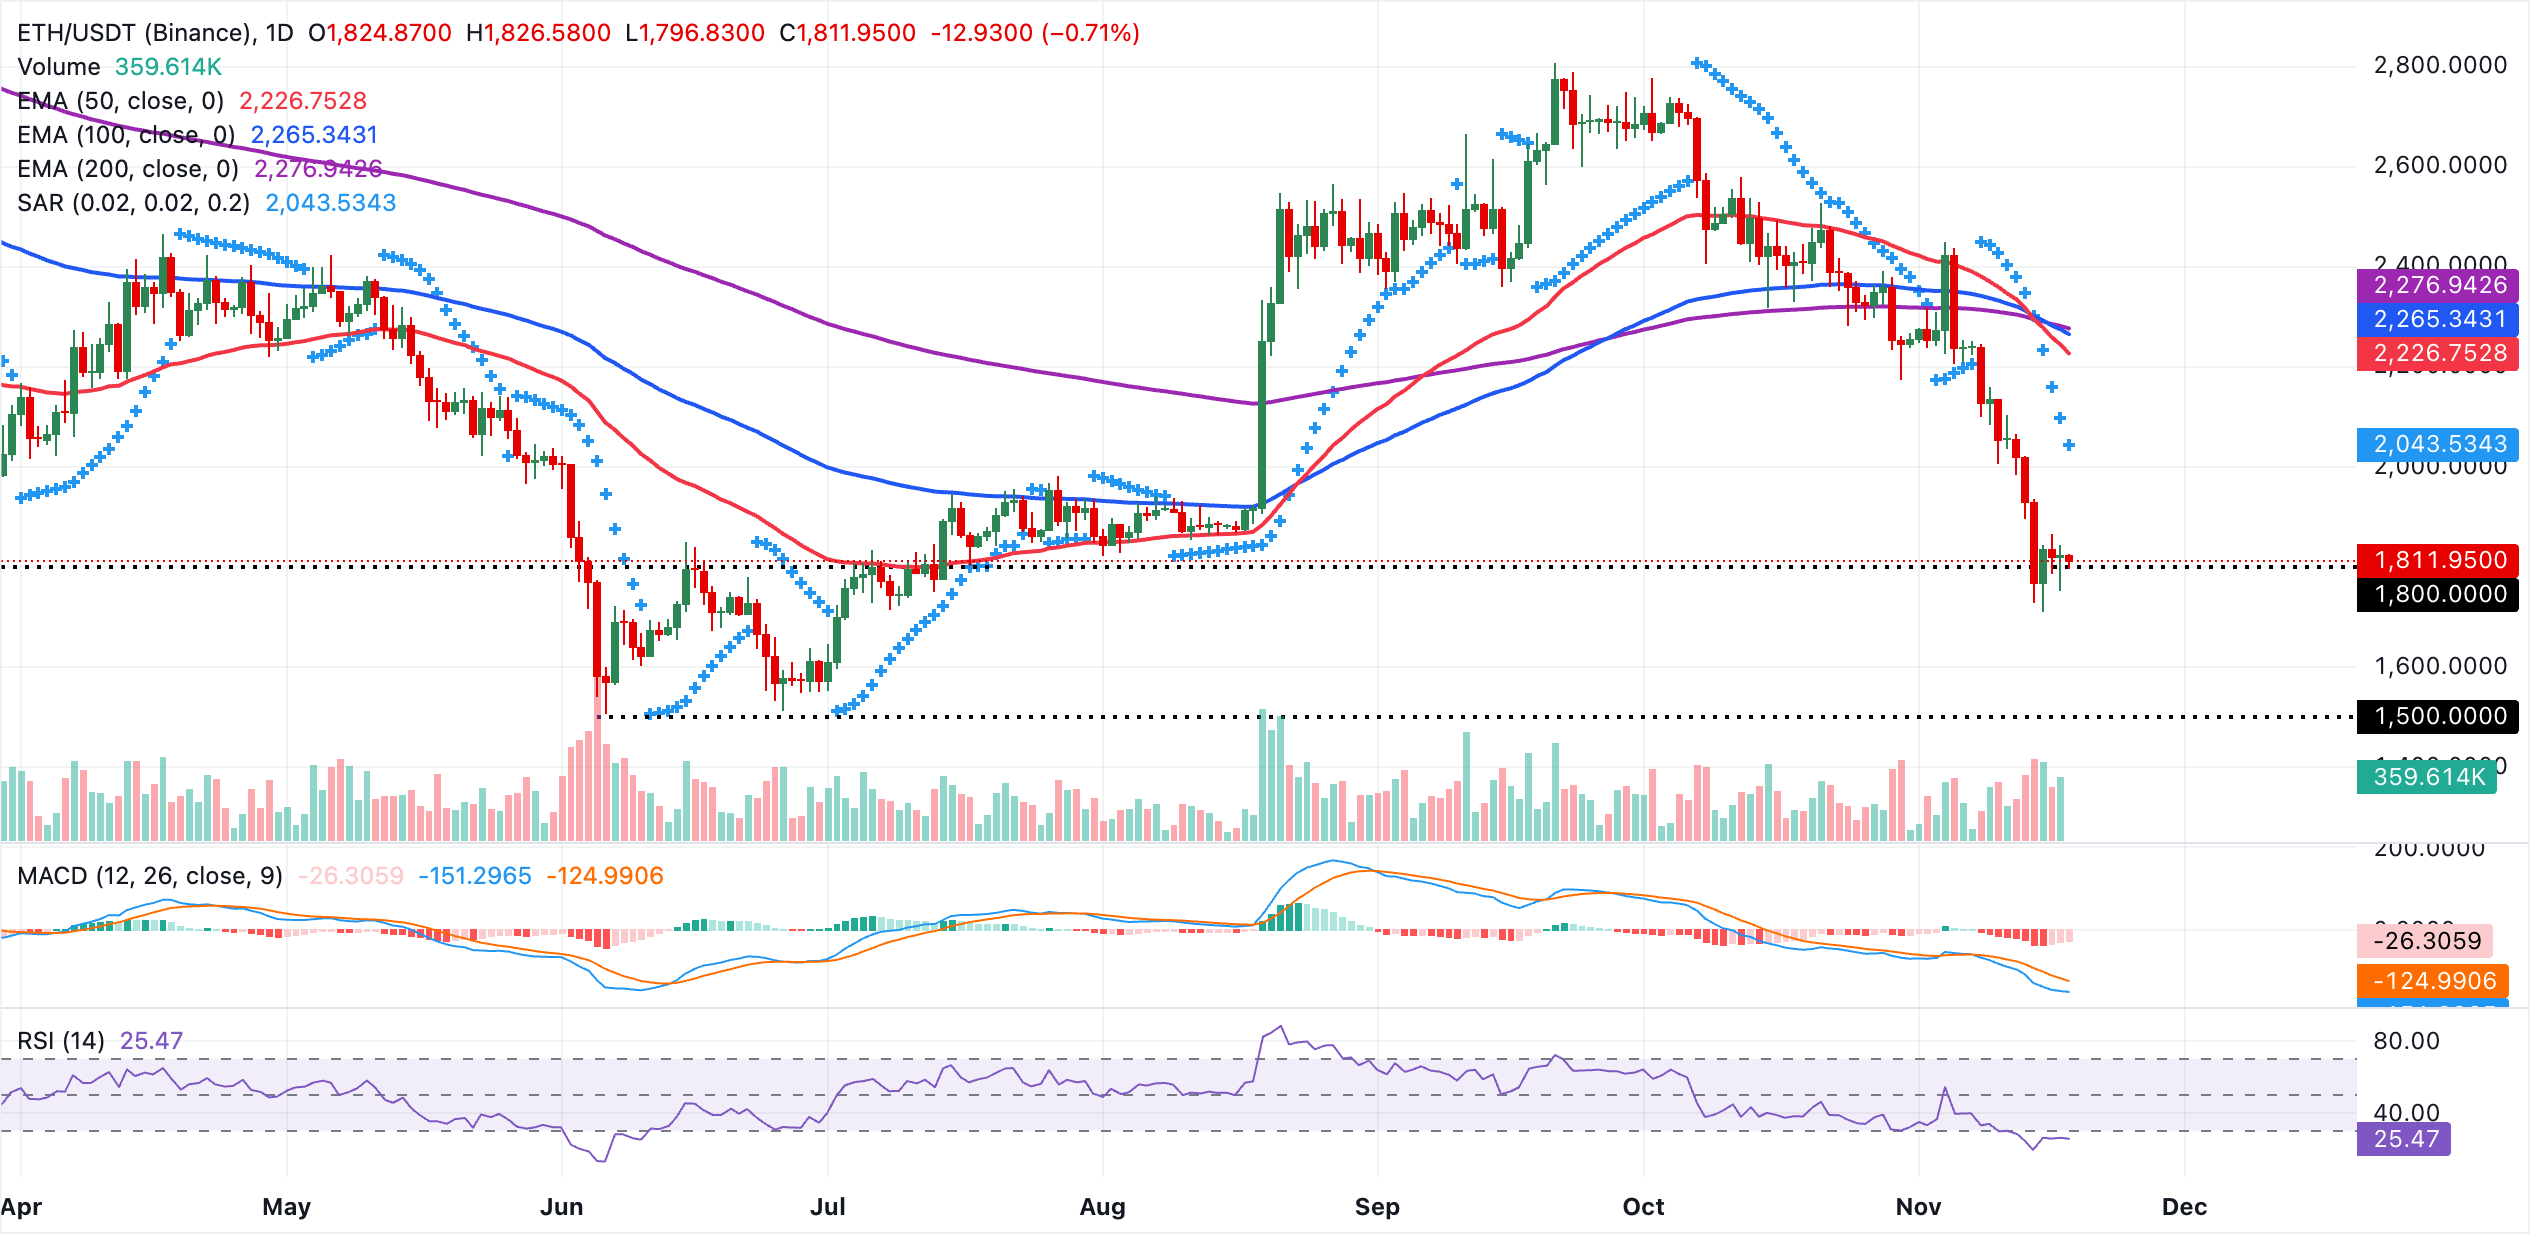
Initial resistance emerges at the Parabolic SAR level around $2,044, ahead of a more substantial supply zone created by the 50-day EMA at $2,227, followed by the 100-day EMA at $2,265 and the 200-day EMA at $2,277. As long as ETH remains below this EMA cluster, rallies are likely to be viewed as corrective, and only a sustained recovery through the $2,270 area would start to ease the current bearish structure on the daily chart.
Technical analysis: XRP bulls return as price ticks up
Ethereum trades at $1.00, extending a bearish near-term bias as price holds firmly below the 50-day, 100-day and 200-day EMAs. The MACD remains negative, while the RSI recovers modestly from oversold levels but stays below the neutral 50 mark, suggesting downside pressure persists despite a minor pause in the sell-off.
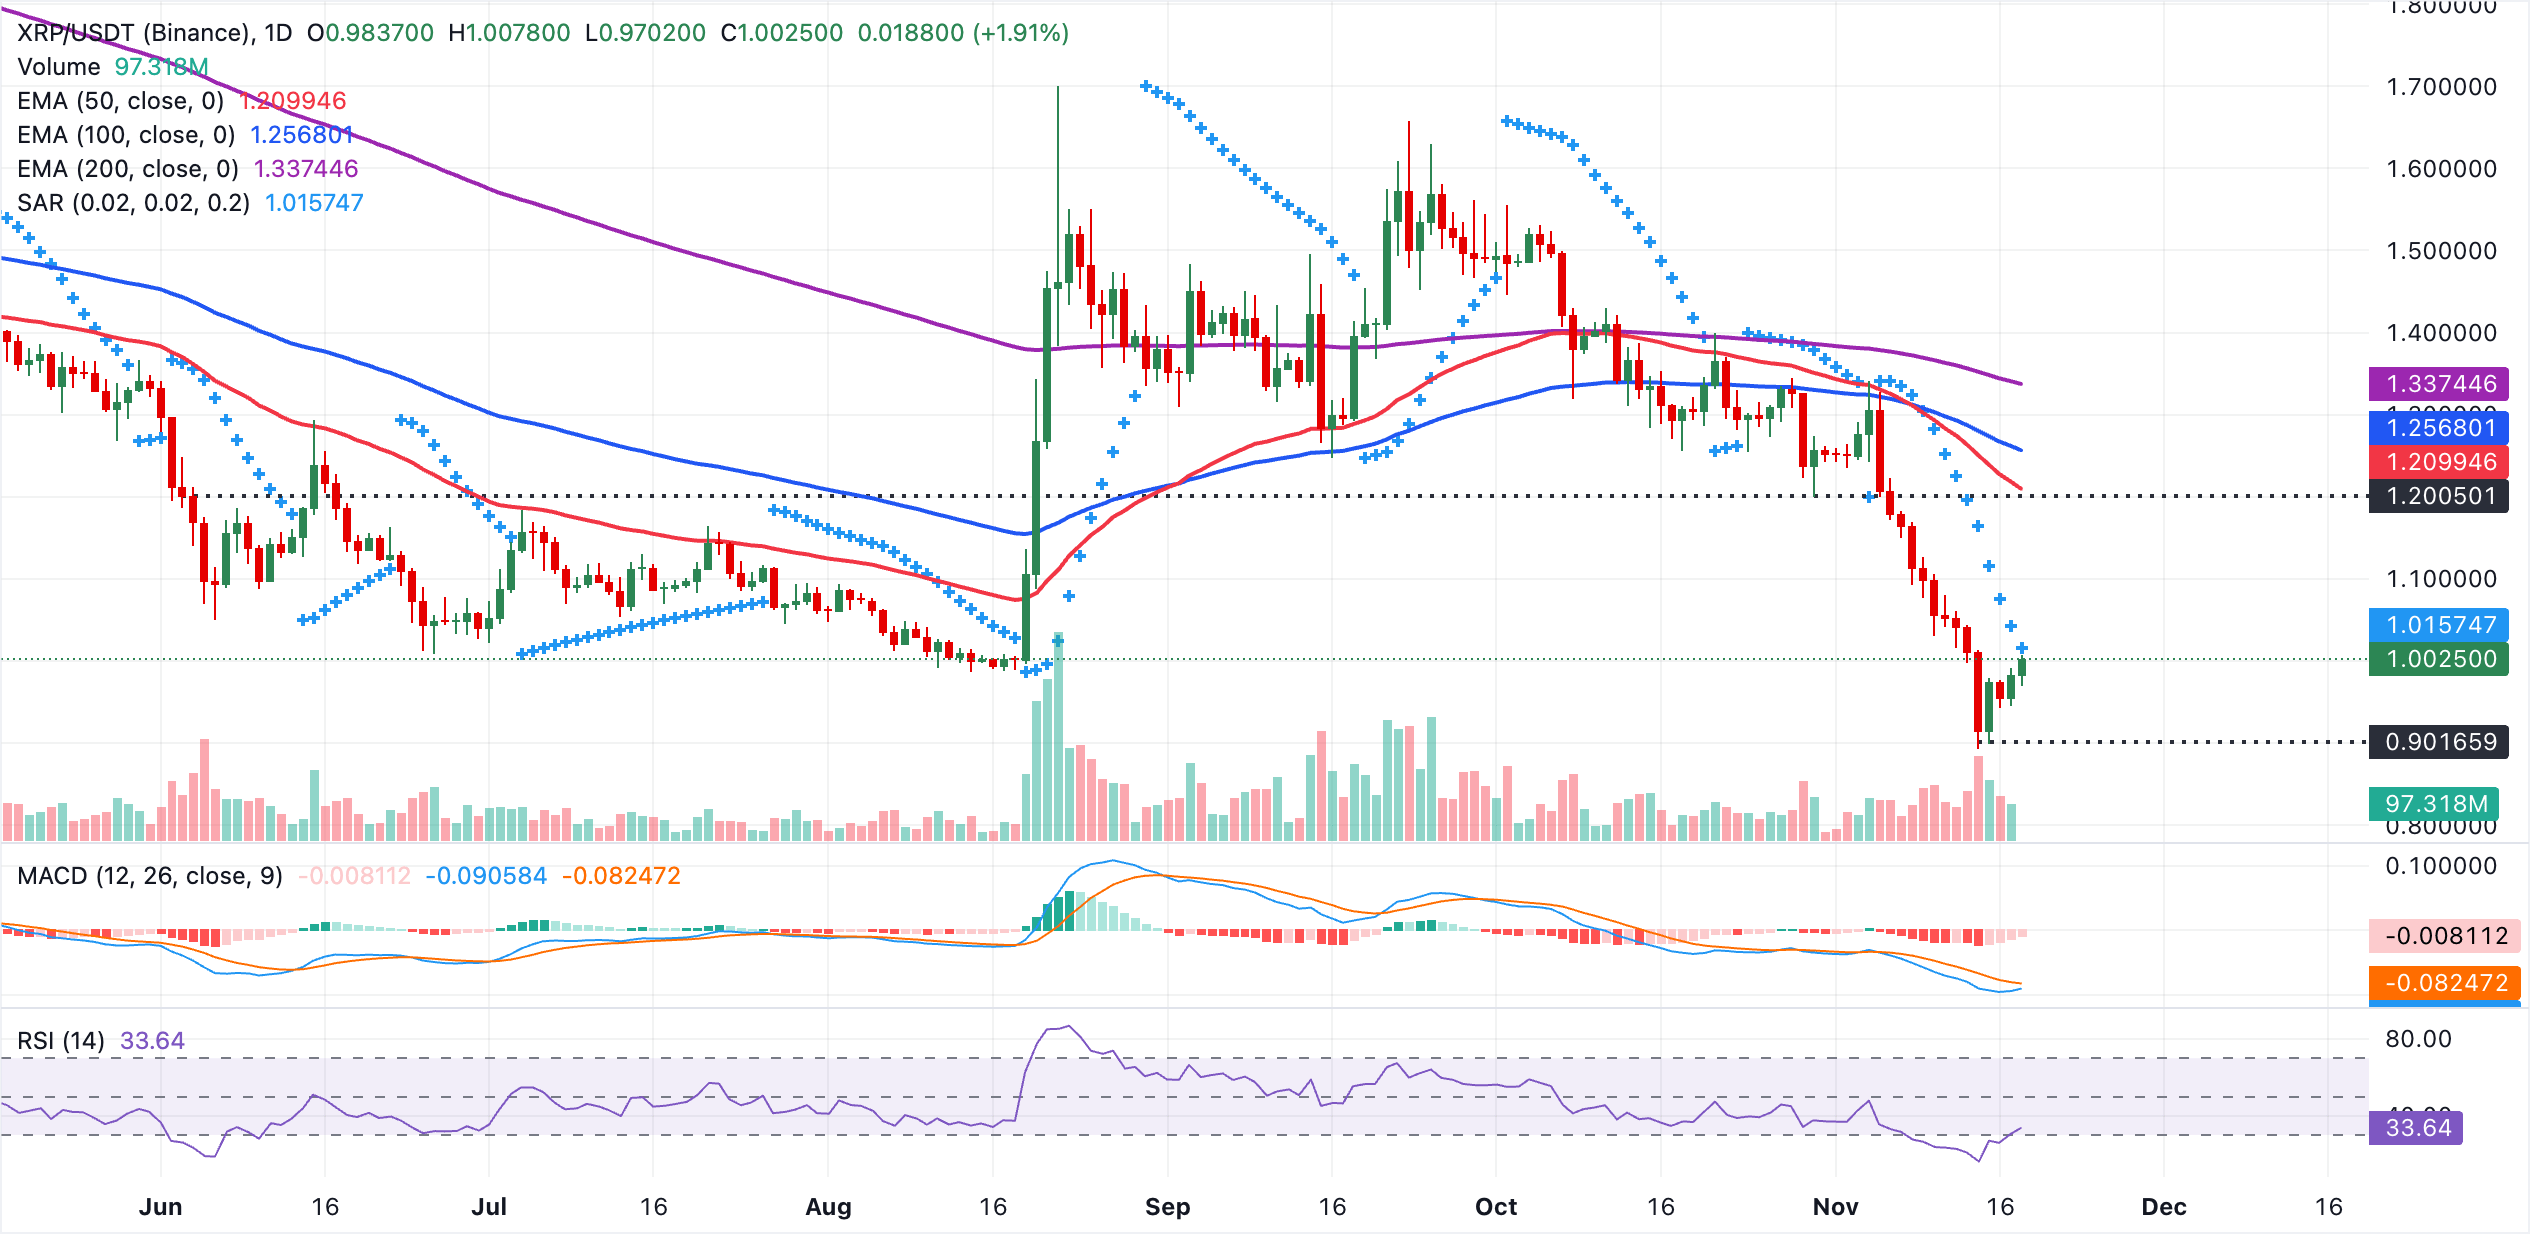
Initial resistance is defined by the Parabolic SAR at $1.02, with stronger cap levels emerging at the 50-day EMA near $1.21, followed by the 100-day EMA at $1.26 and the 200-day EMA at $1.34, which collectively frame a broad supply zone overhead.
The lack of clear support above the current price leaves XRP vulnerable to further losses unless buyers can reclaim and hold above the nearest resistance levels to ease the prevailing bearish tone.
(The technical analysis of this story was written with the help of an AI tool. Know more.)
Bitcoin, altcoins, stablecoins FAQs
Bitcoin is the largest cryptocurrency by market capitalization, a virtual currency designed to serve as money. This form of payment cannot be controlled by any one person, group, or entity, which eliminates the need for third-party participation during financial transactions.
Altcoins are any cryptocurrency apart from Bitcoin, but some also regard Ethereum as a non-altcoin because it is from these two cryptocurrencies that forking happens. If this is true, then Litecoin is the first altcoin, forked from the Bitcoin protocol and, therefore, an “improved” version of it.
Stablecoins are cryptocurrencies designed to have a stable price, with their value backed by a reserve of the asset it represents. To achieve this, the value of any one stablecoin is pegged to a commodity or financial instrument, such as the US Dollar (USD), with its supply regulated by an algorithm or demand. The main goal of stablecoins is to provide an on/off-ramp for investors willing to trade and invest in cryptocurrencies. Stablecoins also allow investors to store value since cryptocurrencies, in general, are subject to volatility.
Bitcoin dominance is the ratio of Bitcoin's market capitalization to the total market capitalization of all cryptocurrencies combined. It provides a clear picture of Bitcoin’s interest among investors. A high BTC dominance typically happens before and during a bull run, in which investors resort to investing in relatively stable and high market capitalization cryptocurrency like Bitcoin. A drop in BTC dominance usually means that investors are moving their capital and/or profits to altcoins in a quest for higher returns, which usually triggers an explosion of altcoin rallies.
Artigos Recomendados


