


XRP Price Forecast: XRP correction fades amid returning capital inflows and volume
- XRP is trading in the $1.13-$1.15 range after a minor correction below the 50-day EMA resistance.
- Renewed investor interest boosts trading volume to $2.40 billion while perpetual futures OI rises to 2.23 billion XRP.
- XRP shows signs of consolidation, with the MACD maintaining a buy signal and the RSI sliding while holding in bullish territory.
Ripple (XRP) retains a slightly bullish outlook on Wednesday despite logging a minor correction from the supply range near $1.15. The remittance token is down 0.5% on the day, reflecting a broader cryptocurrency market drawdown, primarily driven by persistent geopolitical tensions between the United States (US) and Iran in the Middle East.
“The absence of a near-term outlook for returning to diplomacy, let alone achieving a substantial and solid breakthrough regarding consensus on managing the Strait of Hormuz, keeps the risks of continued energy price inflation extremely high,” Simon-Peter Massabni, Head of Business Development at XS.com, said in a comment.
Crypto sentiment strengthens amid XRP capital inflows
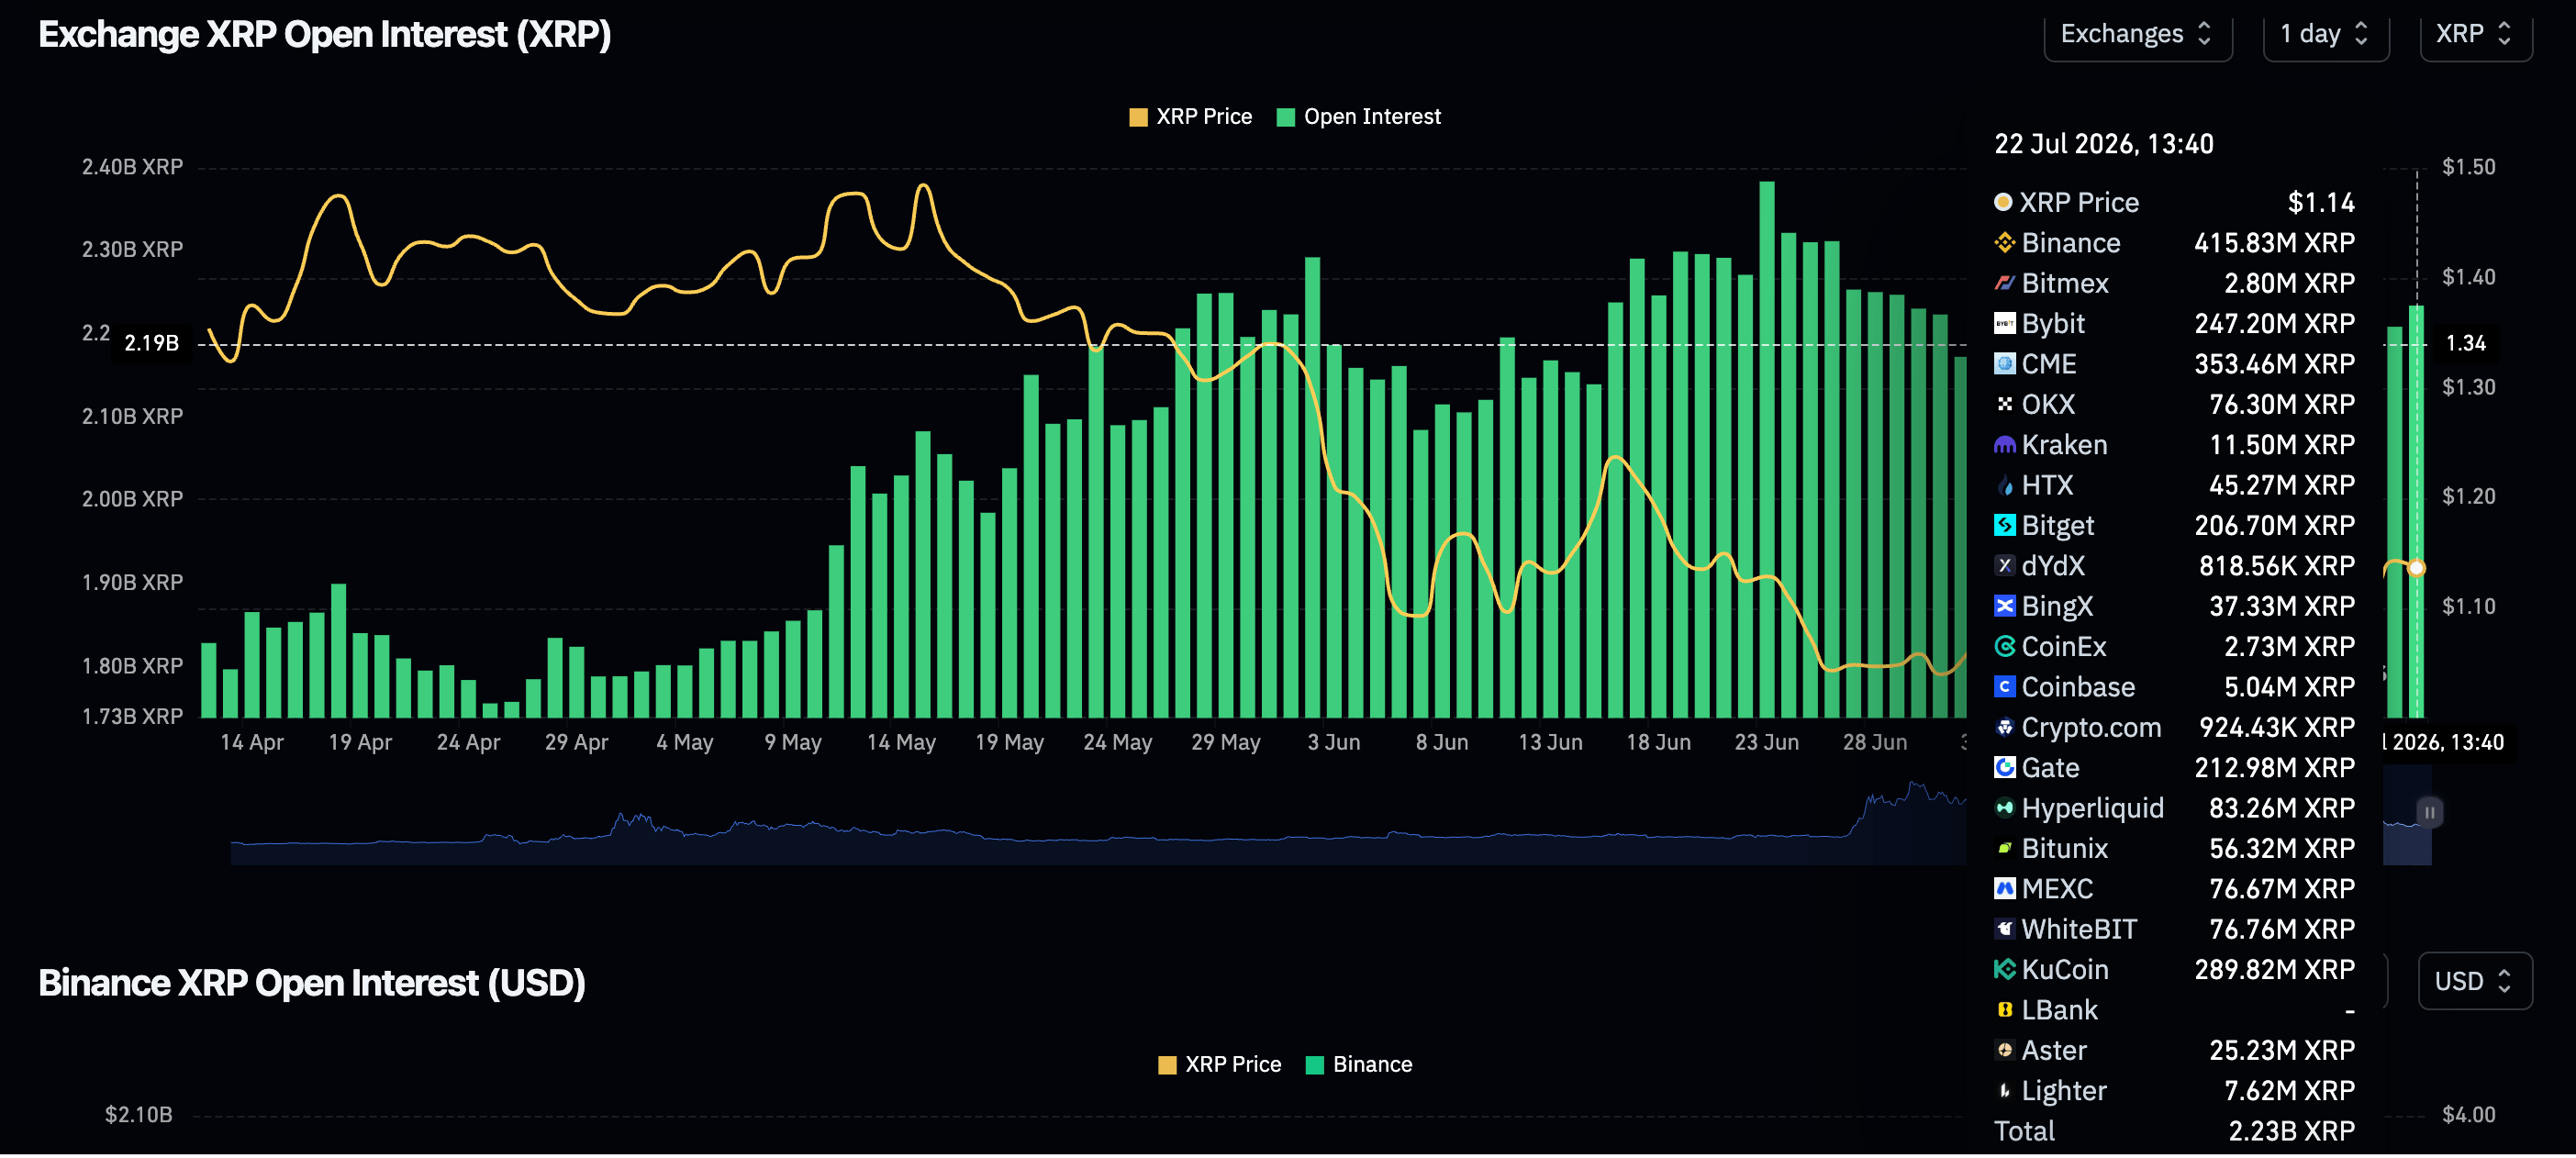
XRP derivatives are expanding, albeit gradually, with perpetual futures Open Interest (OI) averaging 2.23 billion XRP on Wednesday, up from 2.17 billion XRP the previous day. This increase in demand follows a recent drop from 2.37 billion XRP recorded on Monday, suggesting that despite profit-taking, appetite for XRP futures is relatively steady.
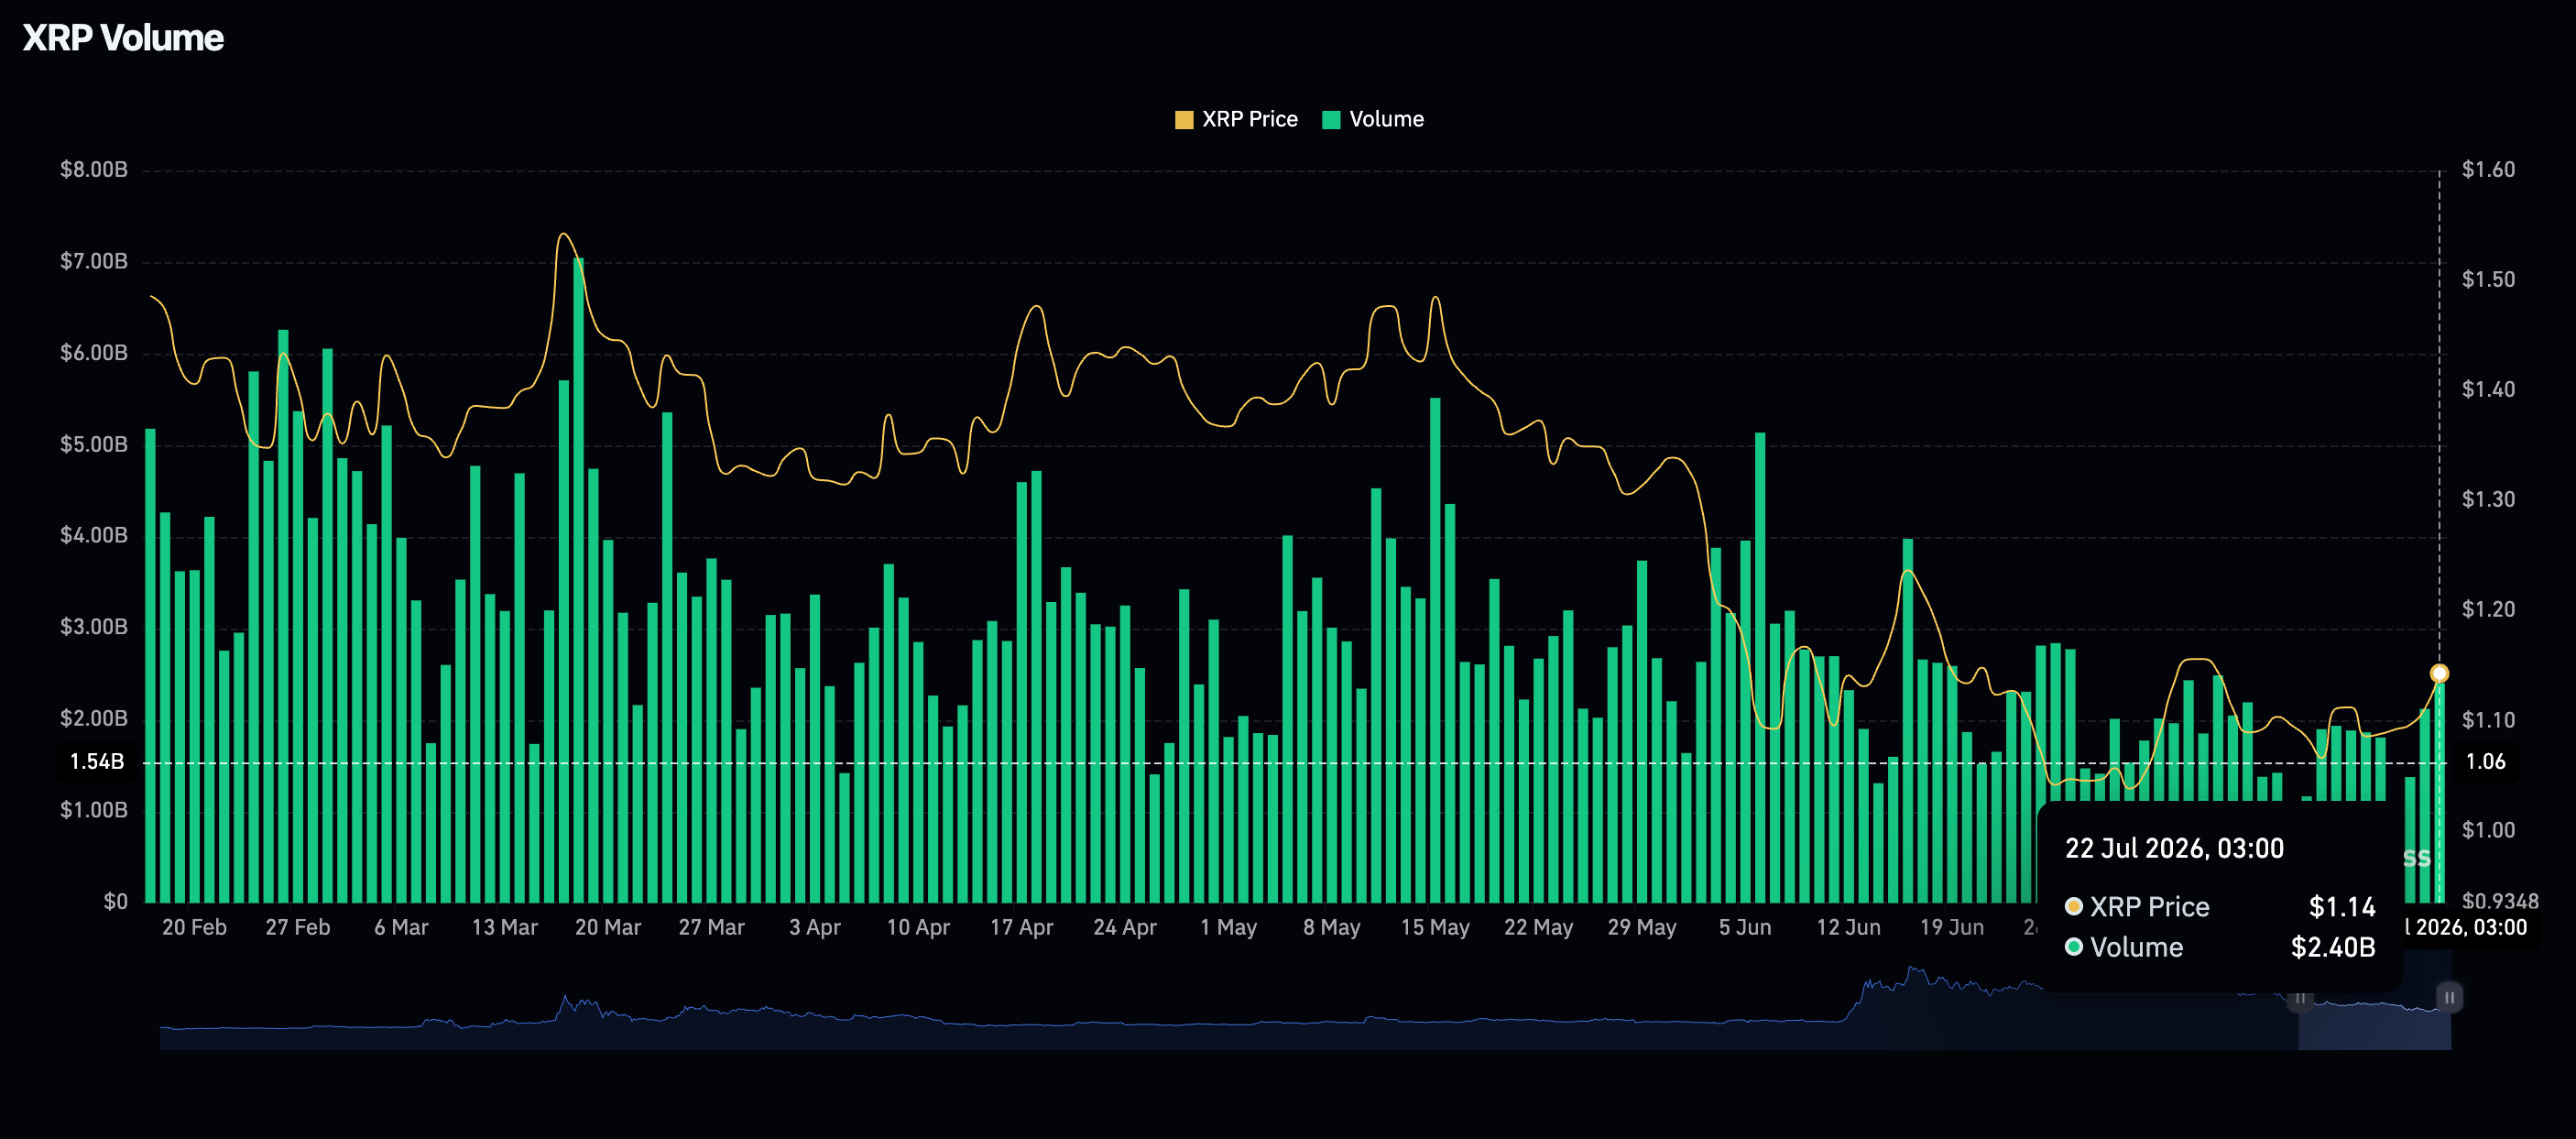
Meanwhile, the token continues to attract expanding trading volume, which held at $2.40 billion on Wednesday, up from $2.12 billion the day before. The alignment of increasing volume and perpetual futures OI supports XRP’s short-term bullish outlook.
Price analysis: XRP bulls absorb selling pressure
XRP trades at above $1.13, maintaining a bearish near-term bias as it remains capped beneath a dense layer of moving averages. The spot price is currently under the 50-day Exponential Moving Average (EMA) at $1.15, with the 100-day EMA at $1.24 and the 200-day EMA up at $1.46 reinforcing the broader downside structure.
The SuperTrend at $1.18 also sits overhead, suggesting rallies are likely to face selling pressure, even as the Relative Strength Index (RSI) near on the daily chart and the Moving Average Convergence Divergence (MACD) histogram show mildly constructive momentum that hints at a corrective rather than impulsive recovery.
-1784718495522.png)
Immediate resistance lies at the 50-day EMA around $1.15, followed by the SuperTrend barrier near $1.18, where any rebound could stall. Above that, the 100-day EMA at $1.24 and the 200-day EMA at $1.46 define progressively stronger supply zones that would need to be reclaimed to soften the bearish technical tone. On the downside, the main structural support level lies around the downward trendline break price at $1.05, where a pullback could attract dip-buying. A decisive move below this floor would expose further weakness in the broader trend.
(The technical analysis of this story was written with the help of an AI tool. Know more.)
Cryptocurrency metrics FAQs
The developer or creator of each cryptocurrency decides on the total number of tokens that can be minted or issued. Only a certain number of these assets can be minted by mining, staking or other mechanisms. This is defined by the algorithm of the underlying blockchain technology. On the other hand, circulating supply can also be decreased via actions such as burning tokens, or mistakenly sending assets to addresses of other incompatible blockchains.
Market capitalization is the result of multiplying the circulating supply of a certain asset by the asset’s current market value.
Trading volume refers to the total number of tokens for a specific asset that has been transacted or exchanged between buyers and sellers within set trading hours, for example, 24 hours. It is used to gauge market sentiment, this metric combines all volumes on centralized exchanges and decentralized exchanges. Increasing trading volume often denotes the demand for a certain asset as more people are buying and selling the cryptocurrency.
Funding rates are a concept designed to encourage traders to take positions and ensure perpetual contract prices match spot markets. It defines a mechanism by exchanges to ensure that future prices and index prices periodic payments regularly converge. When the funding rate is positive, the price of the perpetual contract is higher than the mark price. This means traders who are bullish and have opened long positions pay traders who are in short positions. On the other hand, a negative funding rate means perpetual prices are below the mark price, and hence traders with short positions pay traders who have opened long positions.
Artigos Recomendados


