

US Dollar in choppy mode ahead of PPI and Jobless Claims data
- The US Dollar trades broadly flat as investors assess where to take the Greenback next.
- Traders brace for the US PPI and weekly Jobless Claims data releases.
- The US Dollar Index holds above the 103.50 area after bouncing off a pivotal level.
The US Dollar Index (DXY), which tracks the performance of the US Dollar (USD) against six major currencies, trades broadly flat on Thursday, above 103.70 at the time of writing. Markets await comments from US diplomats visiting Russia to convene over a ceasefire deal, which already bears the green light from Ukraine. Russia has issued its demands and changes to the proposal before US negotiators arrive in the country.
On the economic front, a bulk load of data is set to be released today at 12:30 GMT. Besides the weekly US Initial Jobless Claims, the US Producer Price Index (PPI) data for February is set to be released as well. Markets anticipate another soft print in the producer’s inflation reading after the softer-than-expected US Consumer Price Index (CPI) released on Wednesday.
Daily digest market movers: Wednesday’s moves explained
- Markets are seeing US yields surge to a five-day high at 4.33% after hitting 4.15% earlier this week. The move is fueled by an outflow of position from US bonds and into US equities. Yields are inversely correlated with US bond prices, so if US bond prices drop, US yields surge, supporting a stronger US Dollar.
- At 12:30 GMT, weekly US Jobless Claims and US Producer Price Index (PPI) for February are due:
- Initial Jobless Claims for the week ending March 7 are expected to surge to 225,000, coming from 221,000. The Continuing Jobless Claims are set to surge as well to 1.900 million, up from the previous 1.897 million.
- The monthly headline Producer Price Index for February should increase by 0.3% from 0.4%. The monthly core PPI should grow steadily at 0.3%.
- The yearly headline PPI should fall towards 3.3%, from 3.5%. The yearly core PPI reading, excluding food and energy, is expected to soften a touch by 3.5% from 3.6%.
- Equities are seeing another upbeat day in Europe with the main indices up over 0.5% on the day. US futures are starting to turn positive towards the US opening bell.
- The CME Fedwatch Tool projects a 97.0% chance for no interest rate changes in the upcoming Fed meeting on March 19. The chances of a rate cut at the May 7 meeting stand at 28.1% and 76.9% at June’s meeting.
- The US 10-year yield trades around 4.33%, off its near five-month low of 4.10% printed on March 4 and at a five-day high.
US Dollar Index Technical Analysis: Does it make sense?
The US Dollar Index (DXY) is getting some support from rising US yields after a softer US CPI report for February was released on Wednesday, opening the door for the Federal Reserve (Fed) to cut interest rates further in 2025. It all does sound contradictory, but those are the mechanics of how markets work, bringing tension with the Fed possibly cutting rates later this year while US yields are heading higher. Once the impact of US President Donald Trump’s tariffs on US inflation is clear, the direction for the US Dollar Index will become clear as well.
Upside risk is a rejection at 104.00 that could result in more downturn. If bulls can avoid that, look for a large sprint higher towards the 105.00 round level, with the 200-day Simple Moving Average (SMA) at 105.02. Once broken through that zone, a string of pivotal levels, such as 105.53 and 105.89, will present as caps.
On the downside, the 103.00 round level could be considered a bearish target in case US yields roll off again, with even 101.90 not unthinkable if markets further capitulate on their long-term US Dollar holdings.
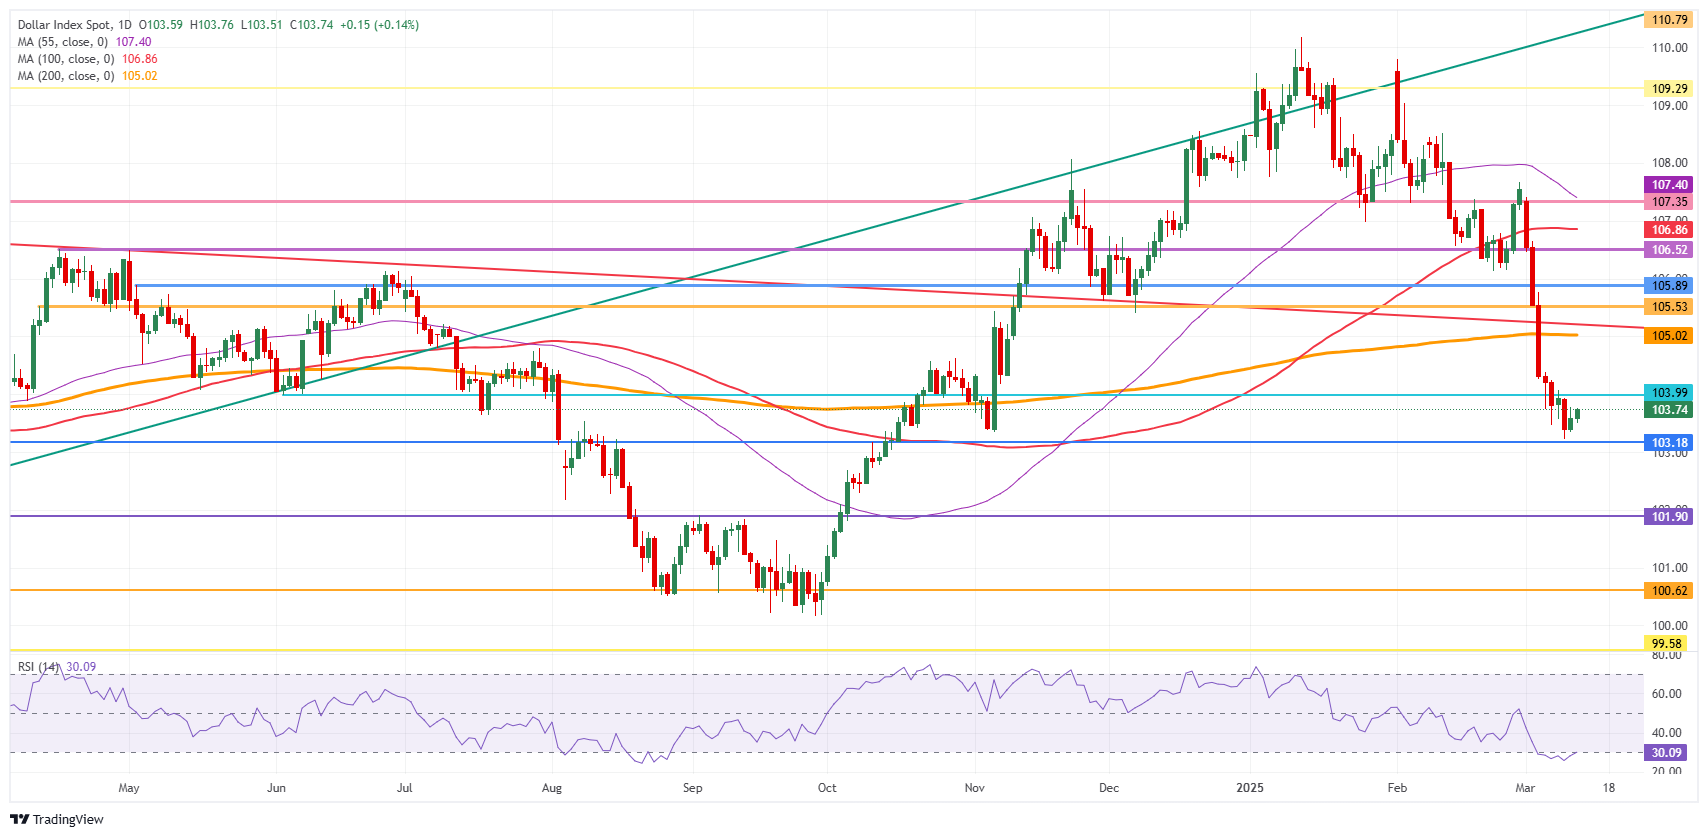
US Dollar Index: Daily Chart
US-China Trade War FAQs
Generally speaking, a trade war is an economic conflict between two or more countries due to extreme protectionism on one end. It implies the creation of trade barriers, such as tariffs, which result in counter-barriers, escalating import costs, and hence the cost of living.
An economic conflict between the United States (US) and China began early in 2018, when President Donald Trump set trade barriers on China, claiming unfair commercial practices and intellectual property theft from the Asian giant. China took retaliatory action, imposing tariffs on multiple US goods, such as automobiles and soybeans. Tensions escalated until the two countries signed the US-China Phase One trade deal in January 2020. The agreement required structural reforms and other changes to China’s economic and trade regime and pretended to restore stability and trust between the two nations. However, the Coronavirus pandemic took the focus out of the conflict. Yet, it is worth mentioning that President Joe Biden, who took office after Trump, kept tariffs in place and even added some additional levies.
The return of Donald Trump to the White House as the 47th US President has sparked a fresh wave of tensions between the two countries. During the 2024 election campaign, Trump pledged to impose 60% tariffs on China once he returned to office, which he did on January 20, 2025. With Trump back, the US-China trade war is meant to resume where it was left, with tit-for-tat policies affecting the global economic landscape amid disruptions in global supply chains, resulting in a reduction in spending, particularly investment, and directly feeding into the Consumer Price Index inflation.
Artigos Recomendados


