


Dow Jones Industrial Average breaks late after US PPI print
- The Dow Jones is still battling to reclaim the 41,000 level.
- US PPI inflation kept the door open for a Fed rate cut next week.
- US Initial Jobless Claims also ticked up, but not enough to deter a rate trim.
The Dow Jones Industrial Average (DJIA) stuck close to familiar midrange territory on Thursday, holding close to the 41,000 handle but struggling to decisely reclaim the key technical figure. US Producer Price Index (PPI) business-level inflation rose slightly faster than expected on a monthly basis, while the annualized figure held steady, alleviating fears of rate-cut-threatening inflation pressures.
US PPI rose to 0.2% MoM in August, with core PPI accelerating to 0.3% MoM. Headline PPI was forecast to rise to 0.1% from the previous 0.0%, while core PPI was expected to rise to 0.2% from July’s -0.2% contraction. Despite the near-term upswing, annualized PPI inflation figures were much more attractive to investors, with YoY headline PPI easing to 1.7% from the previous period’s revised 2.1%, and ticking below the expected 1.8%. Core annualized PPI also beat the expected print, holding steady at 2.4% YoY versus the expected 2.5% uptick.
US Initial Jobless Claims also rose slightly higher for the week ended September 6, increasing to the expected 230K from the previous week’s revised 228K.
With PPI inflation remaining tame and the number of unemployment benefits seekers holding firmly in tepid territory, little lies in the way of a first rate cut from the Federal Reserve (Fed) on September 18. The Fed is broadly expected to deliver a 25 bps cut to kick off 2024’s late-starting rate cut cycle. According to the CME’s FedWatch Tool, rate markets are pricing in over 80% odds of the Fed cutting by a quarter point next week, with a slim 20% still leaning into hopes for an initial double-cut for 50 bps. Rate traders also overwhelmingly expect the Fed to deliver four cuts in total, with December’s rate call expected to land between 425 and 450 bps.
Dow Jones news
The Dow Jones struggled at the start of Thursday’s market session, but a late break in the trading day has the index on the climb, with only a third of the DJIA testing into the red. Losses are being led by Dow Inc (DOW), which fell by 1.1% to below $50.20 per share. On the high side, Caterpillar Inc (CAT) rose nearly 1.5%, climbing back into $340 per share.
Elsewhere in equities, UnitedHealth Group Inc (UNH) took a hit following the Trump vs Harris political debate this week. Presidential candidate Donald Trump took a big hit to his election odds following a poor debate performance.
Dow Jones price forecast
The Dow Jones spent early Thursday in the doldrums, holding on the low end despite an overall uptick in US equity markets. The index waffled below 40,750 before catching a late break into the high side, returning to challenge the 41,000 key price level once more.
The major equity index has struggled to make headway above the major price handle, remaining trapped below 41,000 for the six previous trading days. However, bulls look set to take another run at the high side, rallying prices 2.6% bottom-to-top over the last two days as daily candlesticks chalk in a bullish bounce from the 50-day Exponential Moving Average (EMA) at 40,366.
Dow Jones daily chart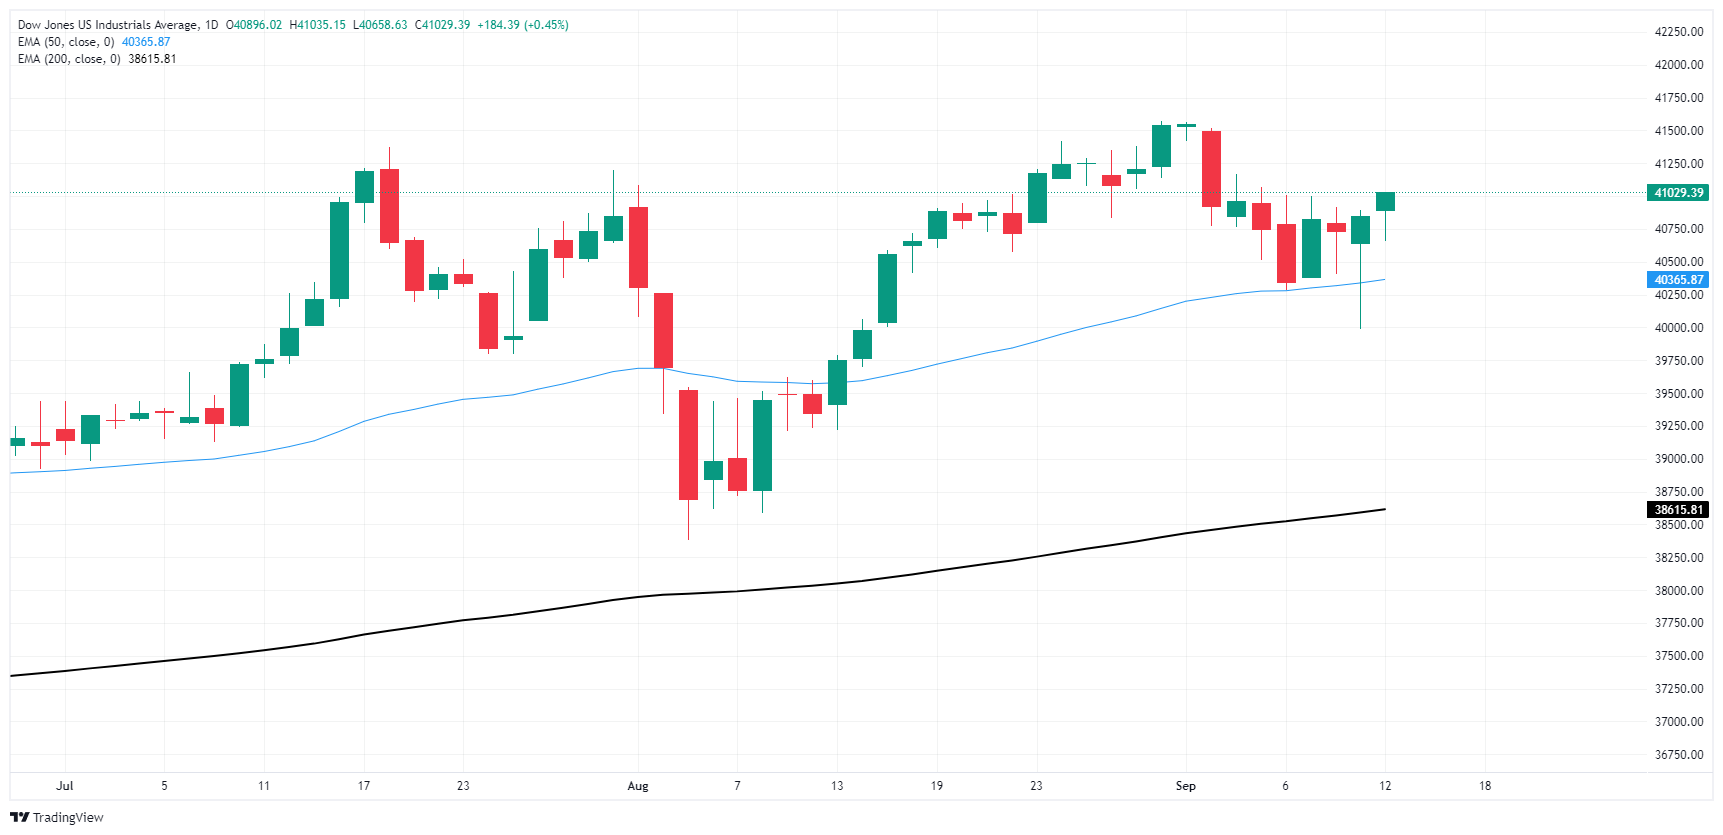
Dow Jones FAQs
The Dow Jones Industrial Average, one of the oldest stock market indices in the world, is compiled of the 30 most traded stocks in the US. The index is price-weighted rather than weighted by capitalization. It is calculated by summing the prices of the constituent stocks and dividing them by a factor, currently 0.152. The index was founded by Charles Dow, who also founded the Wall Street Journal. In later years it has been criticized for not being broadly representative enough because it only tracks 30 conglomerates, unlike broader indices such as the S&P 500.
Many different factors drive the Dow Jones Industrial Average (DJIA). The aggregate performance of the component companies revealed in quarterly company earnings reports is the main one. US and global macroeconomic data also contributes as it impacts on investor sentiment. The level of interest rates, set by the Federal Reserve (Fed), also influences the DJIA as it affects the cost of credit, on which many corporations are heavily reliant. Therefore, inflation can be a major driver as well as other metrics which impact the Fed decisions.
Dow Theory is a method for identifying the primary trend of the stock market developed by Charles Dow. A key step is to compare the direction of the Dow Jones Industrial Average (DJIA) and the Dow Jones Transportation Average (DJTA) and only follow trends where both are moving in the same direction. Volume is a confirmatory criteria. The theory uses elements of peak and trough analysis. Dow’s theory posits three trend phases: accumulation, when smart money starts buying or selling; public participation, when the wider public joins in; and distribution, when the smart money exits.
There are a number of ways to trade the DJIA. One is to use ETFs which allow investors to trade the DJIA as a single security, rather than having to buy shares in all 30 constituent companies. A leading example is the SPDR Dow Jones Industrial Average ETF (DIA). DJIA futures contracts enable traders to speculate on the future value of the index and Options provide the right, but not the obligation, to buy or sell the index at a predetermined price in the future. Mutual funds enable investors to buy a share of a diversified portfolio of DJIA stocks thus providing exposure to the overall index.
Artigos Recomendados


