

Bitcoin price's next move should manifest soon as MicroStrategy grows BTC portfolio to 193K tokens
- Bitcoin price remains range-bound with horizontal consolidation as halving countdown continues.
- As markets lean south, BTC could make a 3% drop to $50,000 before the next leg up.
- The bearish thesis will be invalidated if the price clears and closes above $52,985.
Bitcoin (BTC) price is trading without directional bias, a status that has prevailed since February 12. This is despite technical indicators having a defined lean. The reluctance to sell comes as the BTC community counts down days to the miner halving, while the hesitance to buy comes on the back of an uncertain market with analysts forecasting a healthy correction.
Also Read: Week Ahead: Bitcoin threatens a drop, altcoins in shambles
MicroStrategy grows BTC portfolio to 193K
Fifty-two days to the halving, business intelligence firm MicroStrategy has added 3,000 BTC tokens worth $155 million to its portfolio, according to an announcement by the company’s CEO Michael Saylor on social media platform X. The average purchase price per token in the latest investment is $51,813.
On-chain tool Lookonchain has corroborated the revelation, indicating that with MicroStrategy’s BTC portfolio growing to 193,000, the portfolio is now valued at $9.9 billion, with an average purchase price of $31,544. MicroStrategy already has over $3.8 billion in unrealized profit at the current price
As of February 21, MicroStrategy boasted a stark 190,000 BTC tokens in its portfolio, which brought its market capitalization to around $12 billion. With the latest move, the firm is even closer to the S&P 500 list than it was then with Nasdaq showing a market cap of $13.4 billion as of 16:00 GMT.
Find out the threshold for listing on the S&P 500, the list of America’s largest 500 publicly traded firms, here.
Notably, the development comes hours after MicroStrategy’s X account was hacked, leading to approximately $440,000 in losses from unsuspecting users. Specifically, it happened that the bad actors posted a phishing message on the firm’s X account, touting “$MSTR tokens” up for grabs.
On-chain detective ZachXBT confirmed the attack, where users following the malicious link to claim the “$MSTR token” were instead redirected to a fake MicroStrategy website. Here, they received a prompt to link their crypto wallets and grant permissions. MicroStrategy has since taken back control of their X account and has taken down the fake message. One of the victims lost approximately $420,000 in different tokens, Etherscan data shows.
Bitcoin price prognosis as MicroStrategy makes headlines
Bitcoin price is trading absent directional bias, trapped within the range of $52,996 and $49,237. BTC is already overbought with the Relative Strength Index (RSI) position above 70. The price is at high risk of a correction, likely dropping 3% to the $50,000 psychological level.
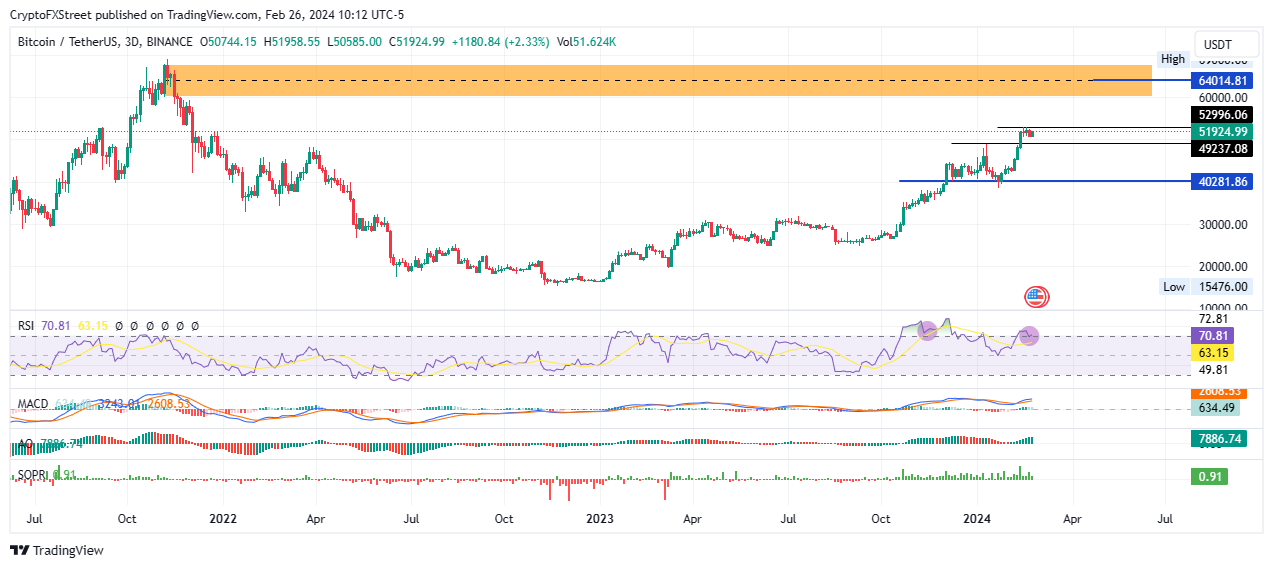
BTC/USDT 3-day chart
Conversely, based on other technicals, the upside potential is also strong with the Spent Output Profit Ratio (SOPR) indicating a correction may not be due just yet. This is because the SOPR remains below 1, at 0.91, as a 30-day moving average (MA).
For the layperson, this ratio suggests that BTC holders who are sitting on unrealized profits are not showing any intention to cash in on their gains so far.
Besides the SOPR, the Awesome Oscillator (AO) indicator and the Moving Average Convergence Divergence (MACD) still show a strong presence of bulls, which can be seen with thee red histogram bars.
Increased buying pressure could see Bitcoin price clear the range high at $52,985, opening the expanse for a continuation of the climb to $55,000. In a highly bullish case, the BTC rally extrapolates to $60,000. Such a move would constitute a 12% climb above current levels and could send BTC into the supply zone between $60,050 and $67,789.
This would give it a chance of retaking its $69,000 all-time high recorded in November 2021. The first sign would be a break and close above $64,014, the mean threshold of the range.
Open Interest, funding rate FAQs
How does Open Interest affect cryptocurrency prices?
Higher Open Interest is associated with higher liquidity and new capital inflow to the market. This is considered the equivalent of increase in efficiency and the ongoing trend continues. When Open Interest decreases, it is considered a sign of liquidation in the market, investors are leaving and the overall demand for an asset is on a decline, fueling a bearish sentiment among investors.
How does Funding rate affect cryptocurrency prices?
Funding fees bridge the difference between spot prices and prices of futures contracts of an asset by increasing liquidation risks faced by traders. A consistently high and positive funding rate implies there is a bullish sentiment among market participants and there is an expectation of a price hike. A consistently negative funding rate for an asset implies a bearish sentiment, indicating that traders expect the cryptocurrency’s price to fall and a bearish trend reversal is likely to occur.
Artigos Recomendados


