

Top 3 Price Prediction Bitcoin, Ethereum, Ripple: Crypto market cowers with sell signals after FOMC minutes
- Bitcoin price could make a 5% trip south to the $48,000 psychological level.
- Ethereum price likely to revisit $2,770, a 5% fall with a sell signal already in play.
- Ripple price eyes a 7% fall amid growing overhead pressure.
Bitcoin (BTC) price is flashing red, alongside most altcoins, coming after the Federal Open Market Committee (FOMC) minutes revealed that some members think that interest rates could have topped out. Per the report, others expressed concerns over the progress of inflation. Nevertheless, some policy makers say the economic outlook appeared firmer than the December projections.
Find detailed report here: Fed Minutes suggest rates are at their peak
Bitcoin price could revisit $48,000
Bitcoin (BTC) price is almost showing a directional bias, breaking below the $51,335 support. Judging from the technical indicators, if BTC records a candlestick close below the aforementioned buyer congestion level, the king of cryptocurrency could roll over to the $48,000 psychological level. In a dire case, BTC could retest the order block between $45,556 and $46,691.
The Relative Strength Index (RSI) has already registered a sell signal by crossing its signal line (yellow band), while the Moving Average Convergence Divergence (MACD) is dipping and could also cross below its signal line (orange band). Meanwhile, the MACD histogram bars are paling out.
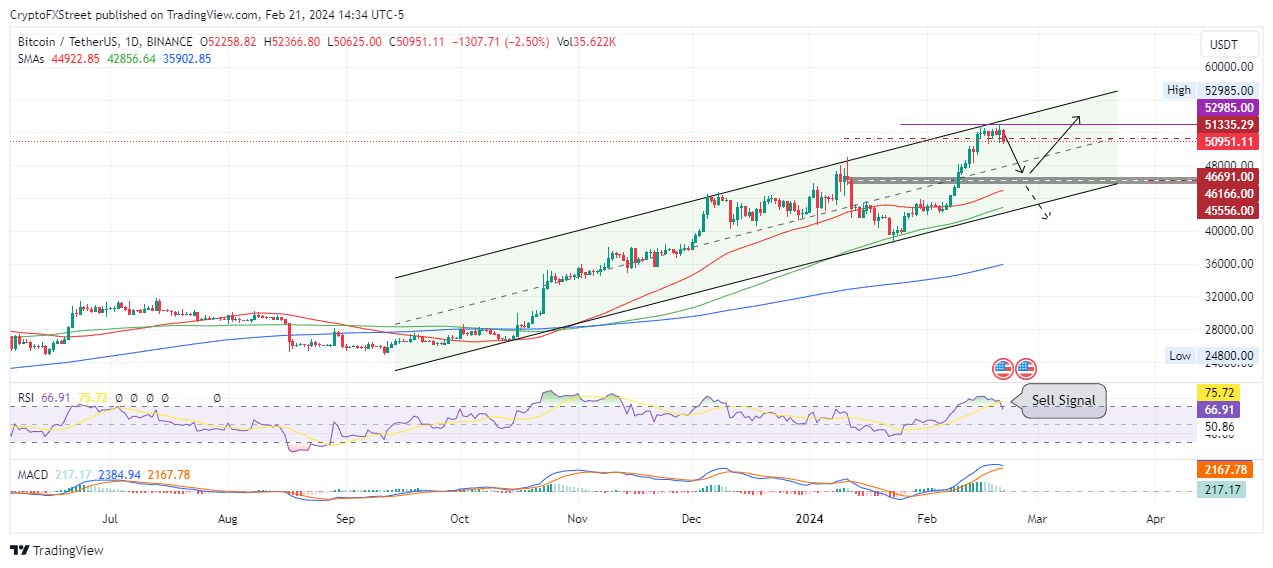
BTC/USDT 1-day chart
On the other hand, if the bulls show resolve, Bitcoin price could recover, flipping $52,985 into support as it extends towards $55,000 or in a highly bullish case, $60,000 psychological level. Such a move would constitute a 17% climb above current levels.
Also Read: Bitcoin price likely to fall but MicroStrategy’s $12 billion market cap makes it a possible S&P 500 candidate
Ethereum price could fall 5%
Ethereum (ETH) price, like BTC, is responding to a sell signal executed on the RSI. Traders heeding this call could see ETH drop 5% to the $2,770 support, coinciding with the midline of the ascending parallel channel. The paling MACD histogram bars accentuate this bearish thesis, solidified by the topped out MACD which is now deviating south.
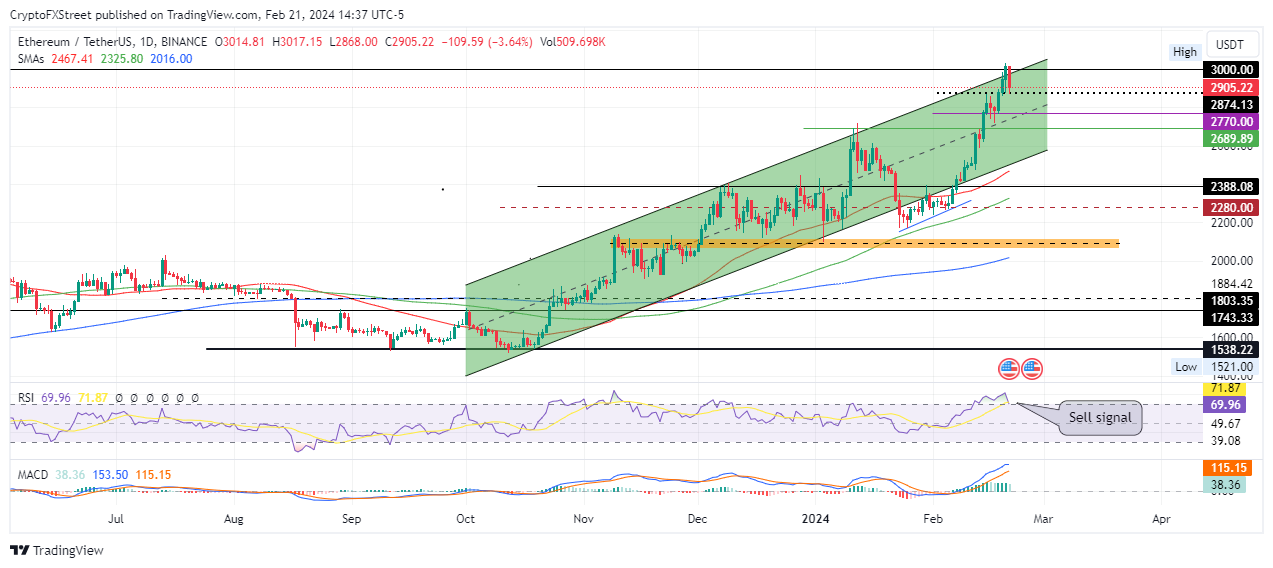
ETH/USDT 1-day chart
Conversely, a recovery among the bulls could send Ethereum price north, first clearing the range high of $3,033 before creating a local top above it.
Also Read: Ethereum price scrapes $3,000 psychological threshold after 20 months, inspiring conjecture on altseason
Ripple price subdued by growing overhead pressure
Ripple (XRP) price remains within the confines of the descending parallel channel, a status made worse by growing overhead pressure. Specifically, XRP price faces overhead pressure due to the 200 and 100-day Simple Moving Averages (SMA) at $0.5643 and $0.5835 levels respectively. These features, coupled with the sell signal that the RSI has just executed, tilt the odds in favor of the downside.
Accordingly, Ripple price could make a 7% drop to $0.5001, levels last tested on February 7. If this level fails to hold as support, XRP price could slip through to the $0.4734 support floor, around 13% below current levels.
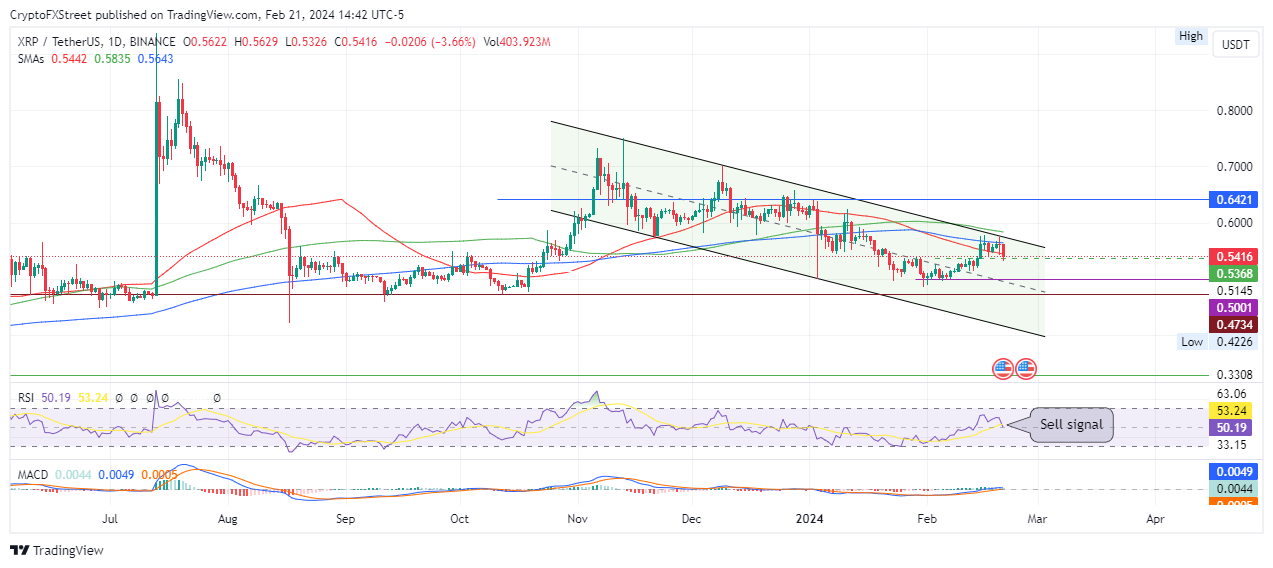
XRP/USDT 1-day chart
On the other hand, if the bulls come in, enhanced buying pressure could see Ripple price recover. A northbound move could see the payments token overcome the 200 and 100-day SMAs, bring the $0.6000 psychological level within reach.
In a highly bullish case, XRP price could leap further to test the $0.6421 blockade, nearly 20% above current levels.
Also Read: Ripple CEO criticizes SEC says regulator has lost lawsuits consistently; XRP price holds firm above $0.55
Cryptocurrency prices FAQs
How do new token launches or listings affect cryptocurrency prices?
Token launches like Arbitrum’s ARB airdrop and Optimism OP influence demand and adoption among market participants. Listings on crypto exchanges deepen the liquidity for an asset and add new participants to an asset’s network. This is typically bullish for a digital asset.
How do hacks affect cryptocurrency prices?
A hack is an event in which an attacker captures a large volume of the asset from a DeFi bridge or hot wallet of an exchange or any other crypto platform via exploits, bugs or other methods. The exploiter then transfers these tokens out of the exchange platforms to ultimately sell or swap the assets for other cryptocurrencies or stablecoins. Such events often involve an en masse panic triggering a sell-off in the affected assets.
How do macroeconomic releases and events affect cryptocurrency prices?
Macroeconomic events like the US Federal Reserve’s decision on interest rates influence risk assets like Bitcoin, mainly through the direct impact they have on the US Dollar. An increase in interest rate typically negatively influences Bitcoin and altcoin prices, and vice versa. If the US Dollar index declines, risk assets and associated leverage for trading gets cheaper, in turn driving crypto prices higher.
How do major crypto upgrades like halvings, hard forks affect cryptocurrency prices?
Halvings are typically considered bullish events as they slash the block reward in half for miners, constricting the supply of the asset. At consistent demand if the supply reduces, the asset’s price climbs. This has been observed in Bitcoin and Litecoin.
Artigos Recomendados


