Solana could rally as Breakpoint conference approaches

Fonte Fxstreet
  • Solana witnessed the highest single-day daily active address growth on its network.
  • SOL has historically rallied prior to the Solana Breakpoint conference.
  • SOL could rally toward $163 if it sustains an extended move above the $136 key resistance.

Solana (SOL) is up 0.5% on Tuesday, following significant growth in its network daily active addresses. Investors anticipate a potential rally as the Solana Breakpoint conference approaches.

SOL needs other key metrics to catch up to fuel pre-Breakpoint rise

With ten days to the Solana Breakpoint annual conference, the Solana network is experiencing heightened network activity. According to data from Artemis, Solana witnessed its highest single-day daily active address (DAA) growth on Tuesday after adding over 5.4 million new addresses.
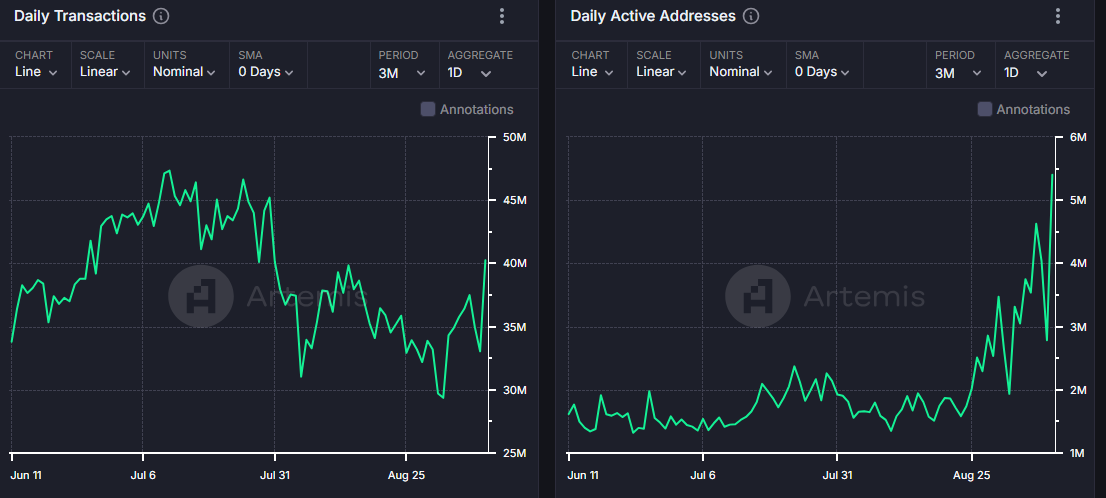
SOL Daily Active Addresses & Daily Transactions

SOL Daily Active Addresses & Daily Transactions

Solana's daily transactions are also rising, growing by 22% to 40.3 million between September 8 and 9. This steady growth could help Solana's network fees recover from the downward trend it has been on since August.

Network fees are currently at around $595K, levels last seen before the meme coin frenzy in March. A similar trend is visible in Solana's decentralized exchange (DEX) trading volume, which declined by over 27% in August.

If Solana network fees and DEX trading volume increase as the Breakpoint conference approaches, it could fuel a SOL rise in the coming weeks. The Solana Breakpoint conference will run from September 20 - 21, 2024.
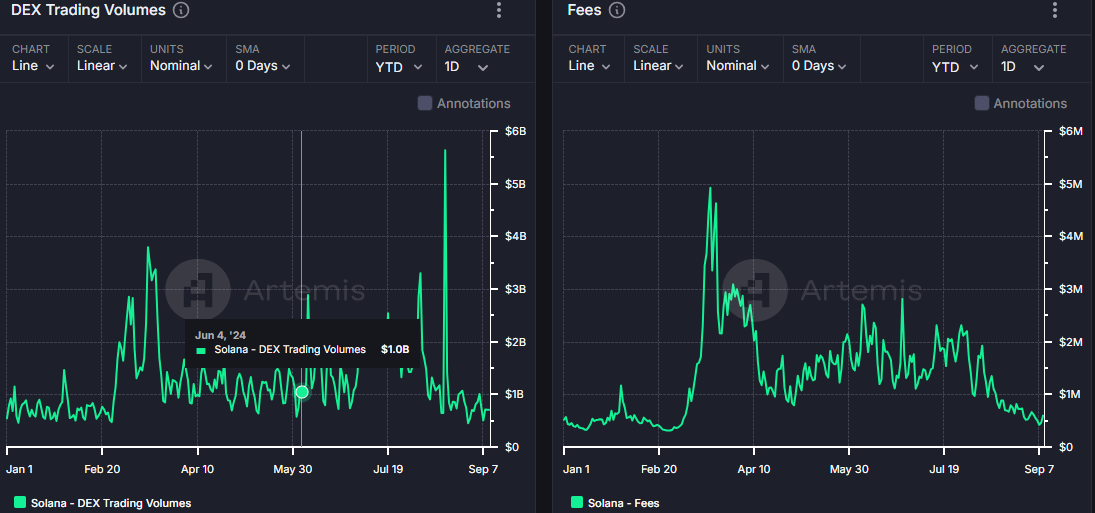
SOL DEX Trading Volume & Network Fees

SOL DEX Trading Volume & Network Fees

According to analyst @ali_charts, SOL has historically seen a price rise two weeks before the Solana Breakpoint conference. He noted that SOL surged by 35% in 2021 and 2022 and by 60% in 2023 prior to the conference. As a result, it's crucial for investors to watch out for a potential price rise in the coming days.

During such conferences, projects tend to do product reveals, which may lead to a bullish spark. Hence, it may also prove beneficial to pay close attention to tokens within the Solana ecosystem.

On the flip side, industry events are also often treated as sell-the-news events, leading to a potential price decline within key projects.

SOL could rally further above key resistance

On the 4-hour chart, SOL is attempting to sustain a move above a key rectangle's resistance around $136. A sustained move above this level could see SOL rally toward $163. However, failure to trade extensively above $136 could see SOL decline toward the $120 support level.
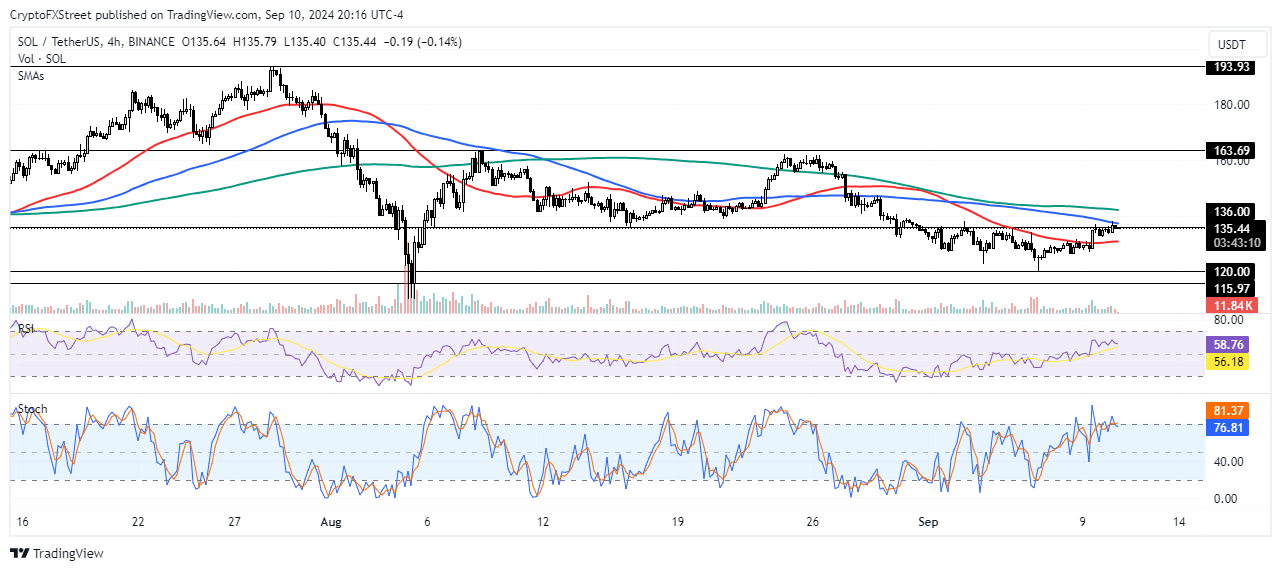
SOL/USDT 4-hour chart

SOL/USDT 4-hour chart

The 200-day Simple Moving Average (SMA) stands as resistance on the way up and could prevent a further rise in SOL. The Relative Strength Index (RSI) is above the midline at 60, indicating rising bullish momentum. The %K and %D lines of the Stochastic Oscillator (Stoch) have crossed into the oversold region, meaning a short-term correction may be imminent.

In the short term, SOL could fall to $132 to liquidate positions worth $16.02 million.

Isenção de responsabilidade: Apenas para fins informativos. O desempenho passado não é indicativo de resultados futuros.
placeholder
VBBR3 Viu VIBRA Hoje? Então Vale a Pena Comprar as Ações? Análise Técnica - GráficaNo vídeo VBBR3 Viu VIBRA Hoje? Então Vale a Pena Comprar as Ações? Análise Técnica - Gráfica compartilho meu melhor entendimento sobre análise técnica (análise gráfica) da ação da Vibra - antiga BR Distribuidora) - ação VBBR3. Incluo na análise preços-alvo para curto prazo e um breve estudo de ondas de Elliott.
Autor  Roberto Fernandes
10 Mês 09 Dia Qua
No vídeo VBBR3 Viu VIBRA Hoje? Então Vale a Pena Comprar as Ações? Análise Técnica - Gráfica compartilho meu melhor entendimento sobre análise técnica (análise gráfica) da ação da Vibra - antiga BR Distribuidora) - ação VBBR3. Incluo na análise preços-alvo para curto prazo e um breve estudo de ondas de Elliott.
placeholder
Cuidado com eventual fraqueza do dólar, recomenda UBS; entendaInvesting.com — O dólar ganhou força na semana passada, mas o UBS aconselha cautela para aqueles que esperam uma rápida reversão desse movimento, identificando apenas oportunidades seletivas no moment
Autor  Investing.com
Ontem 01: 51
Investing.com — O dólar ganhou força na semana passada, mas o UBS aconselha cautela para aqueles que esperam uma rápida reversão desse movimento, identificando apenas oportunidades seletivas no moment
placeholder
Principais ideias de investimento da Evercore em cada cenário eleitoral nos EUAInvesting.com — A Evercore ISI revisou sua visão sobre o mercado de ações dos EUA, à medida que se aproxima a eleição presidencial de novembro, após o presidente Joe Biden passar a liderança do Partid
Autor  Investing.com
Ontem 01: 55
Investing.com — A Evercore ISI revisou sua visão sobre o mercado de ações dos EUA, à medida que se aproxima a eleição presidencial de novembro, após o presidente Joe Biden passar a liderança do Partid
placeholder
O preço do ouro cai pelo sexto dia consecutivo, já que a ata do Fed sugere um corte de 25 bpsO ouro ampliou suas perdas pelo sexto dia consecutivo depois que o Federal Reserve (Fed) divulgou a ata de sua reunião de setembro.
Autor  FXStreet
Ontem 02: 06
O ouro ampliou suas perdas pelo sexto dia consecutivo depois que o Federal Reserve (Fed) divulgou a ata de sua reunião de setembro.
placeholder
Preço do ouro sobe antes do relatório do IPC dos EUA, mas ainda não está fora de perigoO preço do ouro (XAU/USD) subiu durante a sessão asiática de quinta-feira e, por enquanto, parece ter interrompido uma sequência de seis dias de perdas, atingindo uma baixa de quase três semanas testada novamente no dia anterior.
Autor  FXStreet
20 hora atrás
O preço do ouro (XAU/USD) subiu durante a sessão asiática de quinta-feira e, por enquanto, parece ter interrompido uma sequência de seis dias de perdas, atingindo uma baixa de quase três semanas testada novamente no dia anterior.
Produtos relacionados
goTop
quote