


Crypto Today: Bitcoin, Ethereum, XRP extend advance as US Dollar slides on Democrats' US midterm victory
- Bitcoin recovers above $78,000 as Democrats’ lead in US midterms pushes the US Dollar to a five-week low.
- Ethereum ticks up, with traders marginally above the 200-day EMA on Wednesday as broader risk-on sentiment returns.
- XRP trades above $1.28 as bulls eye a short-term move beyond $1.30.
Bitcoin (BTC) trades above $78,000 on Wednesday as risk-on sentiment improves in the broader cryptocurrency market. Ethereum (ETH) mirrors BTC’s recovery outlook, hovering above $2,300. Ripple (XRP) similarly exchanges hands above $1.28, marking two consecutive days of gains.
US midterm elections boost crypto recovery
The broader recovery comes amid United States (US) midterm elections, with Democrats clinching victory after victory and moving toward control of the House. According to an NBC News report, the party has significantly outperformed its 2024 margins, poking hard into Republican turf.
The midterm results are weighing on the US Dollar Index (DXY), down 0.45% on the day and trading at 101.41. This decline aligns with a six-month low, suggesting that markets are concerned by the midterm election results.
The US CLARITY Act, sponsored by Republican lawmakers, failed to pass the Senate. With a Democratic majority in the House, the odds of the bill becoming law could drop significantly.
“Today, the US midterm elections could trigger substantial volatility, with prediction markets assigning a 71% probability to Democrats winning both chambers,” K33 Research analysts said in Tuesday’s ‘Ahead of the Curve’ report, adding, “This combination of thin liquidity and elevated leverage increases the risk of sharp price swings once market activity picks up following the election.”
Technical analysis: Bitcoin builds recovery momentum
Bitcoin trades at $78,448, maintaining a bullish near-term bias as it holds above the 100-day and 200-day Exponential Moving Averages (EMAs) at $77,806 and $76,558, along with rising trendline support from $71,126 to $75,650. However, the pair is capped below the 50-day EMA at $80,067 and the SuperTrend line at $82,920, hinting at a consolidative phase within an ongoing uptrend.
Momentum remains cautious, with the Relative Strength Index (RSI) near 43 and the Moving Average Convergence Divergence (MACD) in negative territory, suggesting upside progress could be gradual while the broader structure stays supported.
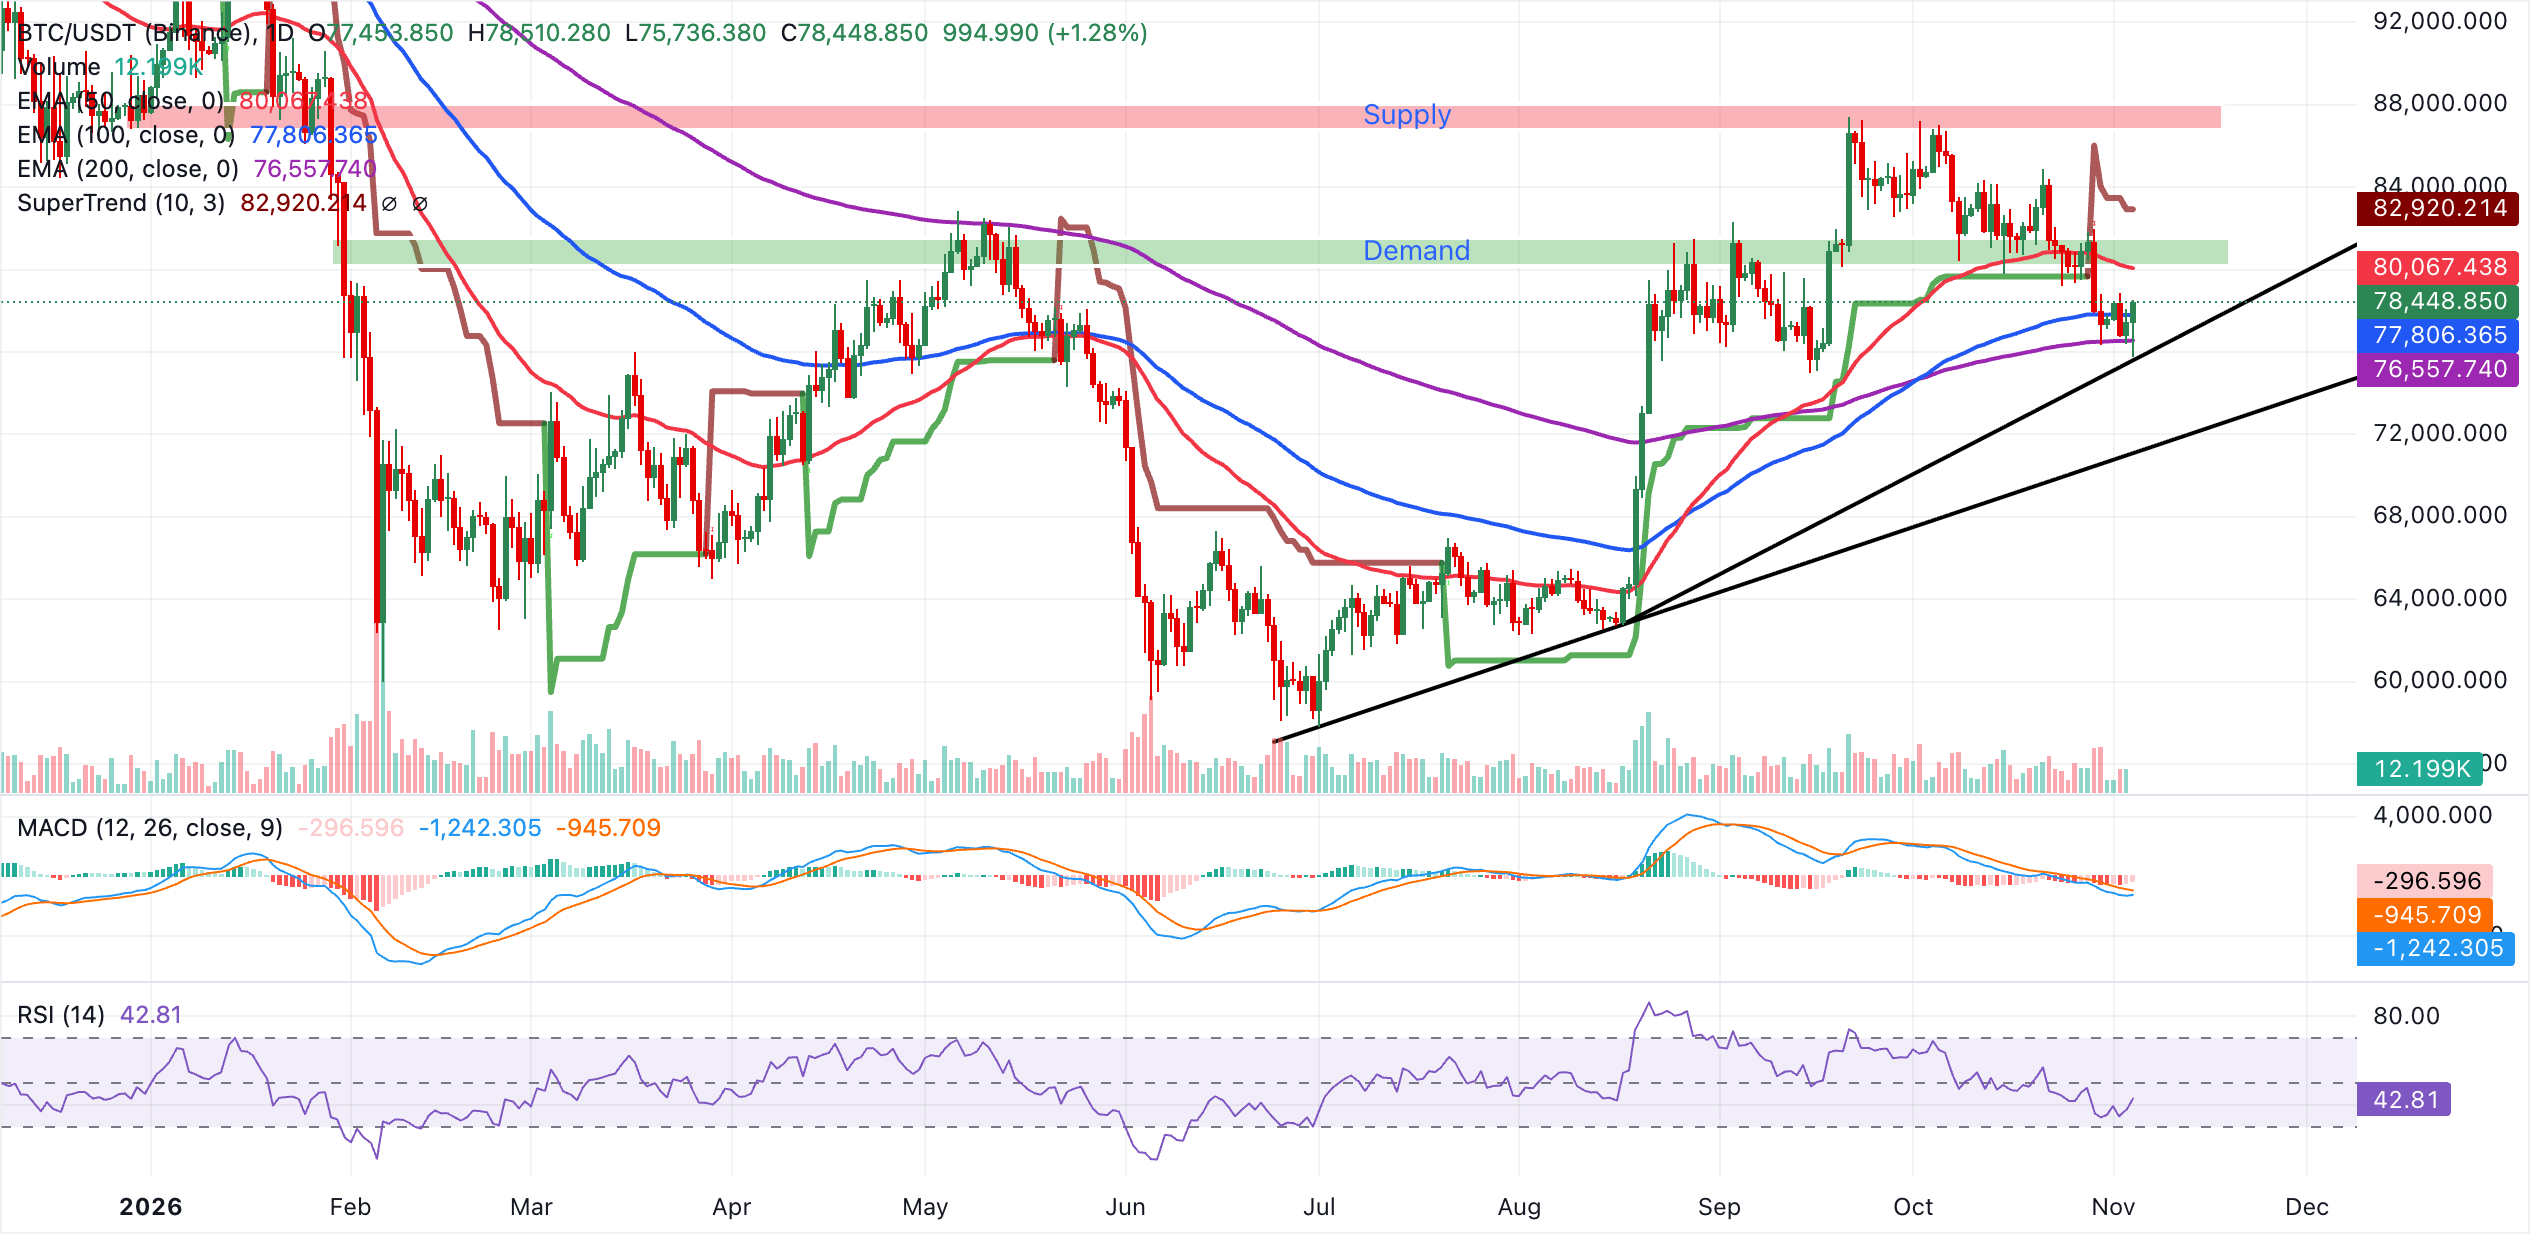
Immediate resistance lies at the 50-day EMA at $80,067, followed by the SuperTrend barrier at $82,920. On the downside, the first notable support zone sits near the recent pivot area around $78,448, with stronger underlying demand aligned with the short-term rising trendline at $75,650 and the deeper structural support from the prior trendline near $71,126. The 100-day and 200-day EMAs at $77,806 and $76,558 reinforce this layered support region, keeping the broader bullish structure intact while price trades above them.
Ethereum technical analysis: ETH eyes short-term recovery
Ethereum trades at $2,318, keeping a bearish near-term tone as price holds just above the 200-day EMA at $2,313 but remains capped by the 100-day EMA at $2,350. The 50-day EMA at $2,407 and the SuperTrend line at $2,490 sit further overhead, reinforcing a layered resistance structure despite the MACD turning positive above zero, while the RSI at 43 still points to subdued momentum.
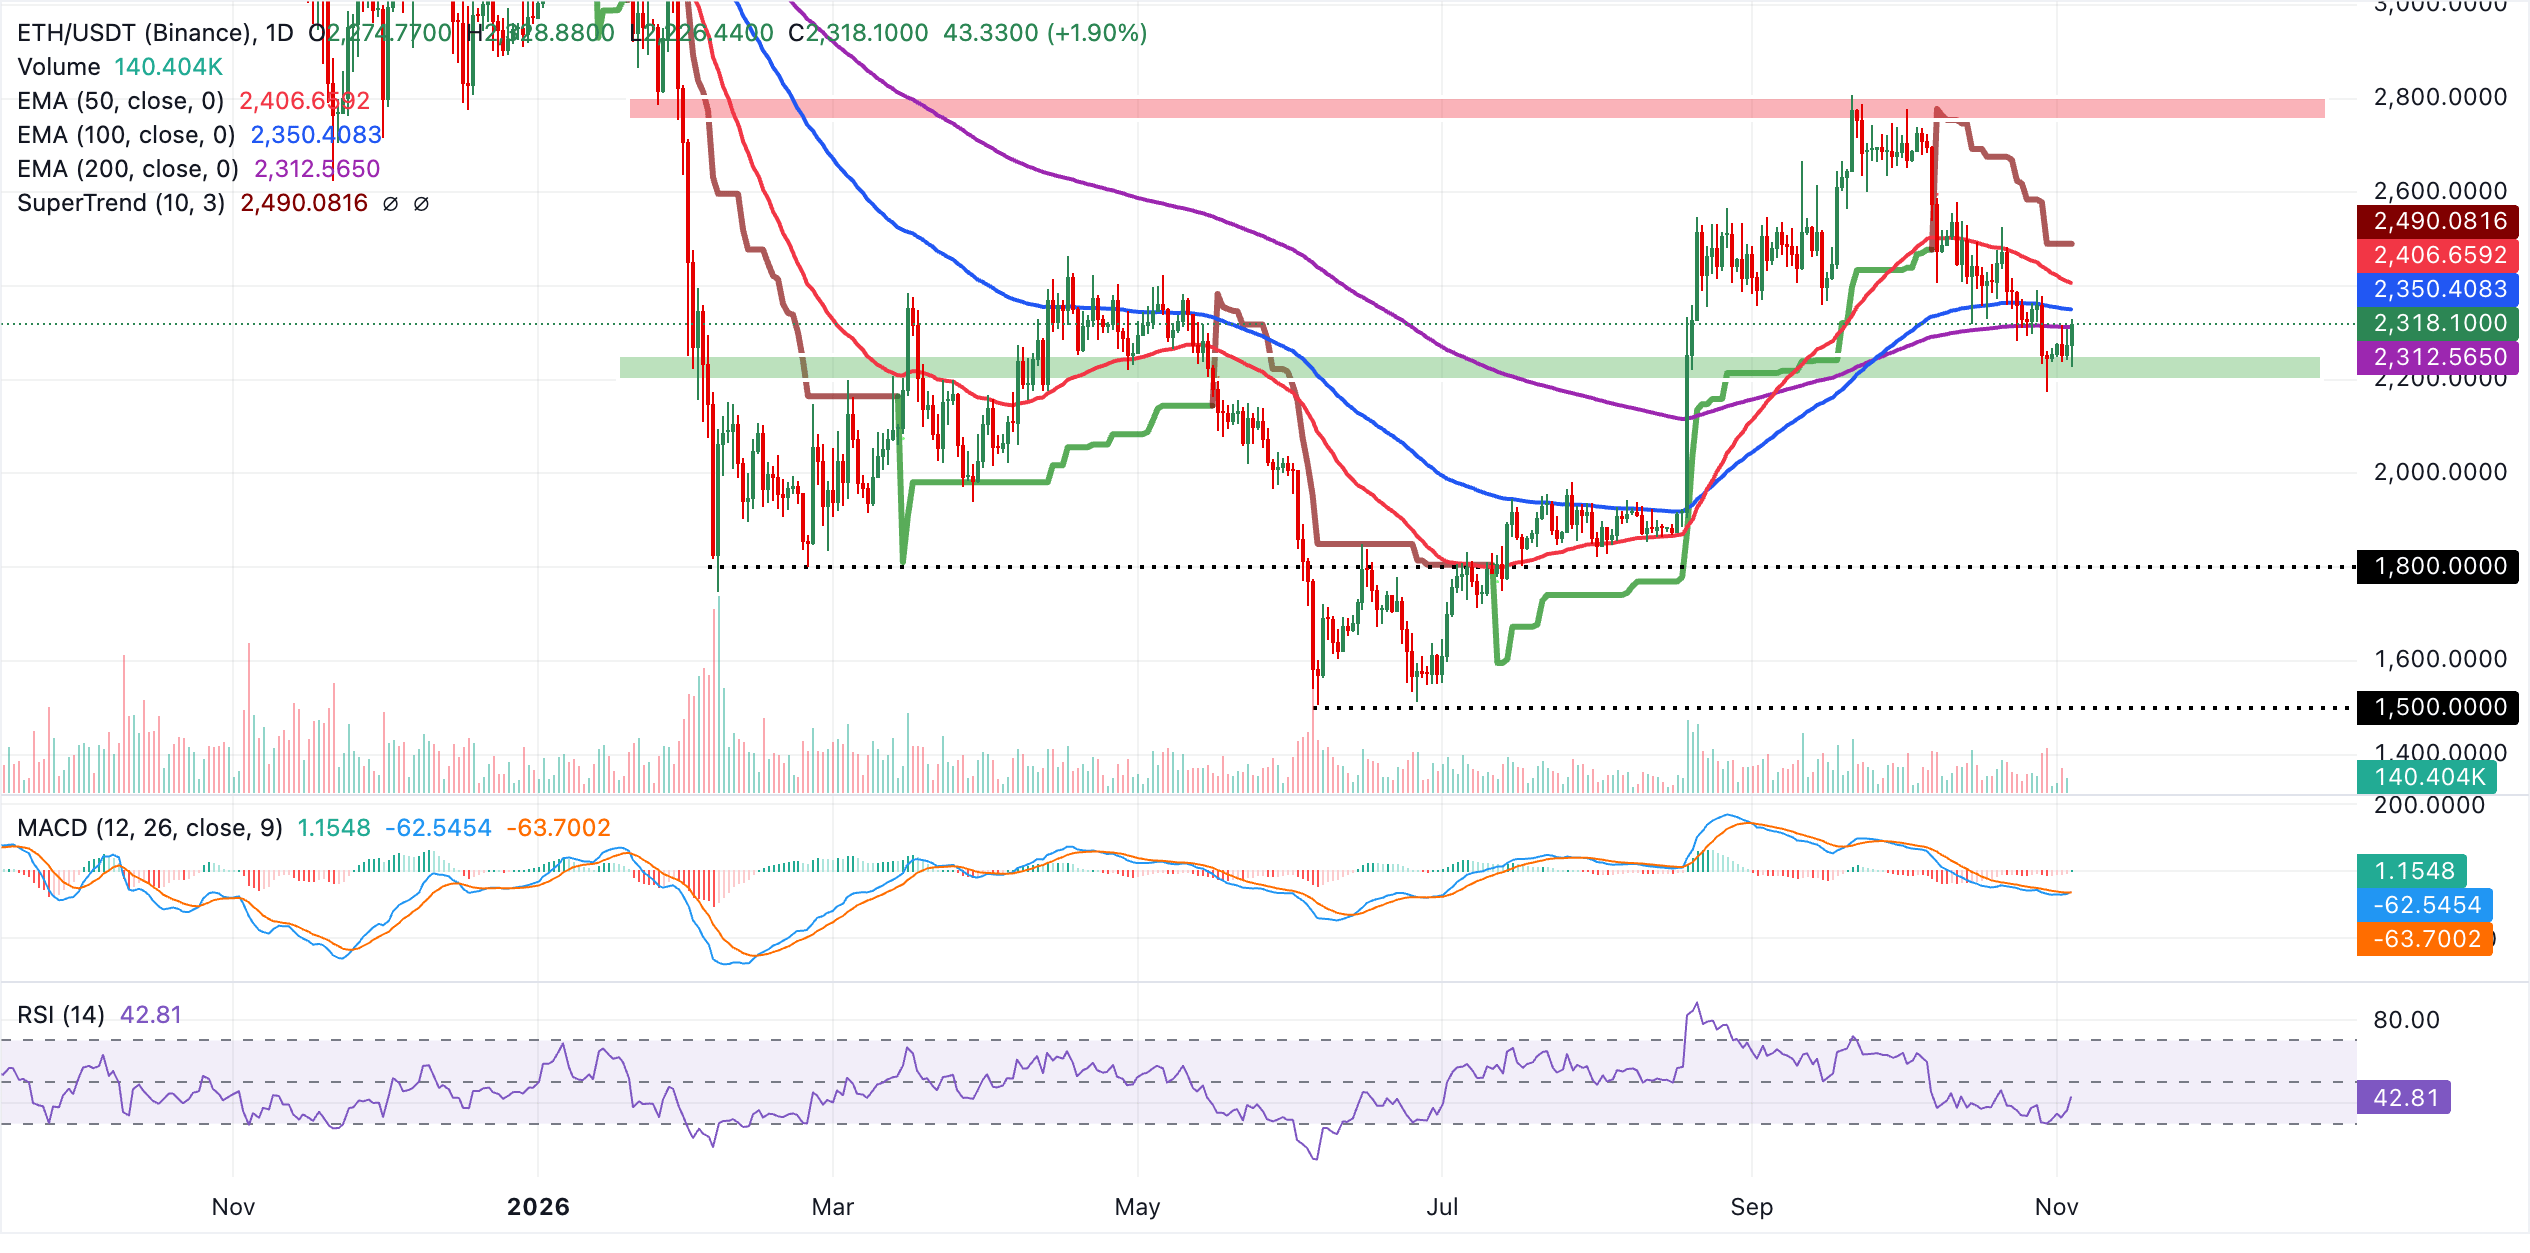
Initial resistance lies at the 100-day EMA near $2,350, followed by the 50-day EMA around $2,407, with a stronger barrier at the SuperTrend level near $2,490. On the downside, immediate support is provided by the 200-day EMA at roughly $2,313. A sustained break below this floor would likely reopen the path toward lower levels, while a daily close back above the clustered moving-average resistances would be needed to ease the current bearish bias.
Technical analysis: XRP ticks up as bulls return
XRP trades at $1.28, keeping a bearish near-term tone as the pair remains below the key moving averages. Price is capped beneath the 100-day EMA at $1.32 and the 50-day EMA at $1.34, while the 200-day EMA at $1.37 reinforces overhead supply. Bollinger Bands show spot trading under the middle band at $1.29, hinting at a downside bias despite a slightly positive MACD reading and a neutral RSI near 43, which together suggest only modest recovery potential at this stage.
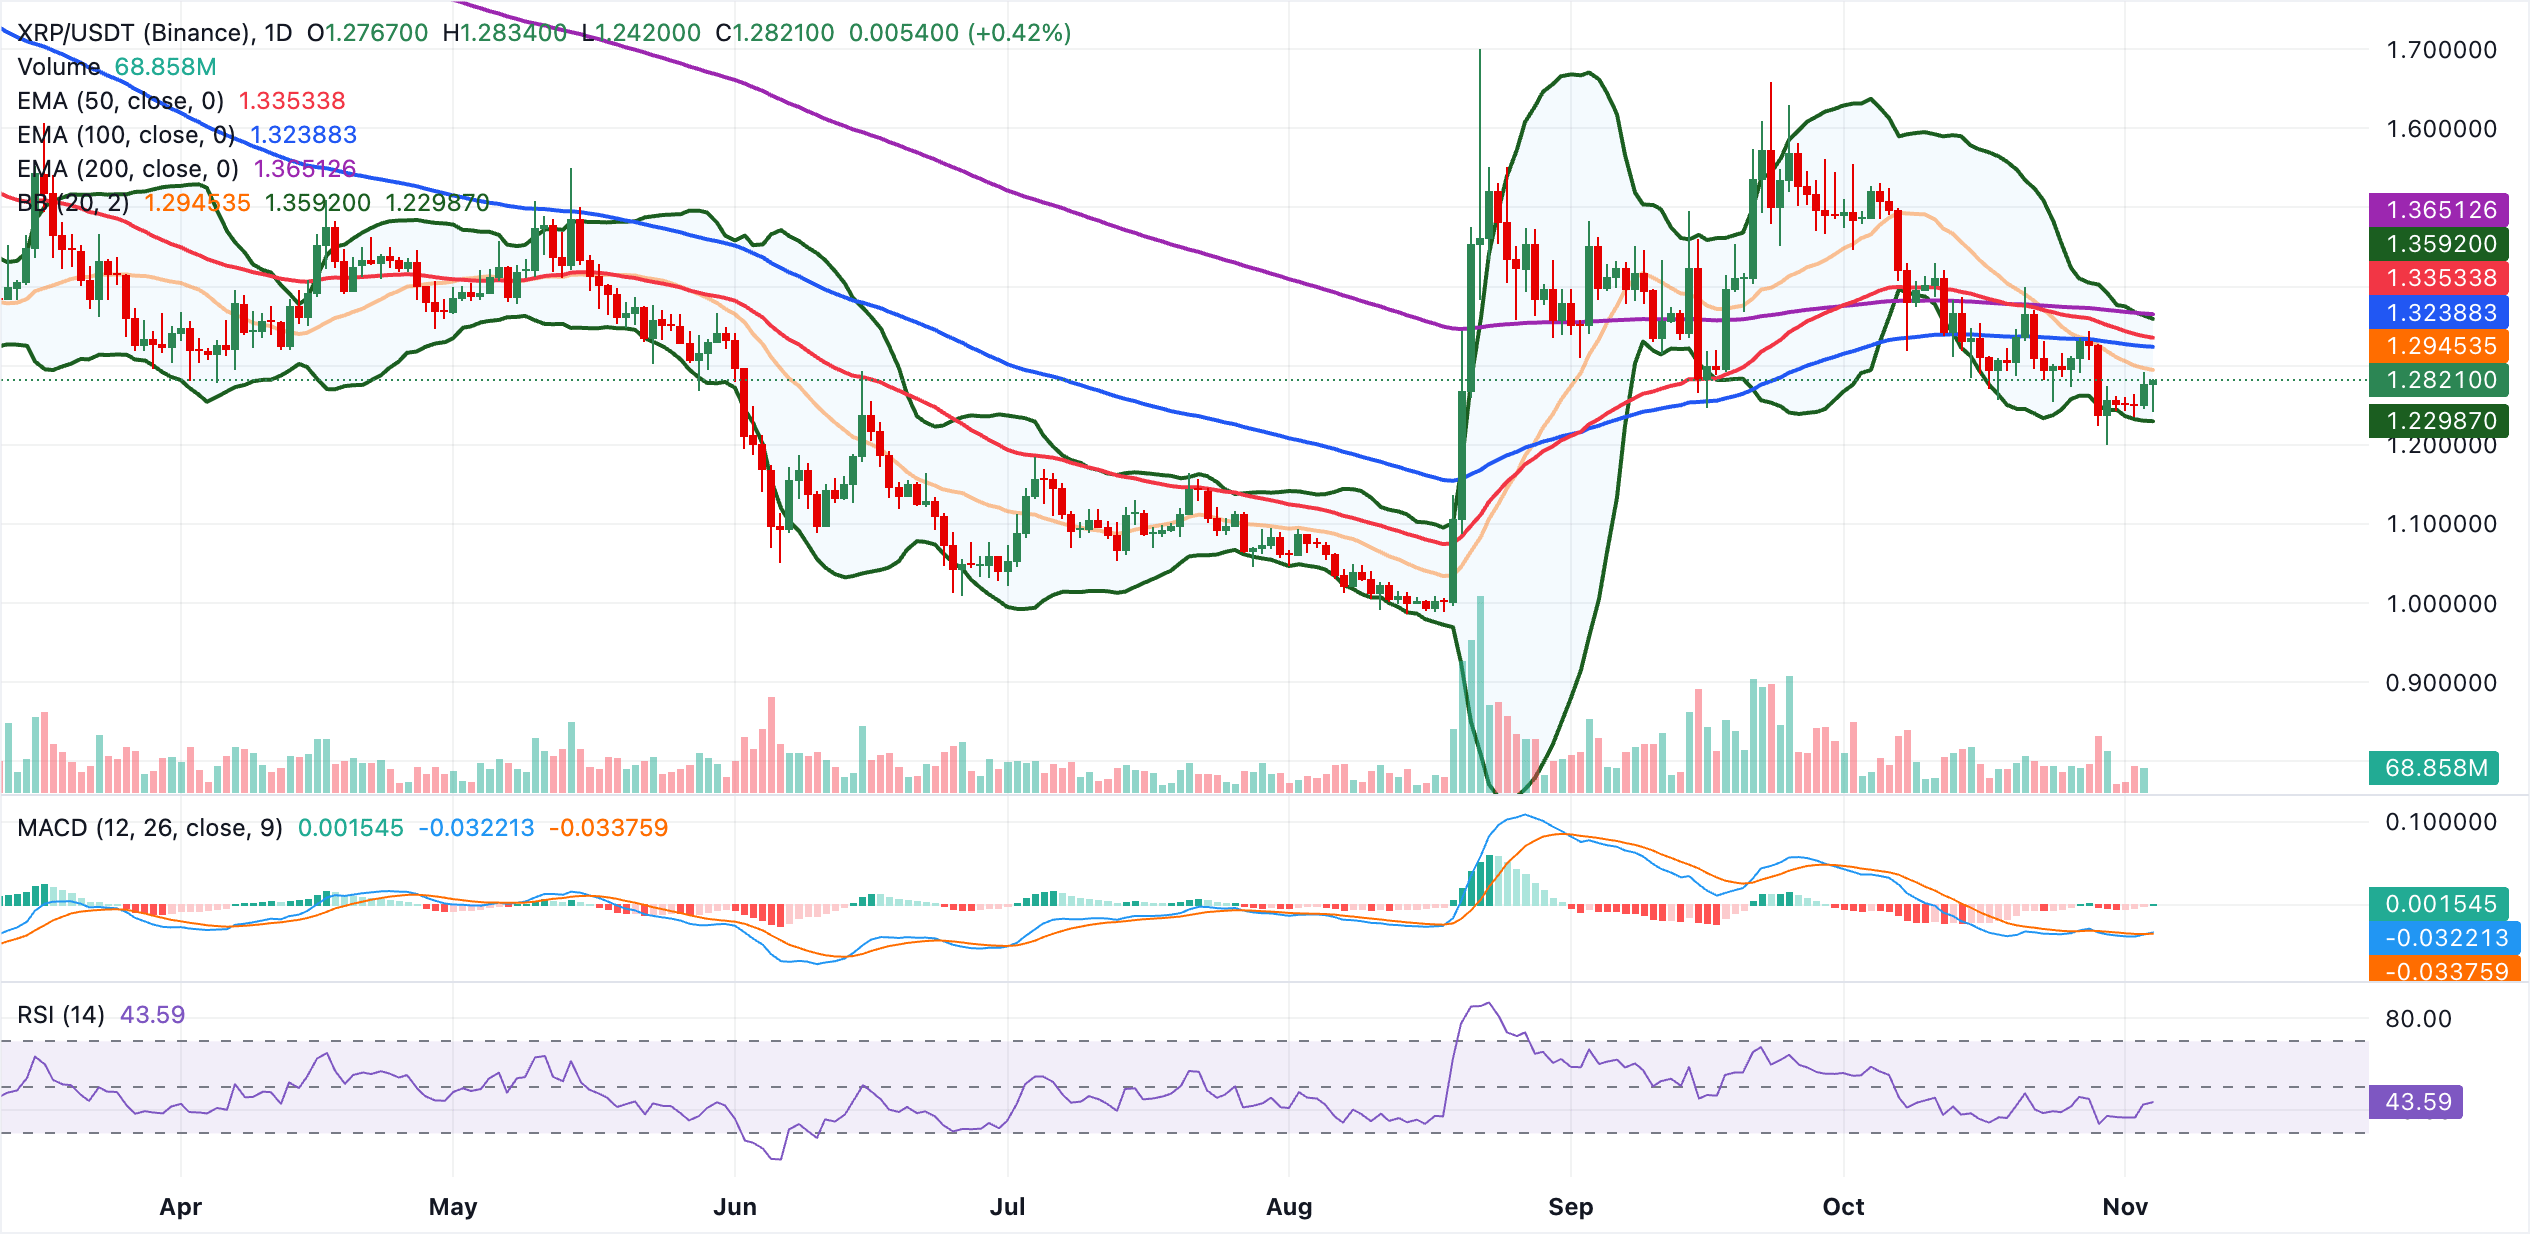
Initial resistance emerges at the Bollinger middle band near $1.29, followed by the 100-day EMA at $1.32 and the 50-day EMA at $1.34, with the Bollinger upper band at $1.36 and the 200-day EMA at $1.37 forming a broader supply zone if buyers attempt a stronger rebound. On the downside, immediate structural support lies at the Bollinger lower band around $1.23. A break would likely pave the way for a deeper correction, while holding above this floor keeps room open for a corrective bounce within the prevailing bearish framework.
Bitcoin, altcoins, stablecoins FAQs
Bitcoin is the largest cryptocurrency by market capitalization, a virtual currency designed to serve as money. This form of payment cannot be controlled by any one person, group, or entity, which eliminates the need for third-party participation during financial transactions.
Altcoins are any cryptocurrency apart from Bitcoin, but some also regard Ethereum as a non-altcoin because it is from these two cryptocurrencies that forking happens. If this is true, then Litecoin is the first altcoin, forked from the Bitcoin protocol and, therefore, an “improved” version of it.
Stablecoins are cryptocurrencies designed to have a stable price, with their value backed by a reserve of the asset it represents. To achieve this, the value of any one stablecoin is pegged to a commodity or financial instrument, such as the US Dollar (USD), with its supply regulated by an algorithm or demand. The main goal of stablecoins is to provide an on/off-ramp for investors willing to trade and invest in cryptocurrencies. Stablecoins also allow investors to store value since cryptocurrencies, in general, are subject to volatility.
Bitcoin dominance is the ratio of Bitcoin's market capitalization to the total market capitalization of all cryptocurrencies combined. It provides a clear picture of Bitcoin’s interest among investors. A high BTC dominance typically happens before and during a bull run, in which investors resort to investing in relatively stable and high market capitalization cryptocurrency like Bitcoin. A drop in BTC dominance usually means that investors are moving their capital and/or profits to altcoins in a quest for higher returns, which usually triggers an explosion of altcoin rallies.
(The technical analysis of this story was written with the help of an AI tool. Know more.)
Artigos Recomendados


