Top trending meme coins PEPE, BOME, TRUMP: Bearish signs persist

Fonte Fxstreet
  • Pepe price encounters resistance from a descending trendline.
  • BOOK OF MEME price finds support at the weekly level of $0.00944.
  • TRUMP price finds support along an ascending trendline.

Pepe (PEPE) price has encountered resistance at a critical level, whereas Trump (MAGA) and Book of Meme (BOME) are testing crucial support levels. The technical outlook suggests potential short-term corrections for PEPE and BOME, while MAGA appears poised for a rally.

Pepe price eyes for a short-term fall

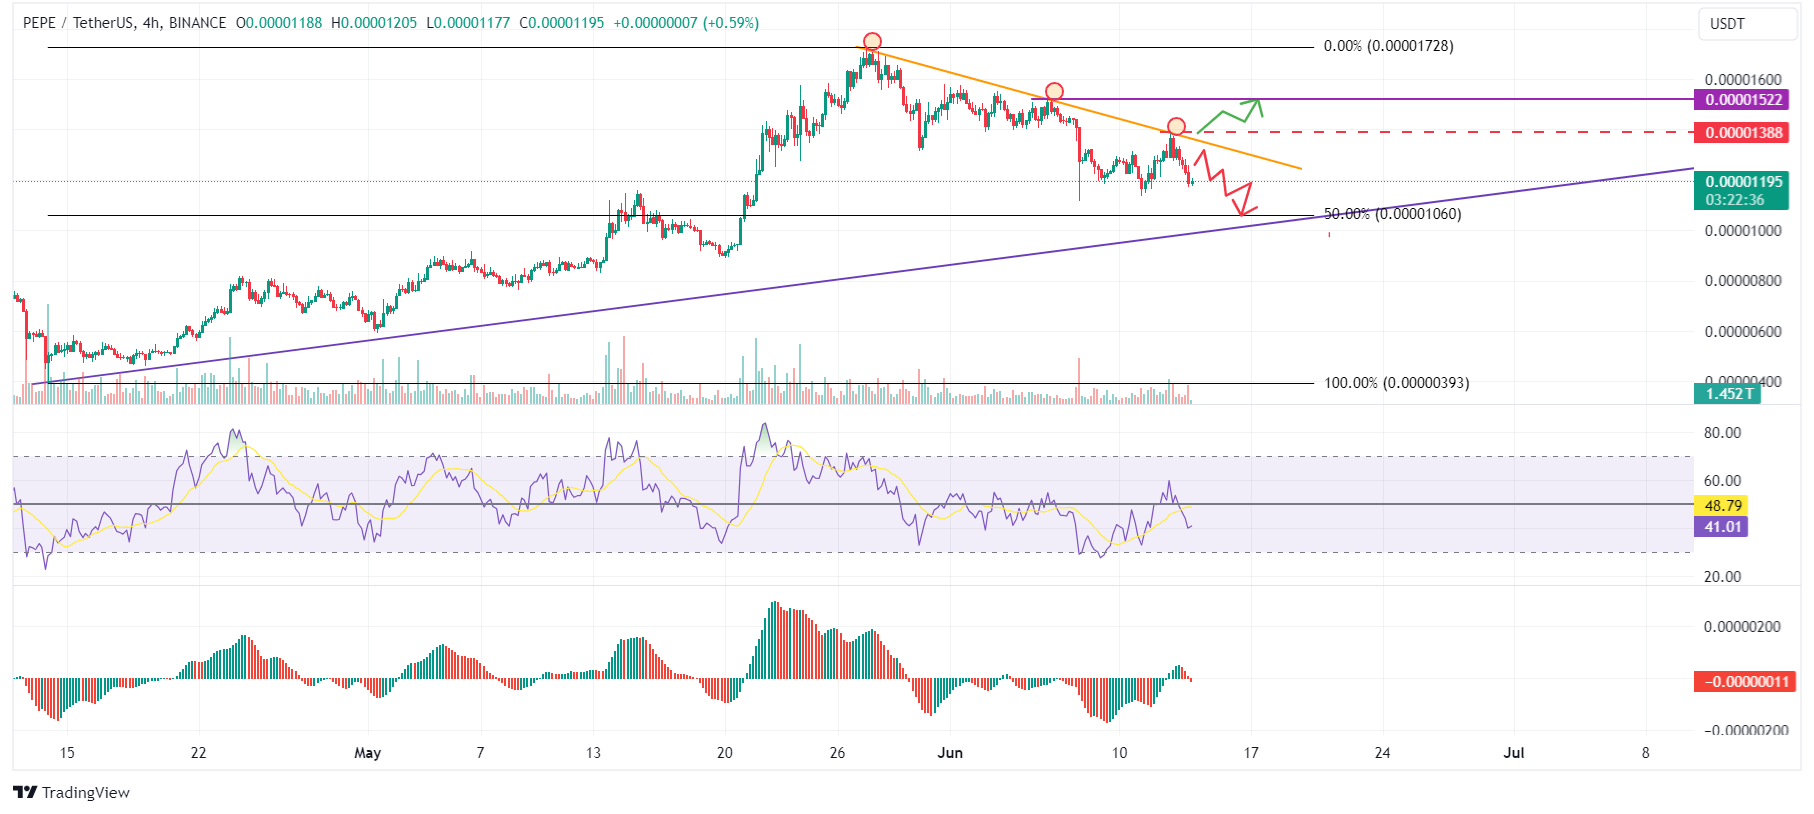
Pepe price currently faces resistance by a descending trendline drawn from joining three swing high points from the end of May to mid-June, as shown in the four-hour chart.

If this trendline holds as resistance, then PEPE could crash around 14% from its current trading price of $0.0000119 to $0.0000106, the 50% price retracement of the $0.0000039 to $0.0000172 up move. 

The Relative Strength Index (RSI) and the Awesome Oscillator (AO) on the four-hour chart support this bearish scenario, as both indicators are below their respective mean levels of 50 and 0.

This suggests the exhaustion among bulls and continued momentum favoring bears, potentially leading to a further decline in PEPE's price.

PEPE/USDT 4-hour chart

PEPE/USDT 4-hour chart

On the other hand, if Pepe’s price closes above $0.0000138, it would invalidate the bearish thesis by producing a higher high in the daily time frame, leading PEPE to rally 10% and hitting the previous daily high of $0.0000152 on June 6.

BOOK OF MEME price set to retest lows

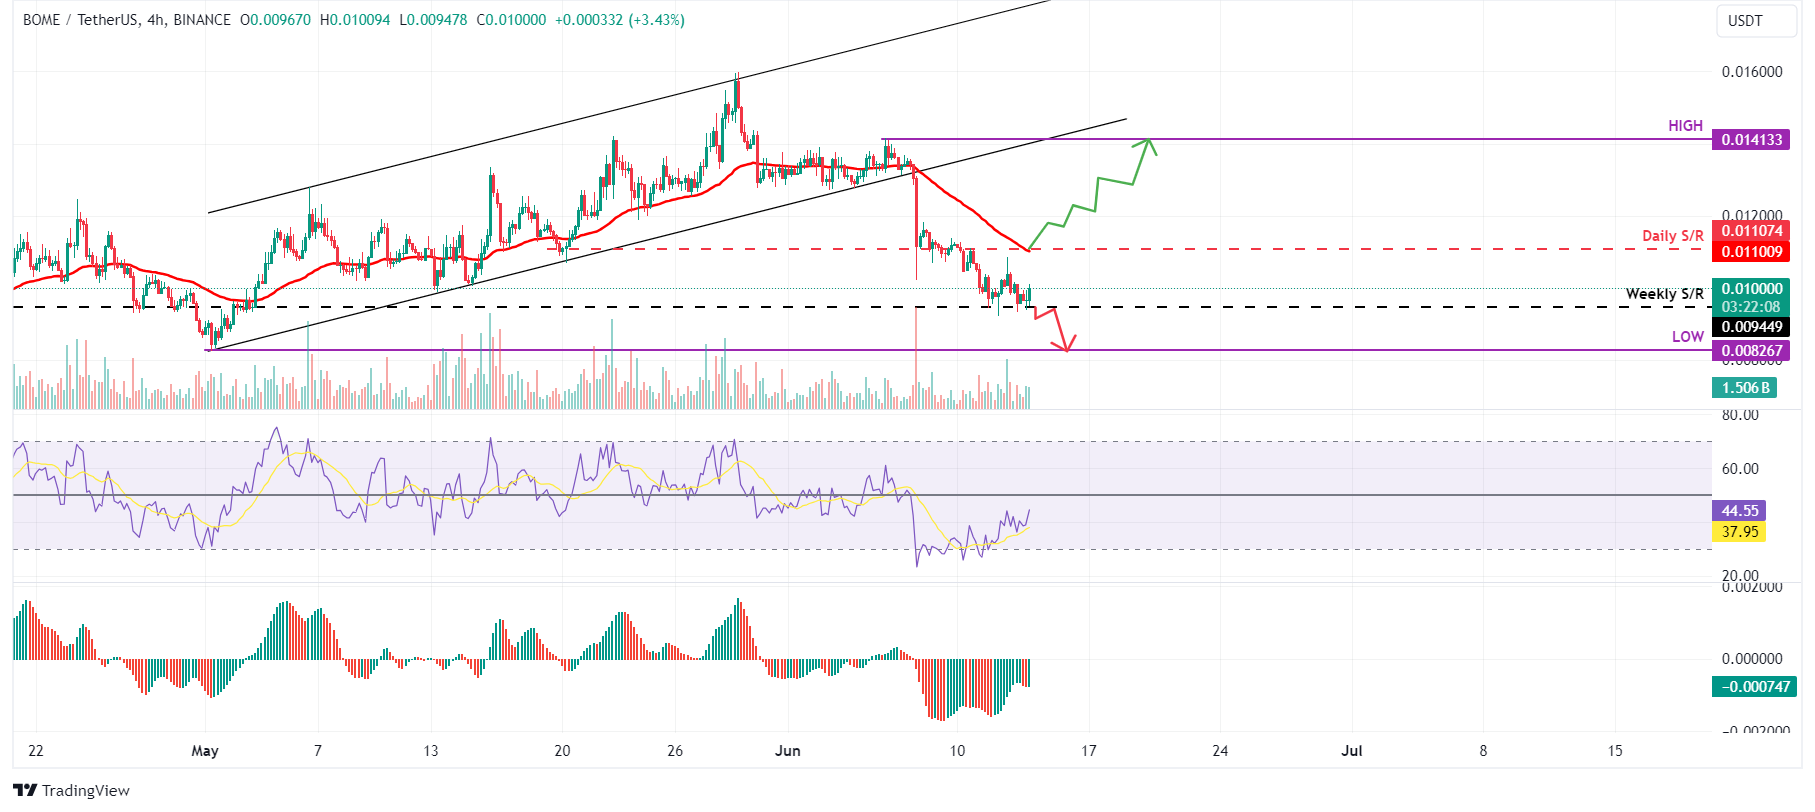
BOME price current stability hinges on the $0.00944 weekly support, but a breach below could trigger a 13% plunge to revisit its May 1 low of $0.00826.

The Relative Strength Index (RSI) and the Awesome Oscillator (AO) on the four-hour chart support this bearish scenario, as both indicators are below their respective mean levels of 50 and 0.

This suggests the exhaustion among bulls and continued momentum favoring bears, potentially leading to a further decline in BOME's price.
BOME/USDT 4-hour chart

BOME/USDT 4-hour chart

However, if the BOME daily candlestick closes above the $0.0111 daily resistance level and flips it in support, and the RSI and AO surge above their mean levels of 50 and 0, then a pivotal market shift from bearish to bullish could transpire. 

This structural change would be marked by BOME forming a higher high in the daily timeframe. In such an event, BOME could potentially rally by 27%, aiming to retest its June 6 high of $0.014133.

TRUMP price shows potential

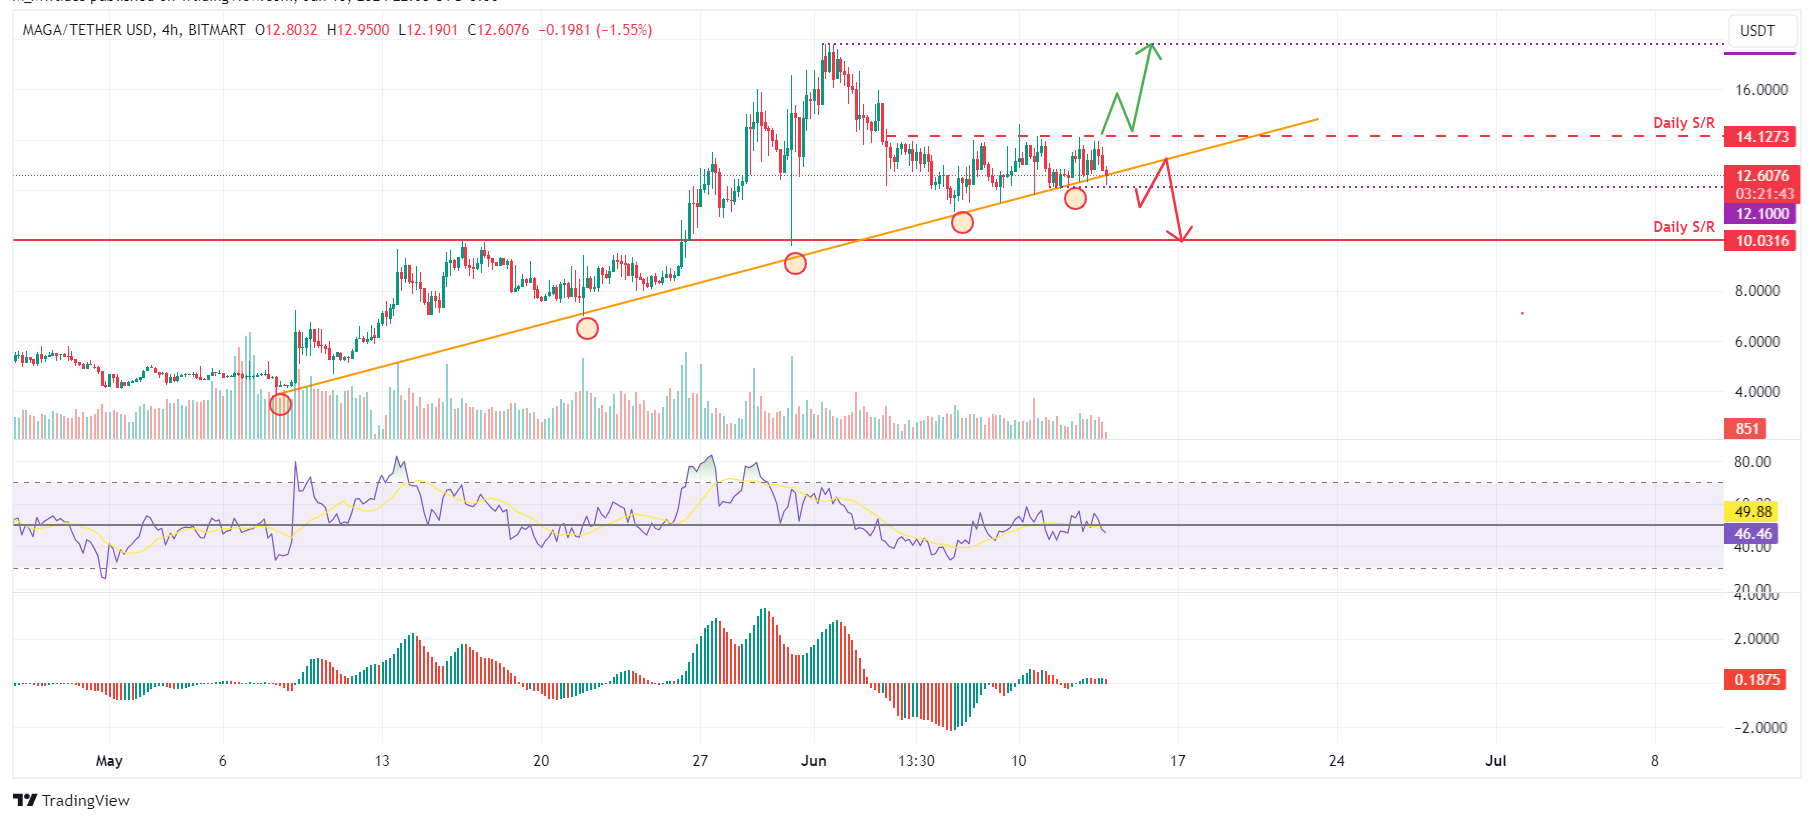
MAGA price (TRUMP) finds support around an ascending trendline drawn from joining multiple swing low points from May to June, as shown in the four-hour chart. If this support holds and TRUMP’s price closes above the $14.127 daily resistance level, then it could rally 25% to tag the daily high of $17.79 on June 1.

The Relative Strength Index (RSI) and the Awesome Oscillator (AO) on the four-hour chart support this bullish outlook by both being above the mean levels of 50 and 0, indicating that bulls still have steam to push TRUMP's price higher.
TRUMP/USDT 4-hour chart

TRUMP/USDT 4-hour chart

On the other hand, if MAGA's daily candlestick breaks below the trendline and closes below the $12.10 level, it would produce a lower low and signal a break in the market structure. This move would invalidate the aforementioned bullish thesis, potentially triggering a 17% crash to the daily support level of $10.03.

Isenção de responsabilidade: Apenas para fins informativos. O desempenho passado não é indicativo de resultados futuros.
placeholder
Dólar cai para R$ 5,35, menor valor em 15 meses; mercado monitora decisões de juros e tensões com EUAO dólar completou a terceira sessão consecutiva de queda no mercado de câmbio brasileiro e encerrou a sexta-feira (12) cotado a R$ 5,3464, seu menor valor de fechamento em 15 meses, desde junho de 2024. O movimento de valorização do real ocorreu a despeito de um dia de ganhos para a moeda norte-americana no cenário internacional, mostrando a força de fatores locais e da expectativa em relação à política monetária dos dois países.
Autor  Pedro Augusto Prazeres
9 Mês 15 Dia Seg
O dólar completou a terceira sessão consecutiva de queda no mercado de câmbio brasileiro e encerrou a sexta-feira (12) cotado a R$ 5,3464, seu menor valor de fechamento em 15 meses, desde junho de 2024. O movimento de valorização do real ocorreu a despeito de um dia de ganhos para a moeda norte-americana no cenário internacional, mostrando a força de fatores locais e da expectativa em relação à política monetária dos dois países.
placeholder
Os otimistas do ouro ainda não estão dispostos a desistir, em meio às apostas na redução das taxas de juros pelo Fed e aos riscos geopolíticosO ouro (XAU/USD) inicia a nova semana em baixa, embora consiga reverter uma queda na sessão asiática para a área de US$ 3.627-3.626 e atualmente seja negociado perto do limite superior de uma faixa de negociação com uma semana de duração.
Autor  FXStreet
9 Mês 15 Dia Seg
O ouro (XAU/USD) inicia a nova semana em baixa, embora consiga reverter uma queda na sessão asiática para a área de US$ 3.627-3.626 e atualmente seja negociado perto do limite superior de uma faixa de negociação com uma semana de duração.
placeholder
BTLG11 aumenta dividendo para R$ 0,79; RCRB11 tem maior lucro em 10 meses com gestão de vacânciaO fundo de investimento imobiliário BTG Pactual Logística (BTLG11) anunciou um aumento em seus dividendos mensais, que passarão a ser de R$ 0,79 por cota. O novo valor, que é isento de Imposto de Renda para pessoas físicas, representa o maior patamar de distribuição do fundo nos últimos oito meses e será pago aos cotistas no dia 25 de setembro.
Autor  Pedro Augusto Prazeres
Ontem 02: 03
O fundo de investimento imobiliário BTG Pactual Logística (BTLG11) anunciou um aumento em seus dividendos mensais, que passarão a ser de R$ 0,79 por cota. O novo valor, que é isento de Imposto de Renda para pessoas físicas, representa o maior patamar de distribuição do fundo nos últimos oito meses e será pago aos cotistas no dia 25 de setembro.
placeholder
Previsão do preço da Avalanche: AVAX prevê alta em meio ao pedido de ETF da Bitwise e aumento no volume da DEXO preço da Avalanche (AVAX) caiu 1% até o momento da publicação desta notícia, na terça-feira, prolongando a dificuldade em se aproximar da marca de US$ 30. A Bitwise está se preparando para lançar o AVAX Exchange Traded Fund (ETF) com o formulário S-1 registrado na Comissão de Valores Mobiliários dos Estados Unidos (SEC), inclinando a balança para o otimismo.
Autor  FXStreet
Ontem 05: 43
O preço da Avalanche (AVAX) caiu 1% até o momento da publicação desta notícia, na terça-feira, prolongando a dificuldade em se aproximar da marca de US$ 30. A Bitwise está se preparando para lançar o AVAX Exchange Traded Fund (ETF) com o formulário S-1 registrado na Comissão de Valores Mobiliários dos Estados Unidos (SEC), inclinando a balança para o otimismo.
placeholder
O ouro está próximo de seu recorde histórico, com as apostas na redução das taxas do Fed mantendo o dólar americano em baixaO ouro (XAU/USD) recua ligeiramente após atingir um novo recorde, em torno da região de US$ 3.689-3.690 durante o pregão asiático desta terça-feira, em meio a algumas negociações de reposicionamento antes de eventos importantes dos bancos centrais.
Autor  FXStreet
Ontem 05: 52
O ouro (XAU/USD) recua ligeiramente após atingir um novo recorde, em torno da região de US$ 3.689-3.690 durante o pregão asiático desta terça-feira, em meio a algumas negociações de reposicionamento antes de eventos importantes dos bancos centrais.
goTop
quote