


Crypto Today: Bitcoin, Ethereum, and Ripple – Bulls start to lose control
- Bitcoin edges below $84,000 on Thursday, extending losses for the third consecutive day.
- Ethereum hovers above $2,600, retreating from Monday’s high of $2,807.
- Ripple ticks below $1.50, extending its 4% losses from the previous day.
Bitcoin (BTC), Ethereum (ETH), and Ripple (XRP) are trading in the red on Thursday after losses of 2% to 4% the previous day. The major cryptos are starting to lose bullish control in the near term so far this week, despite the institutional funds witnessing steady inflows. The technical outlook for Bitcoin, Ethereum, and Ripple indicates near-term downside risk.
Institutional confidence holds firm
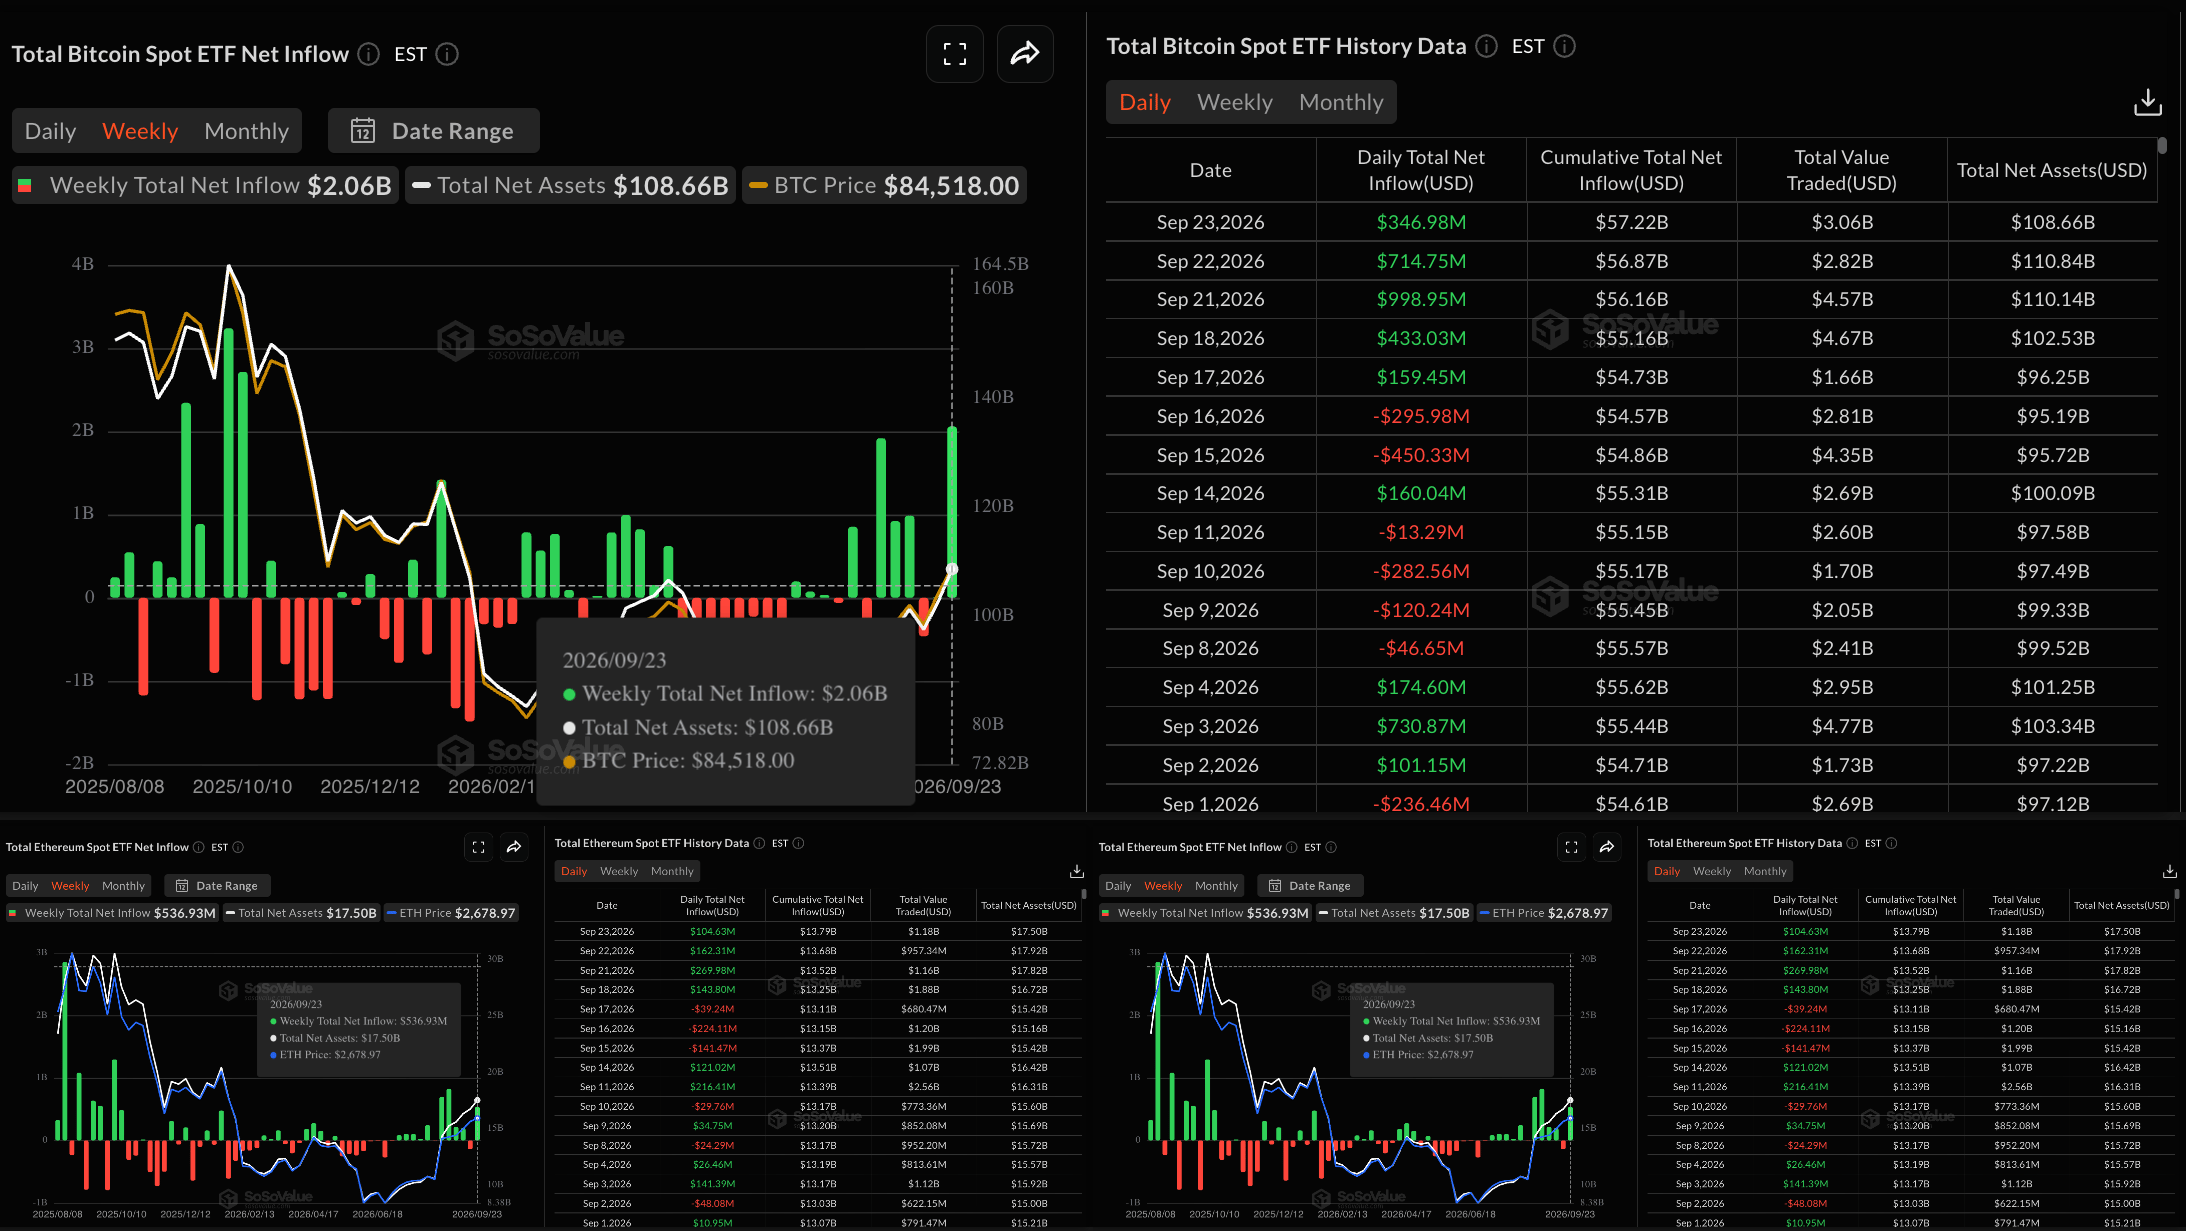
Institutional confidence in major cryptocurrencies has recently been revamped over the past week. Bitcoin spot Exchange Traded Funds (ETFs) recorded $346.98 million in inflows on Wednesday, marking the fifth consecutive day of positive inflows and bringing the week's total to $2.06 billion so far.
On the other hand, Ethereum and XRP recorded $104.63 million and $18.04 million in inflows on Wednesday, bringing their weekly total gains to $536.93 million and $38.06 million so far. The positive inflows across all three major cryptocurrencies reflect strong institutional confidence and signal a long-term bullish bias.
Bitcoin pulls back as buyers lose control
Bitcoin trades around $83,900 at press time on Thursday, extending its pullback from this week's high around $87,395. Still, BTC hovers well above the rising 50-, 100-, and 200-day Exponential Moving Averages (EMAs) near $76,095, $73,068, and $74,123, respectively, reinforcing a bullish long-term bias.
The Fibonacci retracement from $97,924 to $57,800 identifies the 78.6% level at $87,476 as the immediate resistance, which capped gains earlier this week.
Momentum remains constructive on the daily chart as the Relative Strength Index (RSI) prints around 61, retracing from the overbought zone. At the same time, the Moving Average Convergence Divergence (MACD) holds marginally above its signal line, suggesting that buyers are beginning to lose control.
On the downside, immediate support emerges at the reclaimed May 6 high at $82,850, followed by the 50-day EMA at $76,095, reinforced by the 50% retracement level at $75,233.
Ethereum faces downside risk
Ethereum trades around $2,600 at press time on Thursday, maintaining a near-term bearish bias. The major altcoin extends a pullback from Monday's high at $2,807, which was capped by the 127.2% Fibonacci extension level near $2,769, measured over the upswing from $1,872 to $2,546.
ETH holds well above the 50-day EMA at $2,380, while the 100- and 200-day EMAs at $2,230 and $2,229, respectively, reaffirm the supported uptrend. Still, the RSI at 62, easing out of the overbought zone, and the MACD line risking a cross below its signal line, hint that buyers could be losing control.
The immediate support for ETH aligns with the Fibonacci anchor at $2,546, followed by the 78.6% Fibonacci retracement at $2,384.
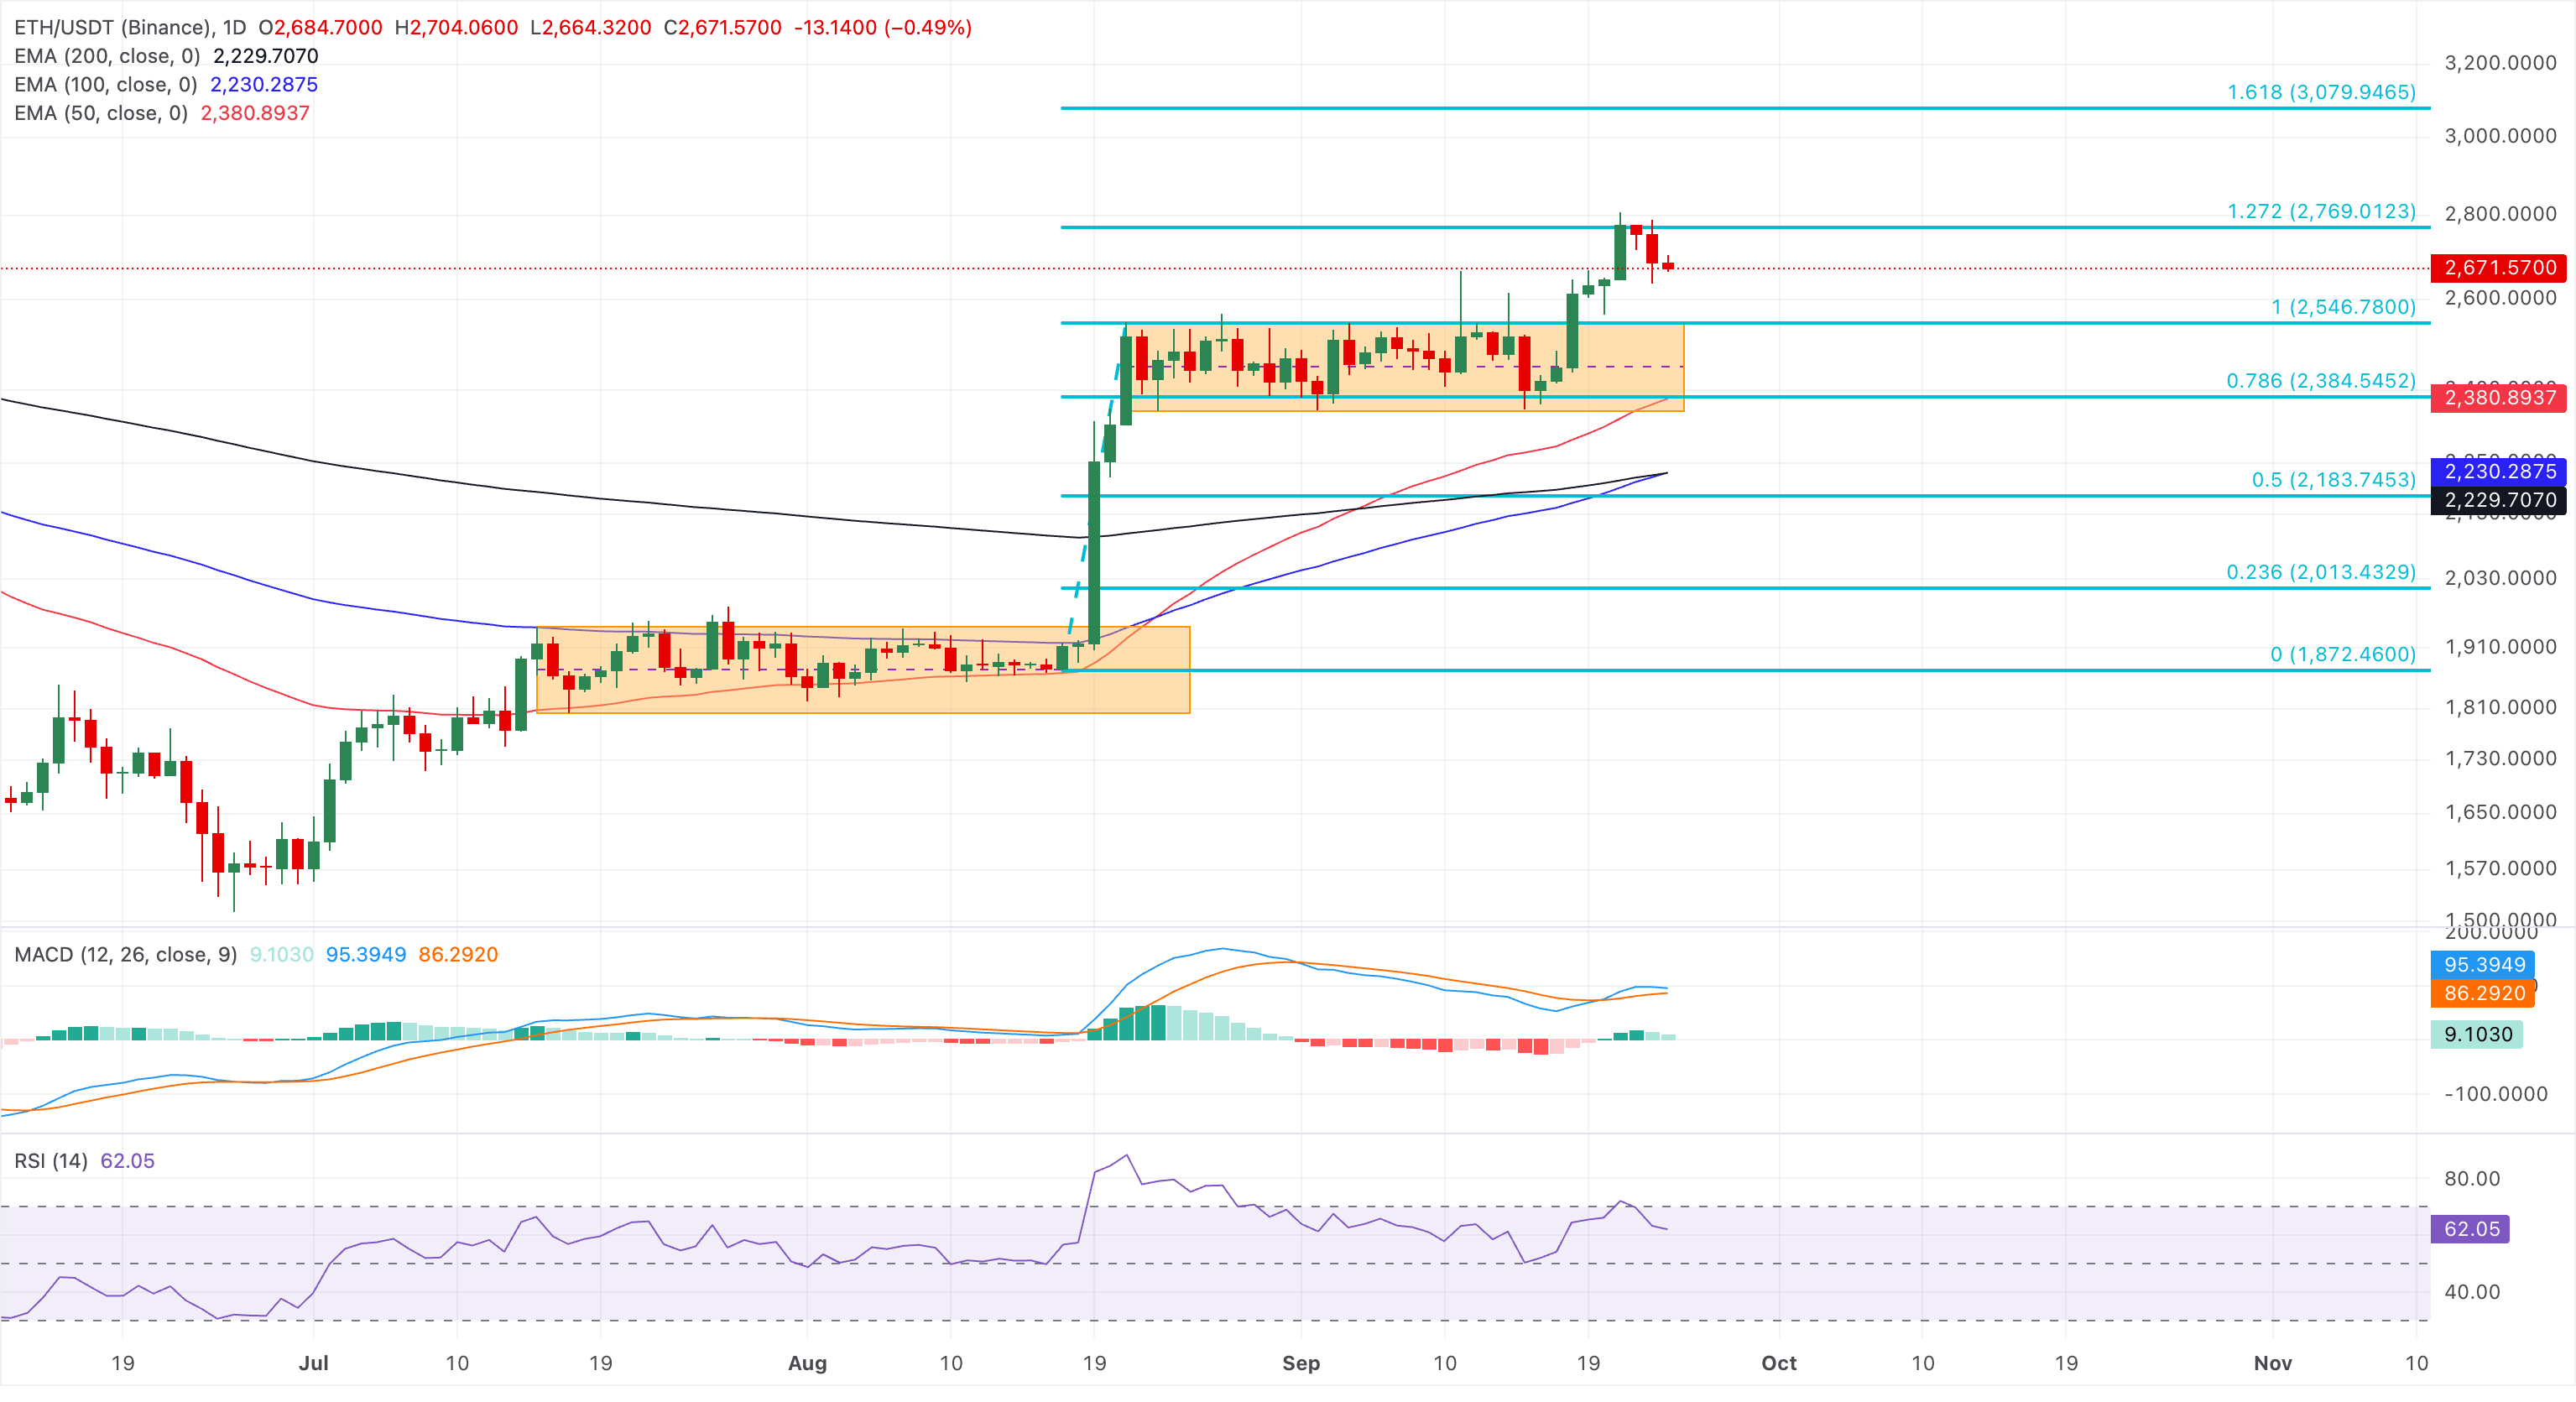
Ethereum must reclaim the 127.2% Fibonacci extension at $2,769 to extend its recovery toward the 161.8% level at $3,079.
Ripple under pressure eyes 200-day EMA
Ripple is down nearly 3% on Thursday, extending its 4% losses from the previous day. Still, the price sits well above the 50-, 100-, and 200-day EMAs at $1.3286, $1.2888, and $1.3503, respectively, underpinning a bullish near-term bias.
Momentum metrics back easing the constructive tone, as the MACD holds marginally above its signal line in positive territory with a contracting positive histogram, while the RSI at 56 approaches the neutral midline.
The Fibonacci retracement over the mid-August upswing from $0.9888 to $1.6999 highlights the pullback tracing below the 78.6% level at $1.5137. This indicates the immediate support at the highly guarded support cluster, formed by the 50% retracement level at $1.2964 and the crucial EMAs.
Looking up, buyers must reclaim the 78.6% retracement at $1.5137, which could open the door to the cycle high zone around $1.6999.
(The technical analysis of this story was written with the help of an AI tool. Know more.)
Artigos Recomendados


