

Crypto Market Overview: Recovery continues amid US-Iran war – Pi Network, River, Midnight lead gains
- Bitcoin hovers above $71,000 on Friday, Ethereum above $2,100, and XRP around $1.40, reflecting recovery across top cryptocurrencies.
- Data show renewed risk-on sentiment among derivatives traders, with US crypto markets showing relatively improved sentiment compared to Korean markets.
- Pi Network, River, and Midnight emerge as top crypto gainers over the last 24 hours.
The cryptocurrency market extends its recovery on Friday with Bitcoin (BTC) rising above $71,000, Ethereum (ETH) crossing $2,100, and Ripple (XRP) around $1.40. Derivatives and on-chain data show a renewed risk-on sentiment among traders, driven by US market demand and outweighing Korean market demand.
Altcoins such as Pi Network (PI), River (RIVER), and Midnight (NIGHT) lead the broader market recovery despite the escalating US-Iran war keeping the Strait of Hormuz nearly blocked, which is linked to higher Crude Oil prices.
US demand outpaces Korea, supporting renewed interest in the crypto market
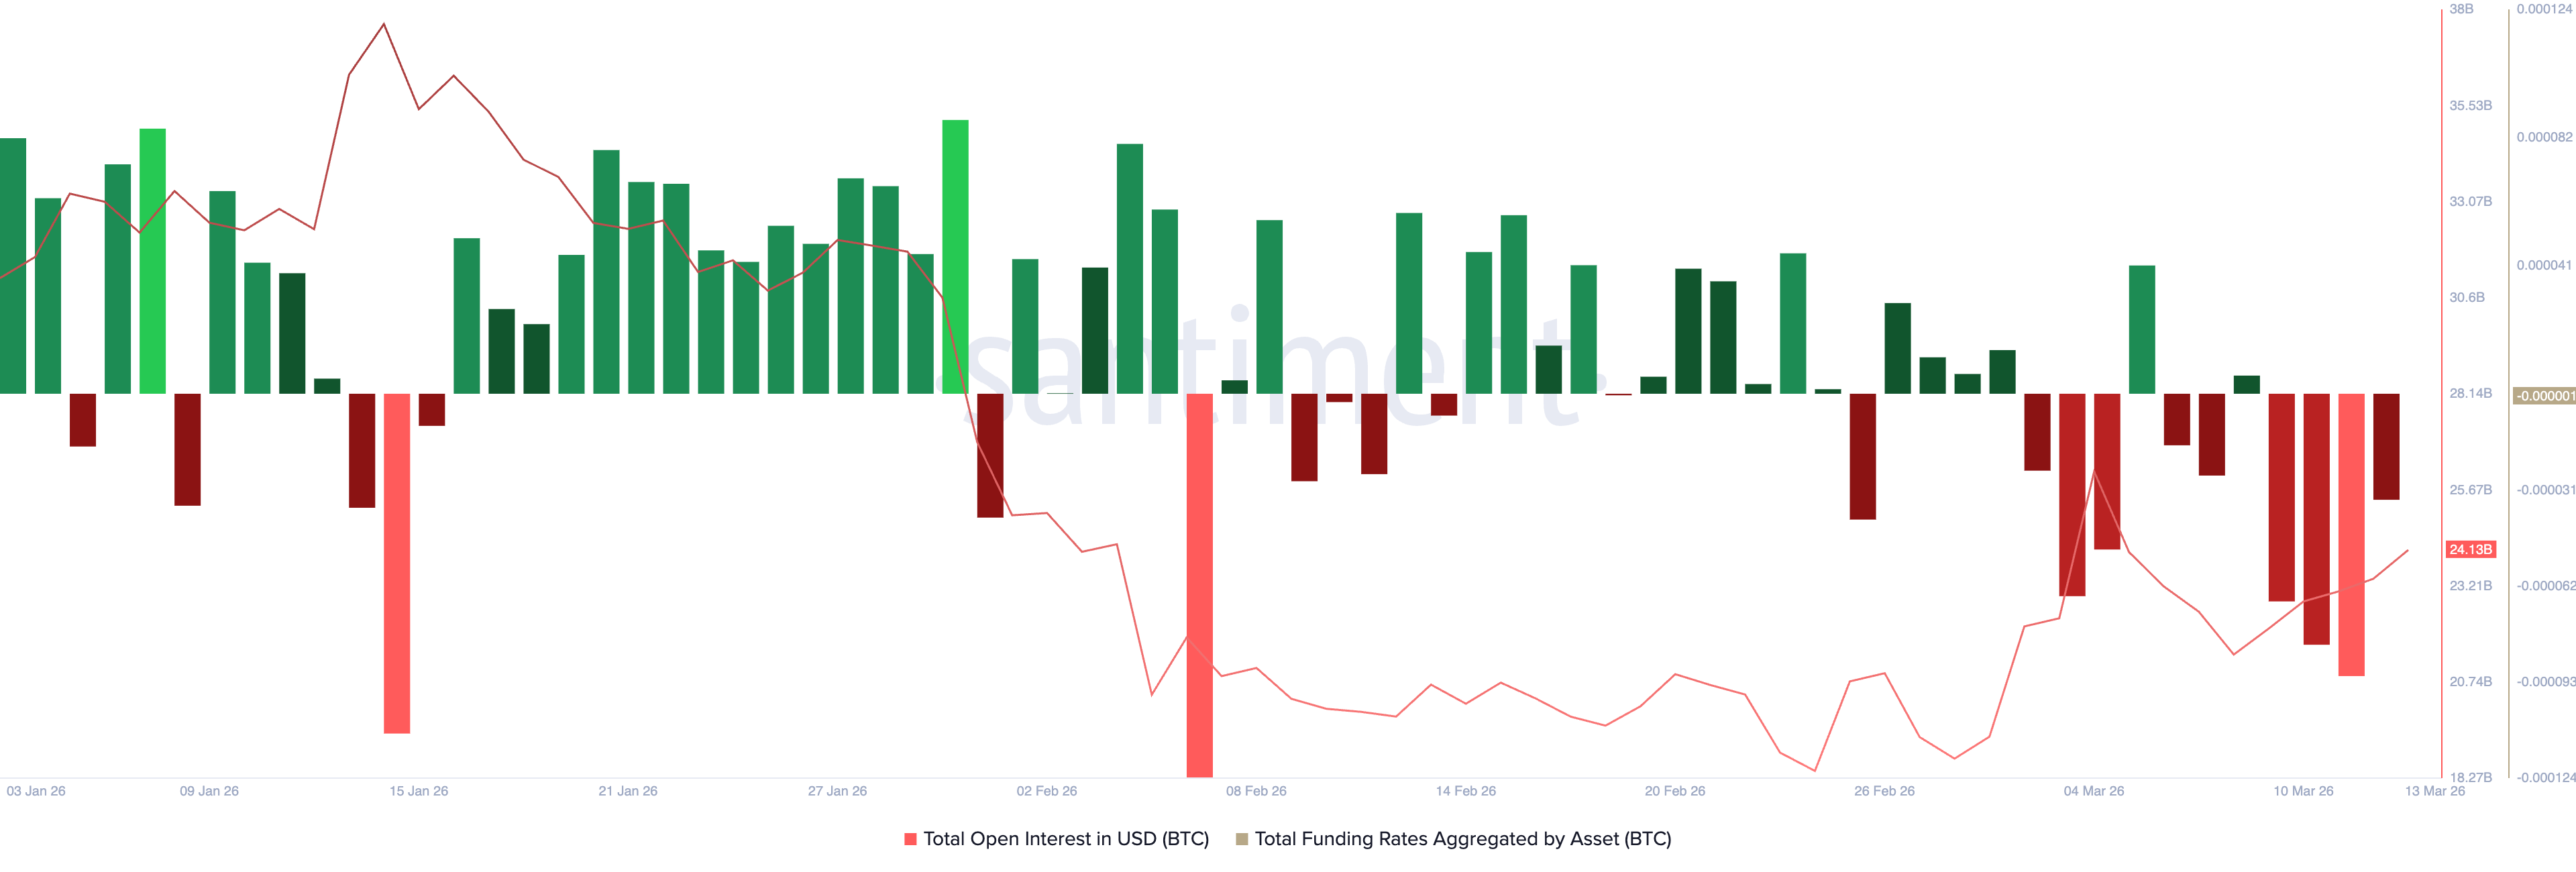
Consistent with the steady rise in Bitcoin prices so far this week, its futures Open Interest (OI) mirrors a similar recovery. Santiment data shows that the BTC OI is at $24.13 billion, up from $21.44 billion on Sunday, indicating an increase in the notional value of outstanding futures contracts.
Alongside the positional buildup, the total aggregated funding rate across exchanges is at close to 0%, rising from -0.003124% on Thursday, reflecting a significant decline in bearish interest among traders.
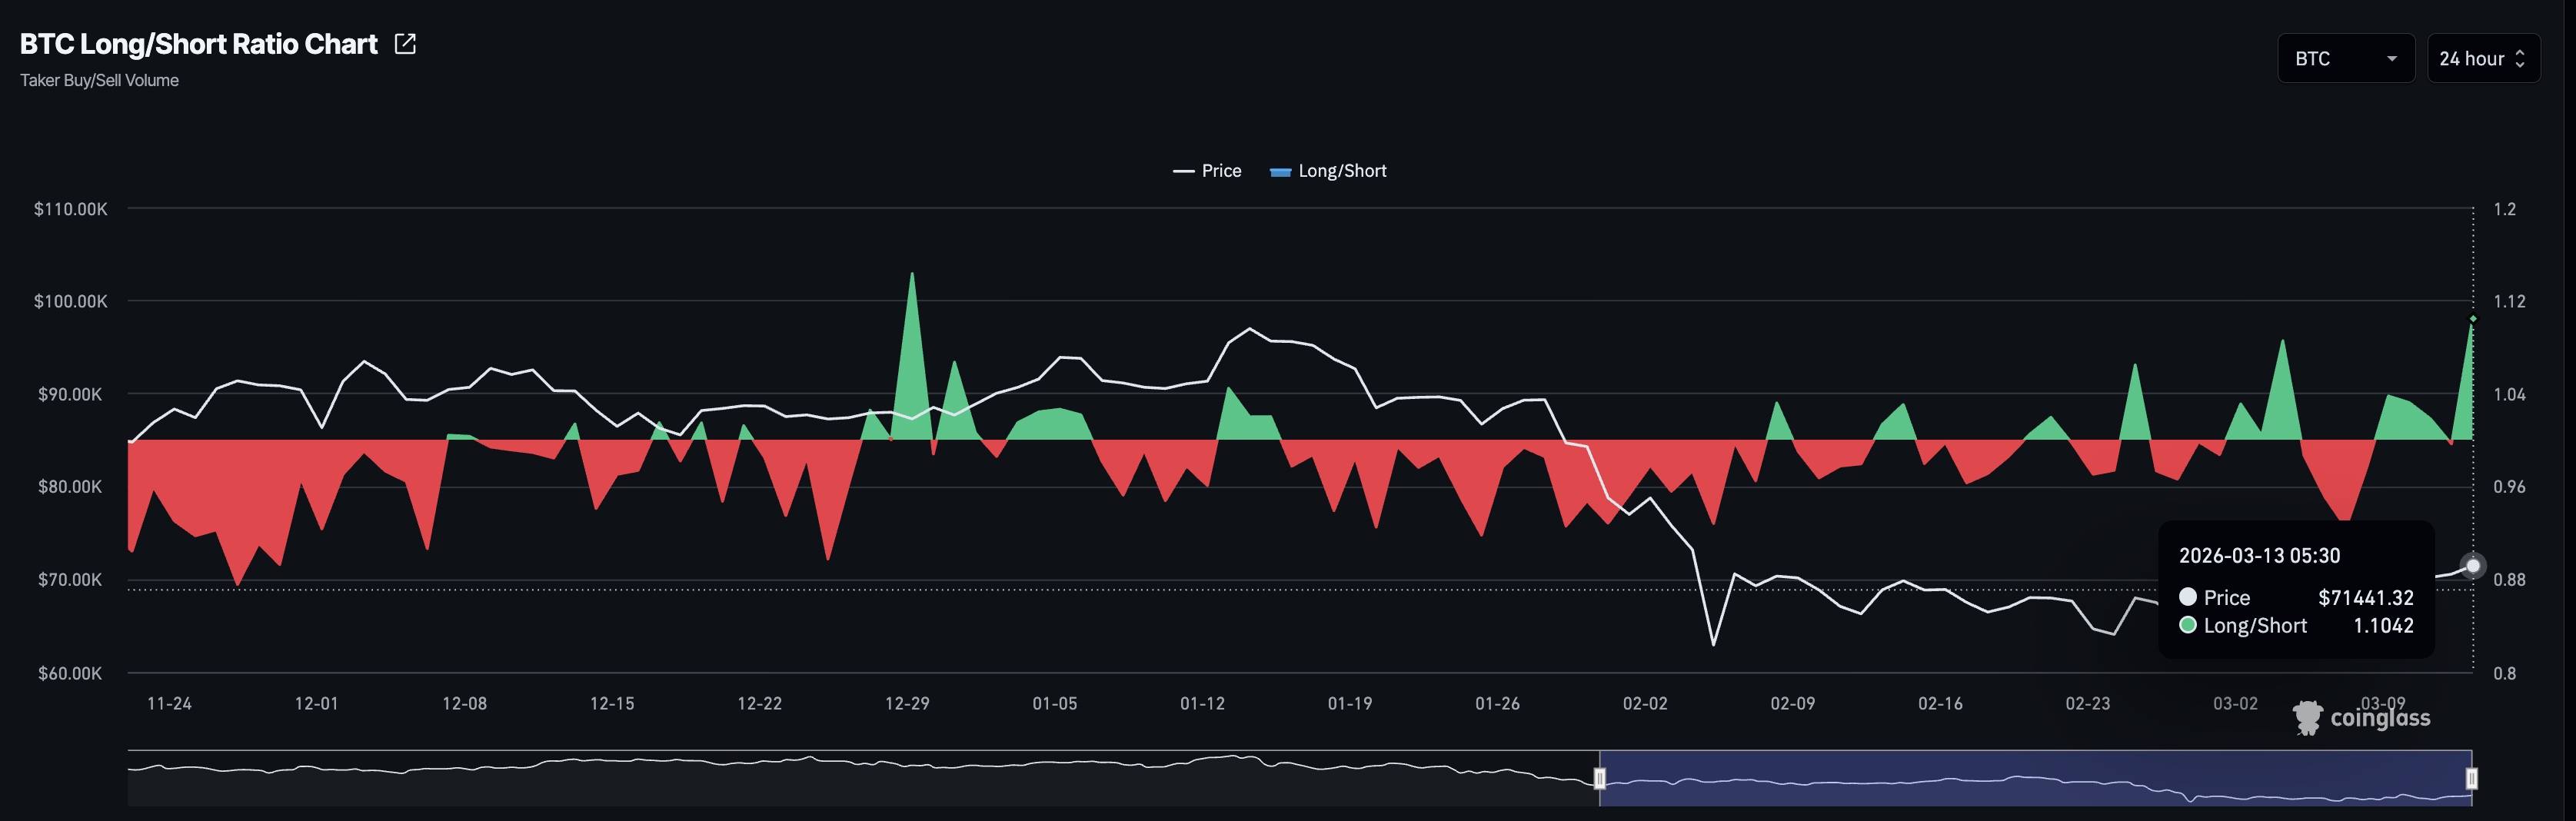
Typically, an increase in OI and higher funding rates suggest a bullish market trend. The Bitcoin long-to-short ratio at 1.1042, the highest since January 29, shows a greater number of active long positions, confirming the bullish bias.
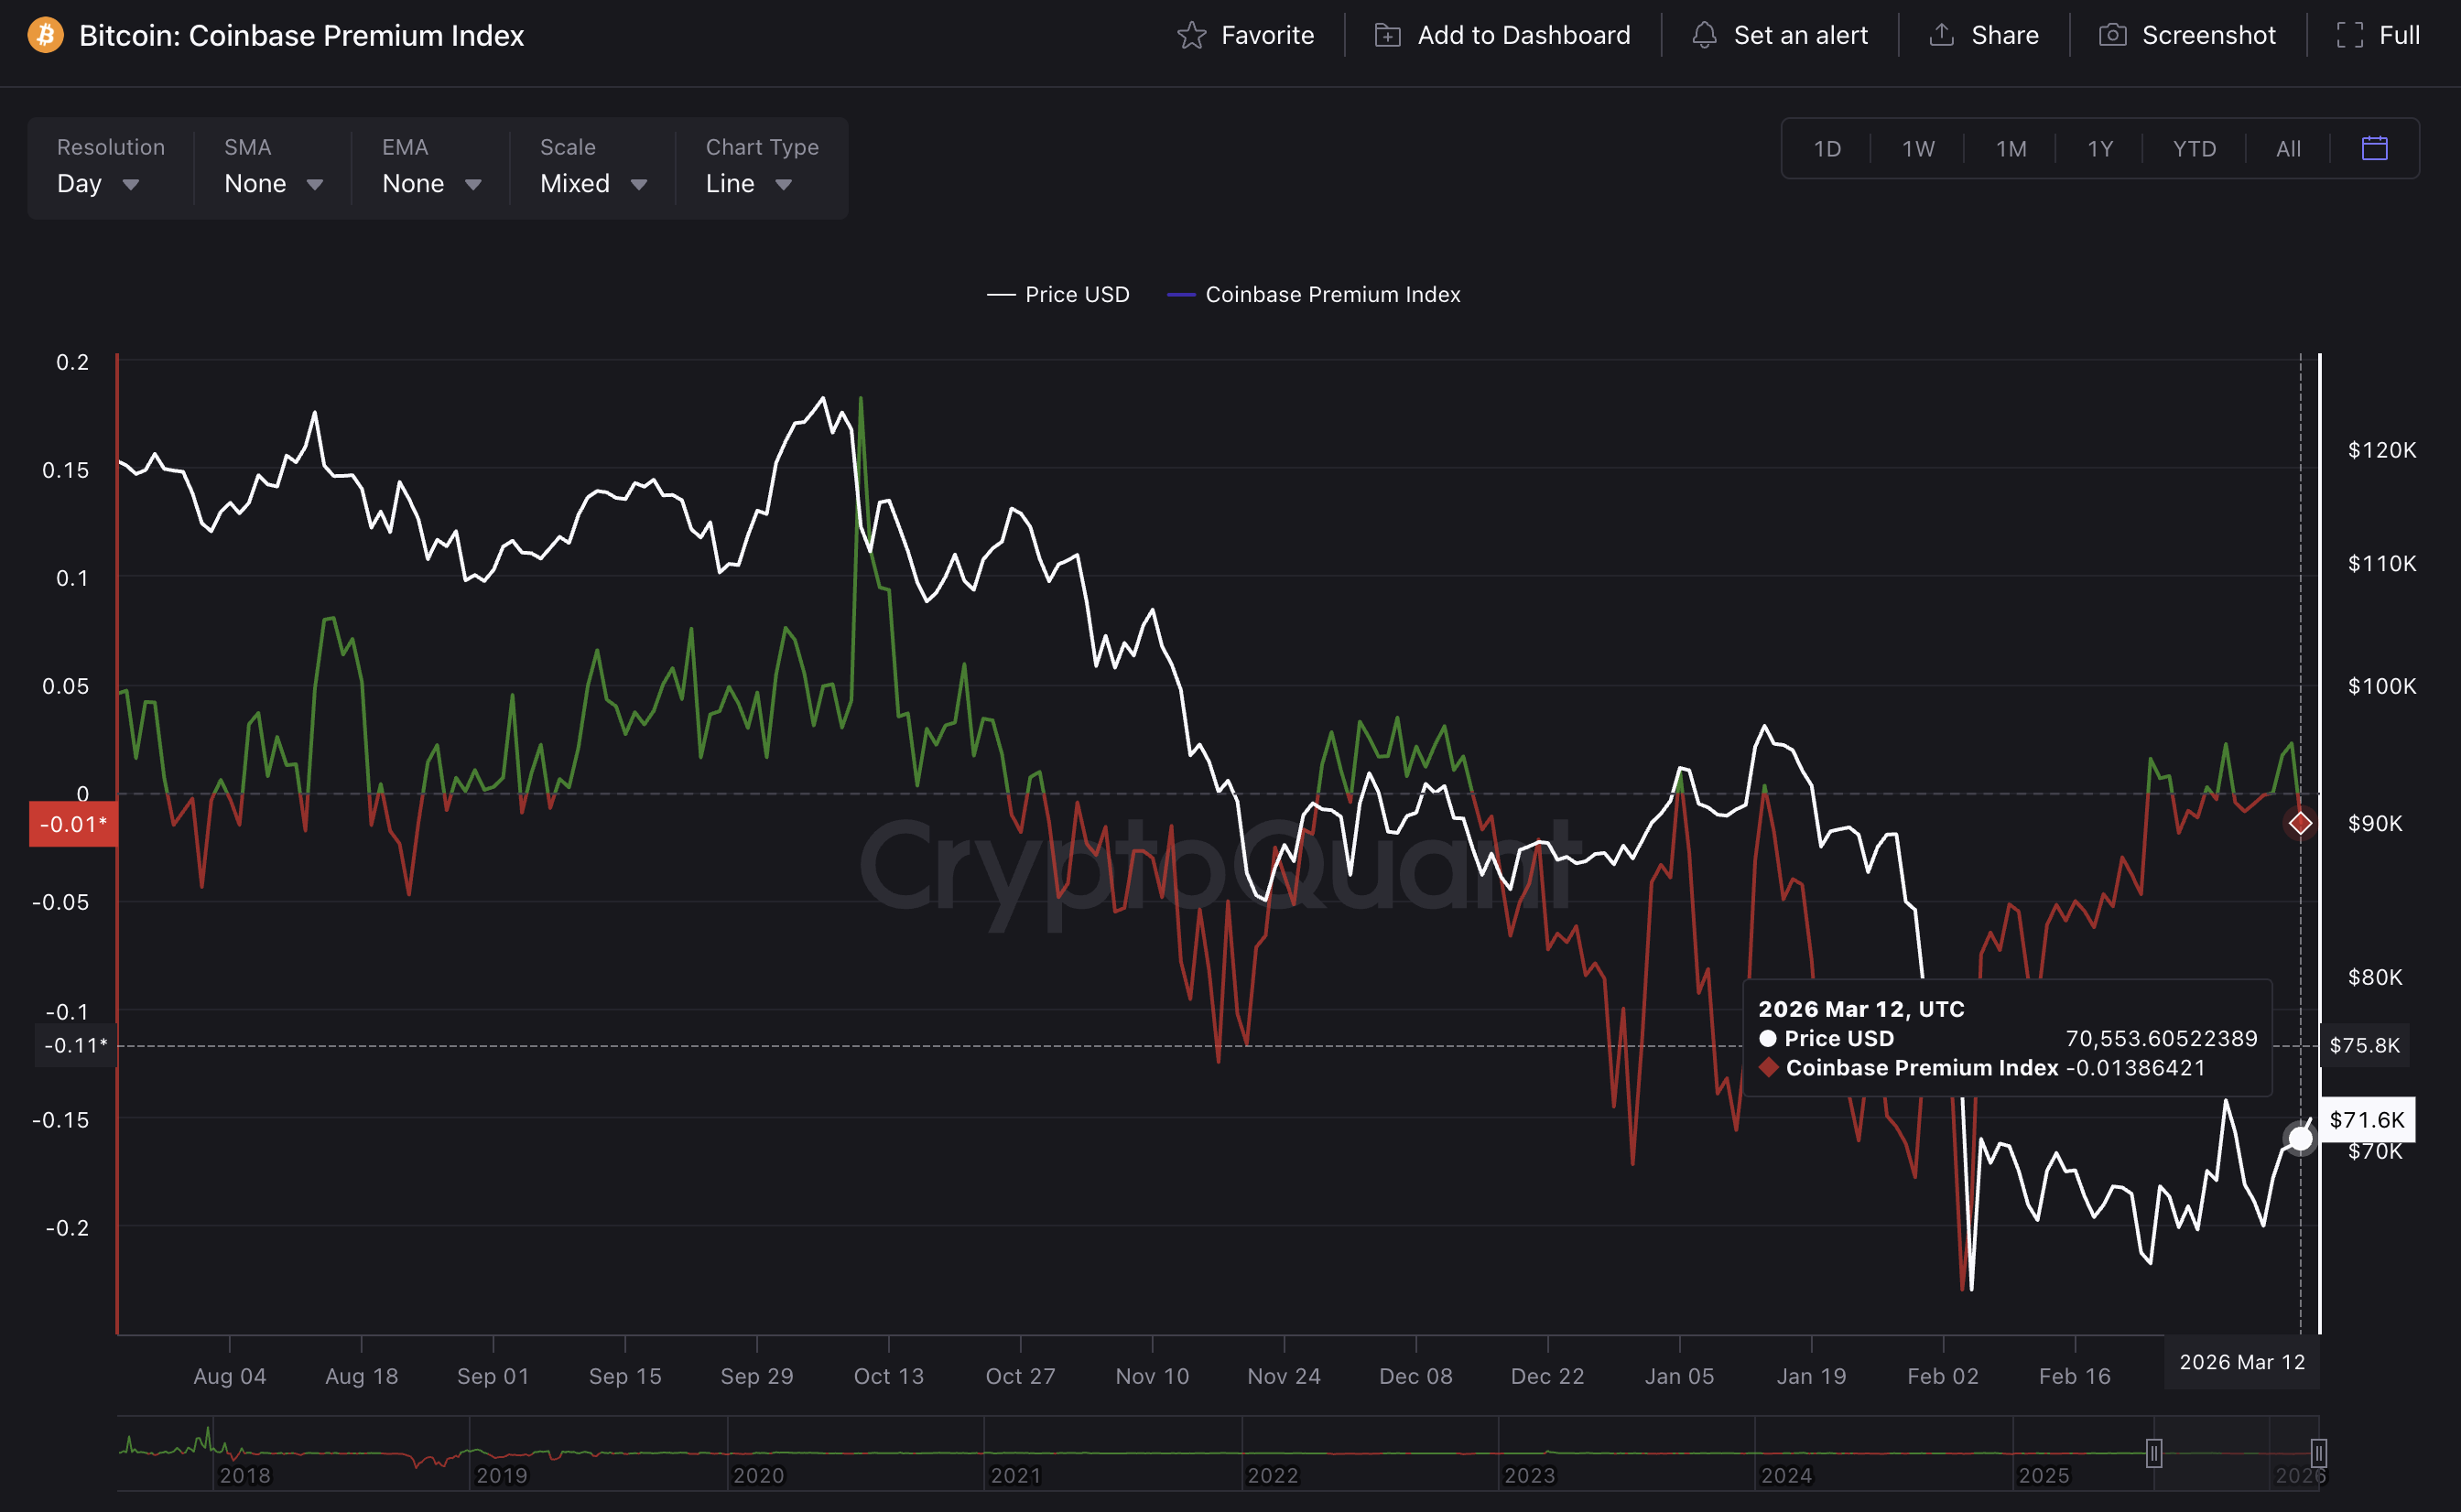
The US market has regained its interest in Bitcoin, while the Korean market struggles. CryptoQuant data shows that the Coinbase Premium Index is at -0.013, but has fluctuated above 0 over the last week and is up from -0.18 in early February, maintaining a broadly recovering trend over the last month.
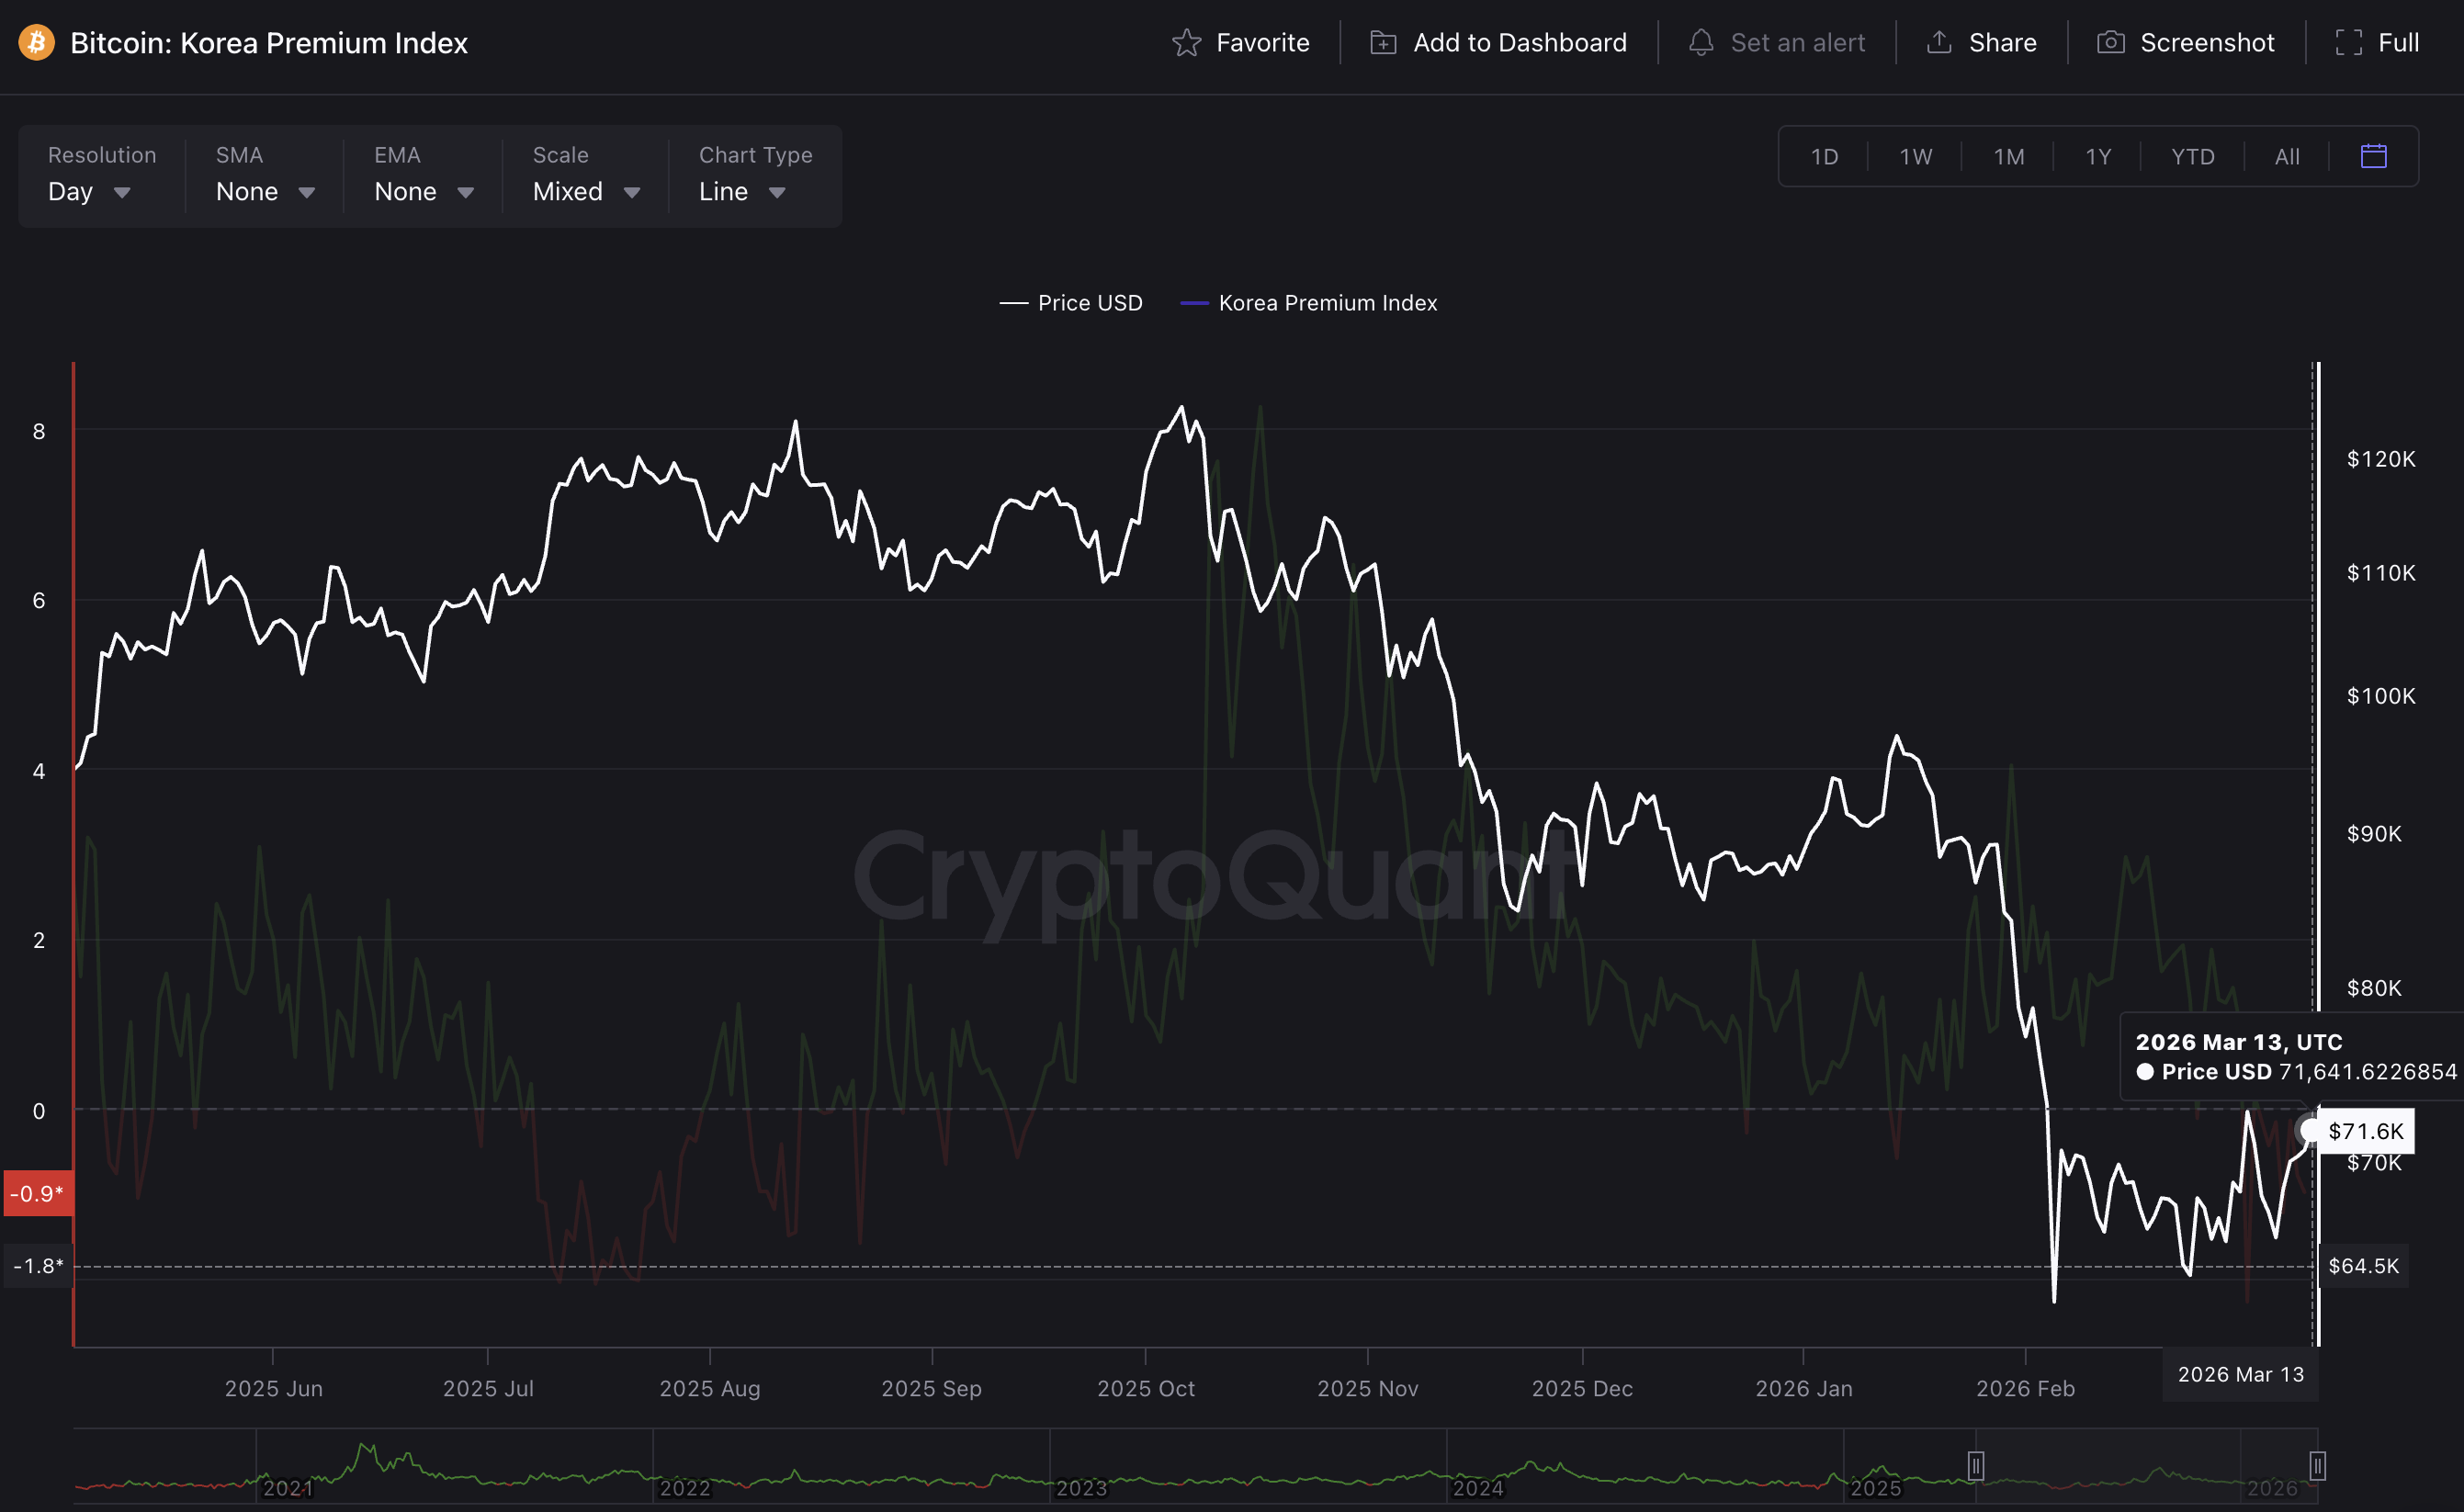
However, the Korea Index is at -0.98 and continues to decline, contrary to Coinbase's demand trend. The lack of demand in Asia aligns with volatile oil prices, fueling inflation risk and negatively impacting Asian stock markets.
Top crypto gainers: Pi Network, River, Midnight extend recovery
Pi Network is up 6% at press time on Friday, extending gains after its listing on the Kraken exchange the previous day. The 200-day Exponential Moving Average (EMA) at $0.2841 serves as initial resistance; a daily close above it would open the way toward the $0.984 area as the next bullish target.
The Moving Average Convergence Divergence (MACD) line is above its signal line and the zero line, with an expanding positive histogram, signaling strengthening upside momentum. The Relative Strength Index (RSI) at 79 remains in overbought territory, suggesting the upside could become stretched even as buyers maintain control in the short term.
Looking down, the breakout zone near the previous swing high of $0.2396 from Saturday could act as a resistance-turned-support level.
Meanwhile, River trades above $118 at press time on Friday, following a 28% surge the previous day. The near-term bias is mildly bullish as price holds above the 100-day EMA near $15.55 while grinding along the rising 50-day average around $16.34, indicating underlying trend support after the recent rebound.
On the topside, immediate resistance is located at the 50% retracement level at $25.22, measured from the January 26 high of $87.59 to the February 18 low of $7.26.
The MACD line is above its signal line and in positive territory, with a still-positive histogram, suggesting buyers retain momentum despite the recent pullback from the $18.70 area. The RSI at 56 remains above the midline, reinforcing a modest upside bias rather than exhaustion at current levels.
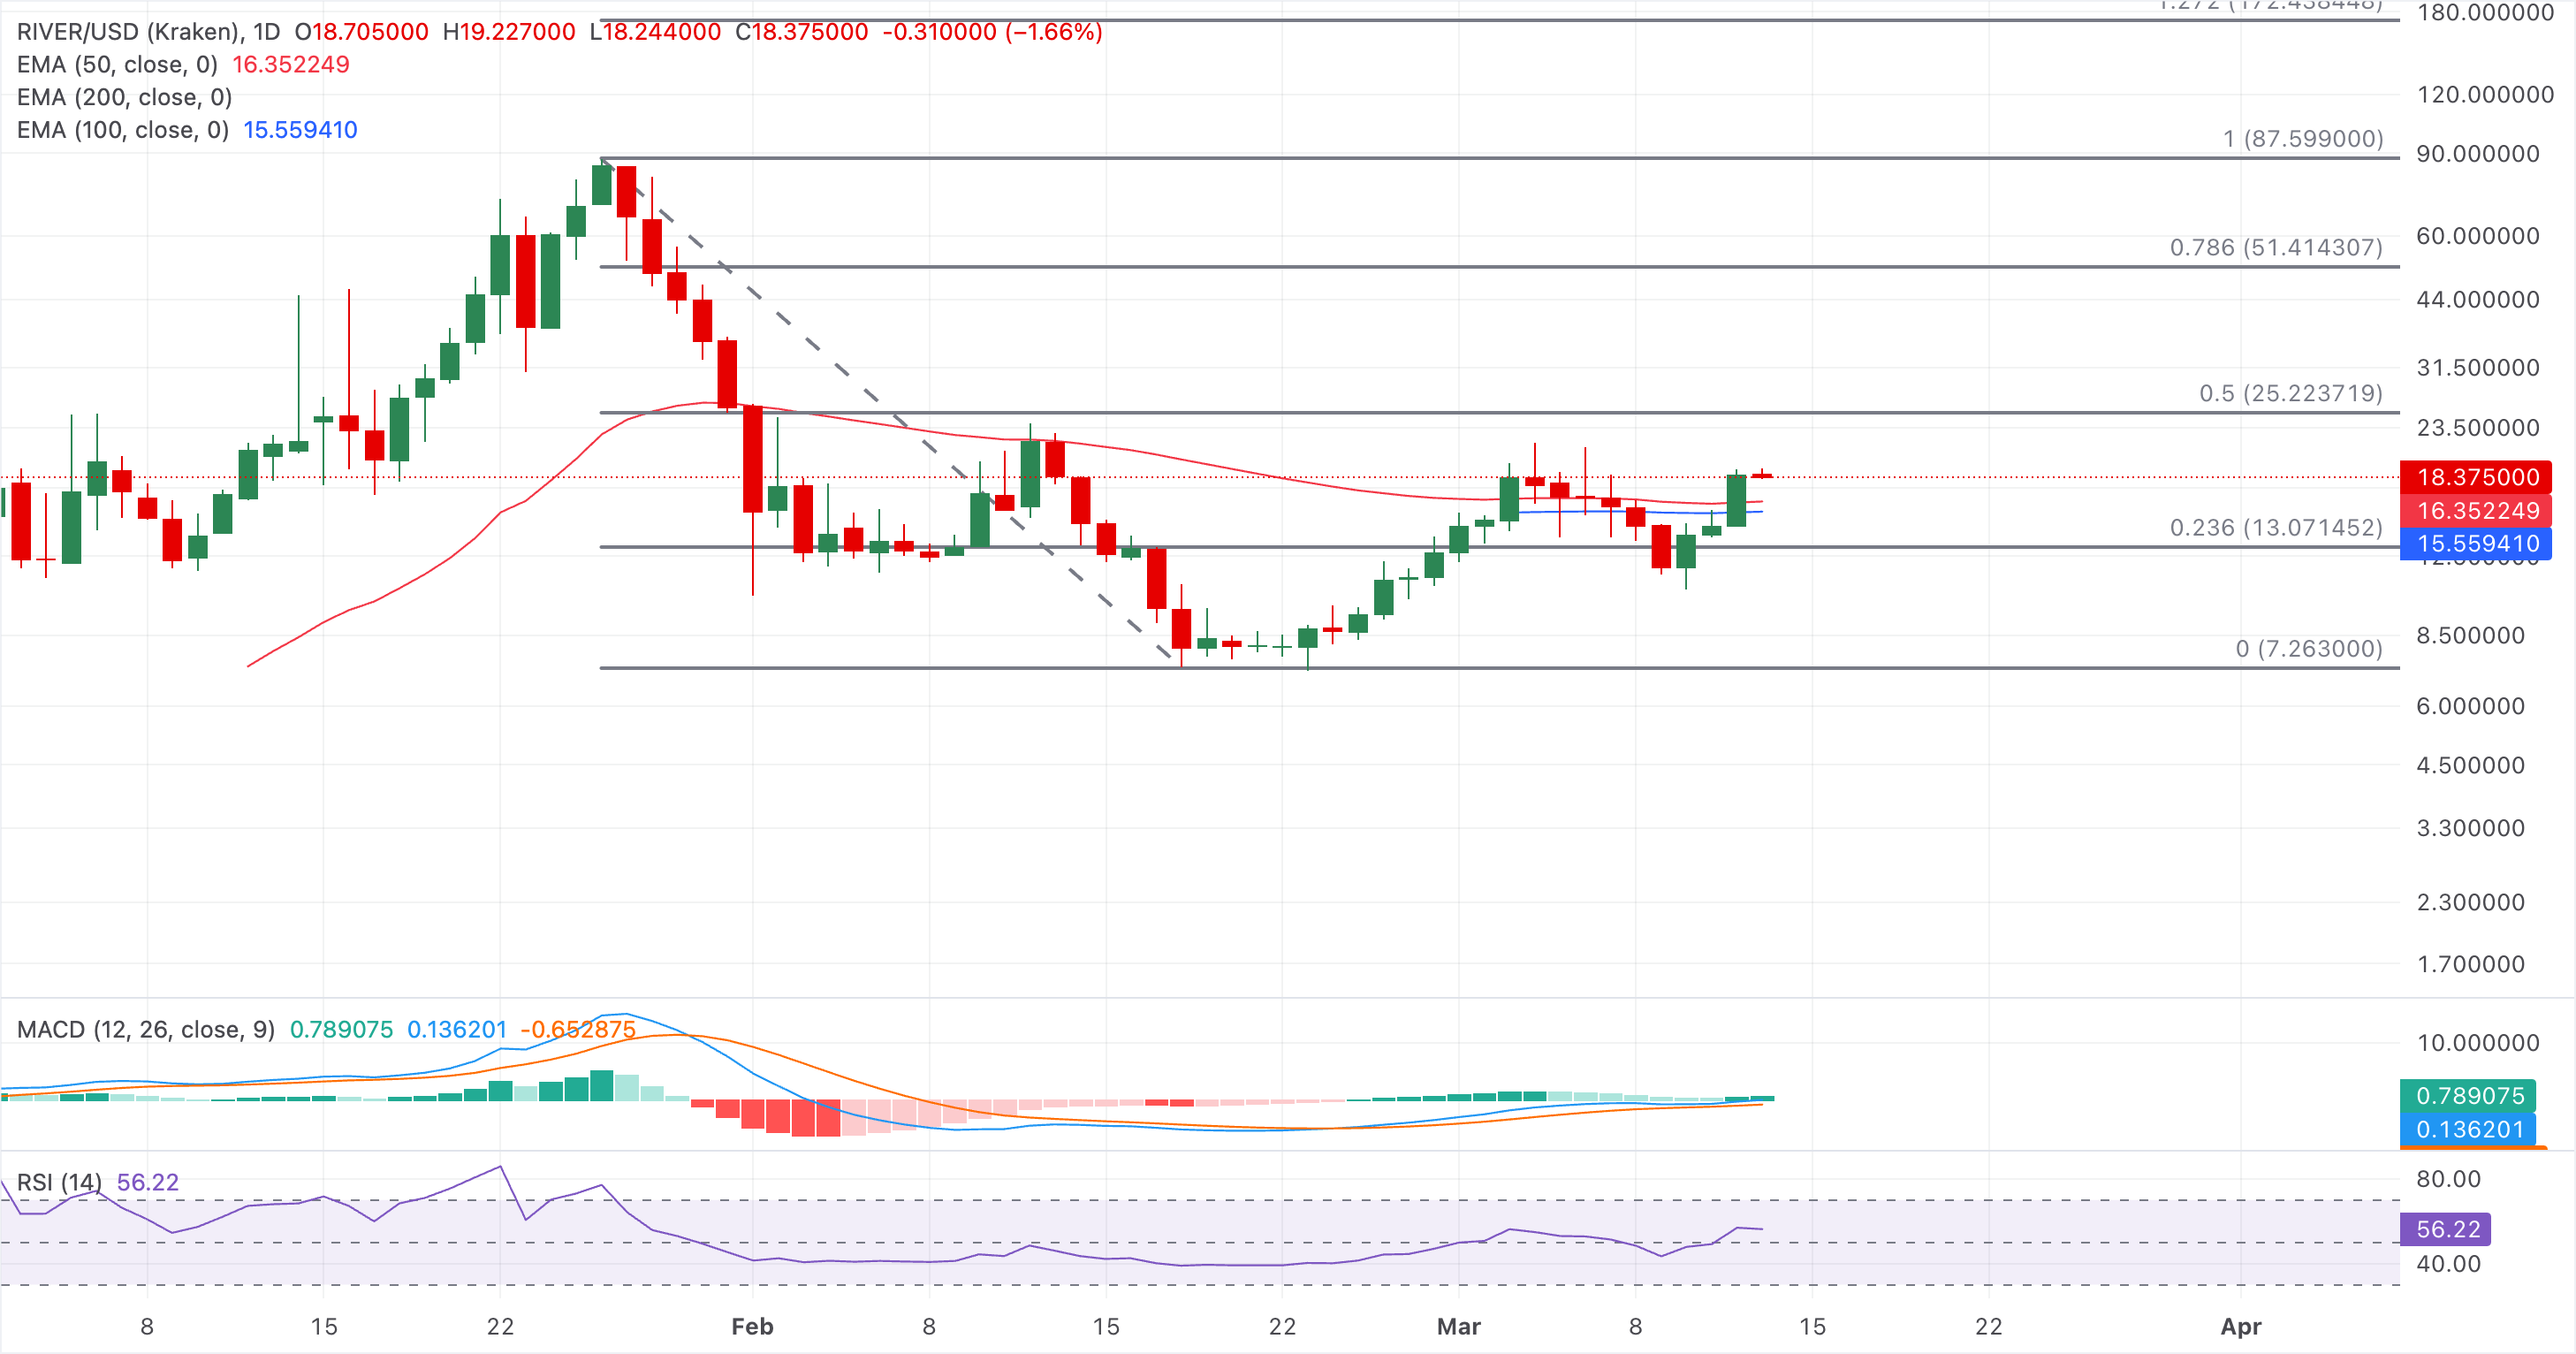
Initial support appears at the 50-day EMA around $16.35, followed by the 100-day EMA at $15.55, where a cluster of dynamic support would need to hold to preserve the current bullish structure.
On the other hand, Cardano’s privacy extension blockchain is up more than 6% at the time of writing on Friday, extending Thursday’s rebound, which capped the downside below $0.04800.
The near-term bias is mildly bearish as price holds well below the declining 50-day EMA near $0.05929, underscoring a loss of upside traction after the earlier consolidation.
The MACD line has slipped below its signal line and hovers near the zero line, with a shallow negative histogram, suggesting soft, not aggressive, selling pressure. The RSI at 43 remains below the 50 midline yet away from oversold territory, reinforcing a bias for a grinding downside rather than capitulation.
Immediate resistance aligns with the 23.6% Fibonacci retracement at $0.05343, measured from the December 21 high of $0.1198 to the February 6 low of $0.04163. A daily close above this cap would ease bearish pressure and open room toward the 78.6% Fibonacci retracement at $0.9564, as the next upside objective.
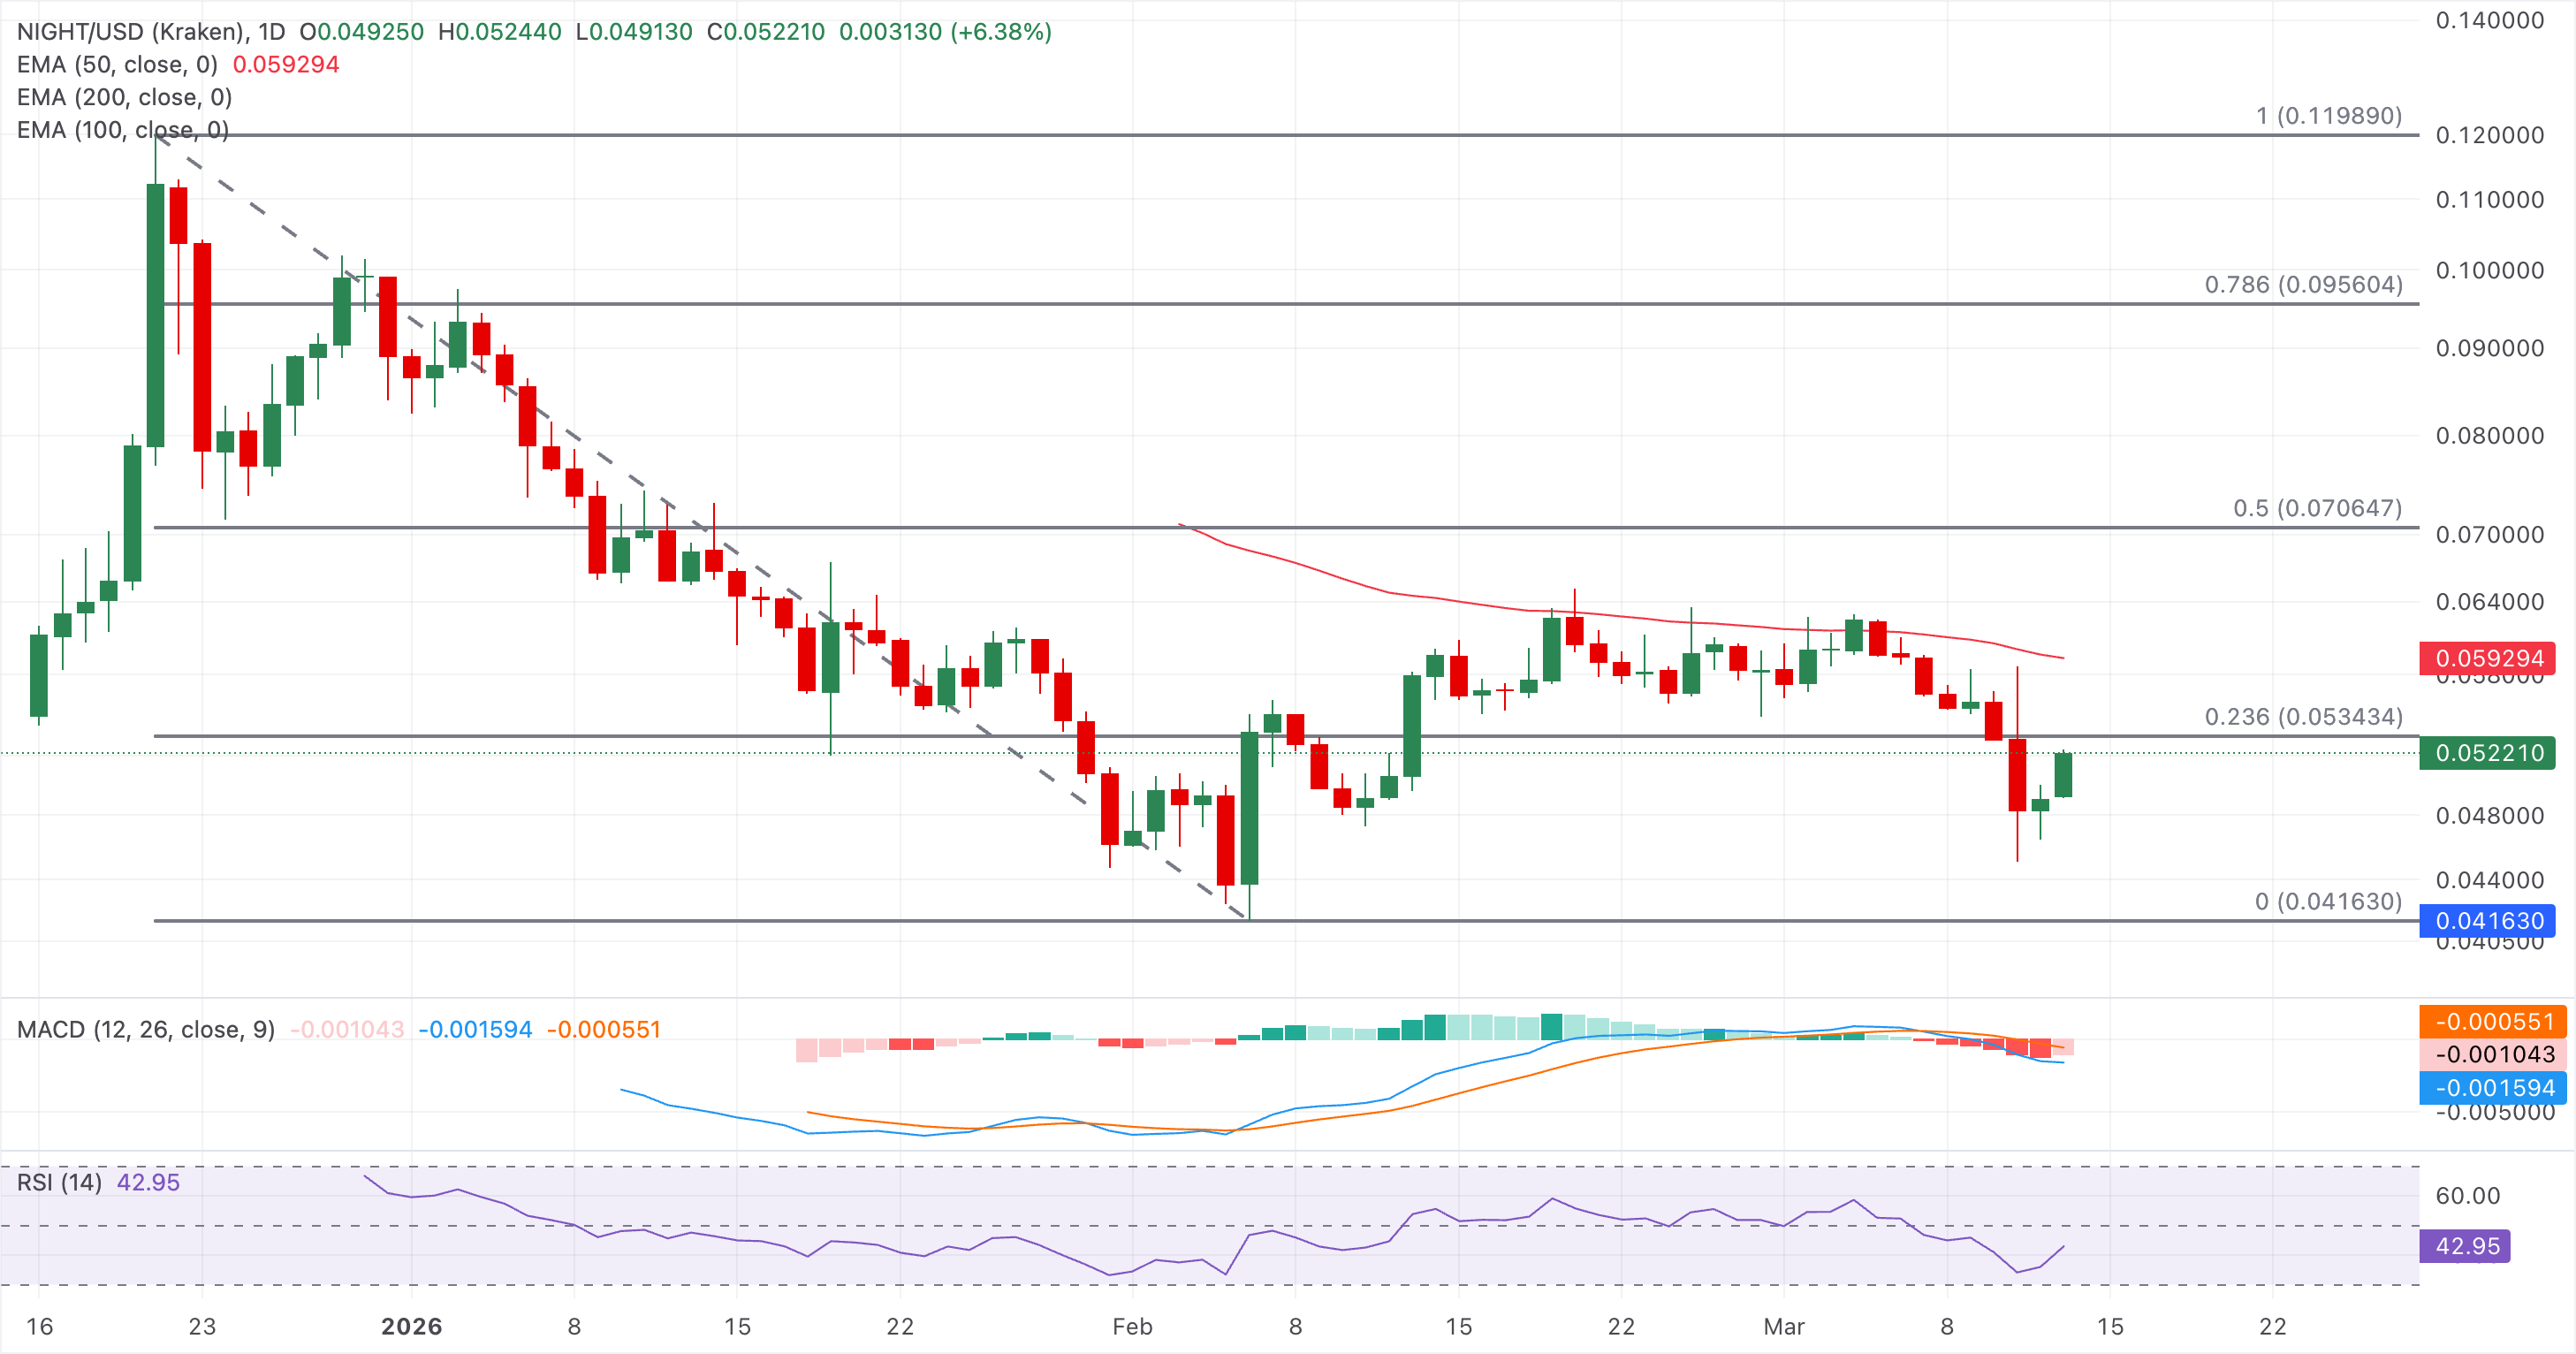
On the downside, the recent swing low at $0.04830 acts as initial support, with a break exposing the broader $0.04163 region, where the Fibonacci base of the prior advance sits as a critical line protecting the larger uptrend structure.
(The technical analysis of this story was written with the help of an AI tool.)
Artigos Recomendados


