

Bridged DOT token on Ethereum hacked, Polkadot’s native token exteds decline

Fonte Fxstreet
  • DOT extends its losses for the third consecutive day as buying pressure wanes, risking a break below $1.00.
  • Bridged DOT token on Ethereum drops near zero after an attacker took admin control to mint and dump fake 1 billion tokens.
  • Polkadot’s native token, DOT, remains safe but continues to decline. 

Polkadot (DOT) is down roughly 4% at press time on Monday, marking a bearish start to the week. The bridged DOT token on the Ethereum blockchain was reportedly compromised in an admin-change attack, resulting in the creation of more than 1 billion fake DOT tokens. Meanwhile, Polkadot's native token remains safe but continues to decline. Technically, the declining trend in DOT is at risk of breaking below $1.00.

Fake DOT tokens sold on Ethereum

0xZilayo, an on-chain analyst on X, first reported the hack of the bridged DOT pair on the Ethereum blockchain on Monday. The analysis shows that the attacker targeted the HandlerV1 contract with a forged cross-chain message using Hyperbridge’s Interoperable State Machine Protocol (ISMP) to execute a “ChangeAssetAdmin” request, which replaced the admin contract with the attacker's contract.

Bypassing security and gaining admin controls enabled the attacker to mint 1 billion bridged DOT tokens, which were then transferred to Uniswap and swapped for 108.2 ETH.

The hack significantly increased the maximum supply of wrapped DOT tokens on Ethereum and dropped the market price to zero, from $1.22 before the attack. A broader market effect remains minimal while the DOT token maintains its prevailing downward trend.
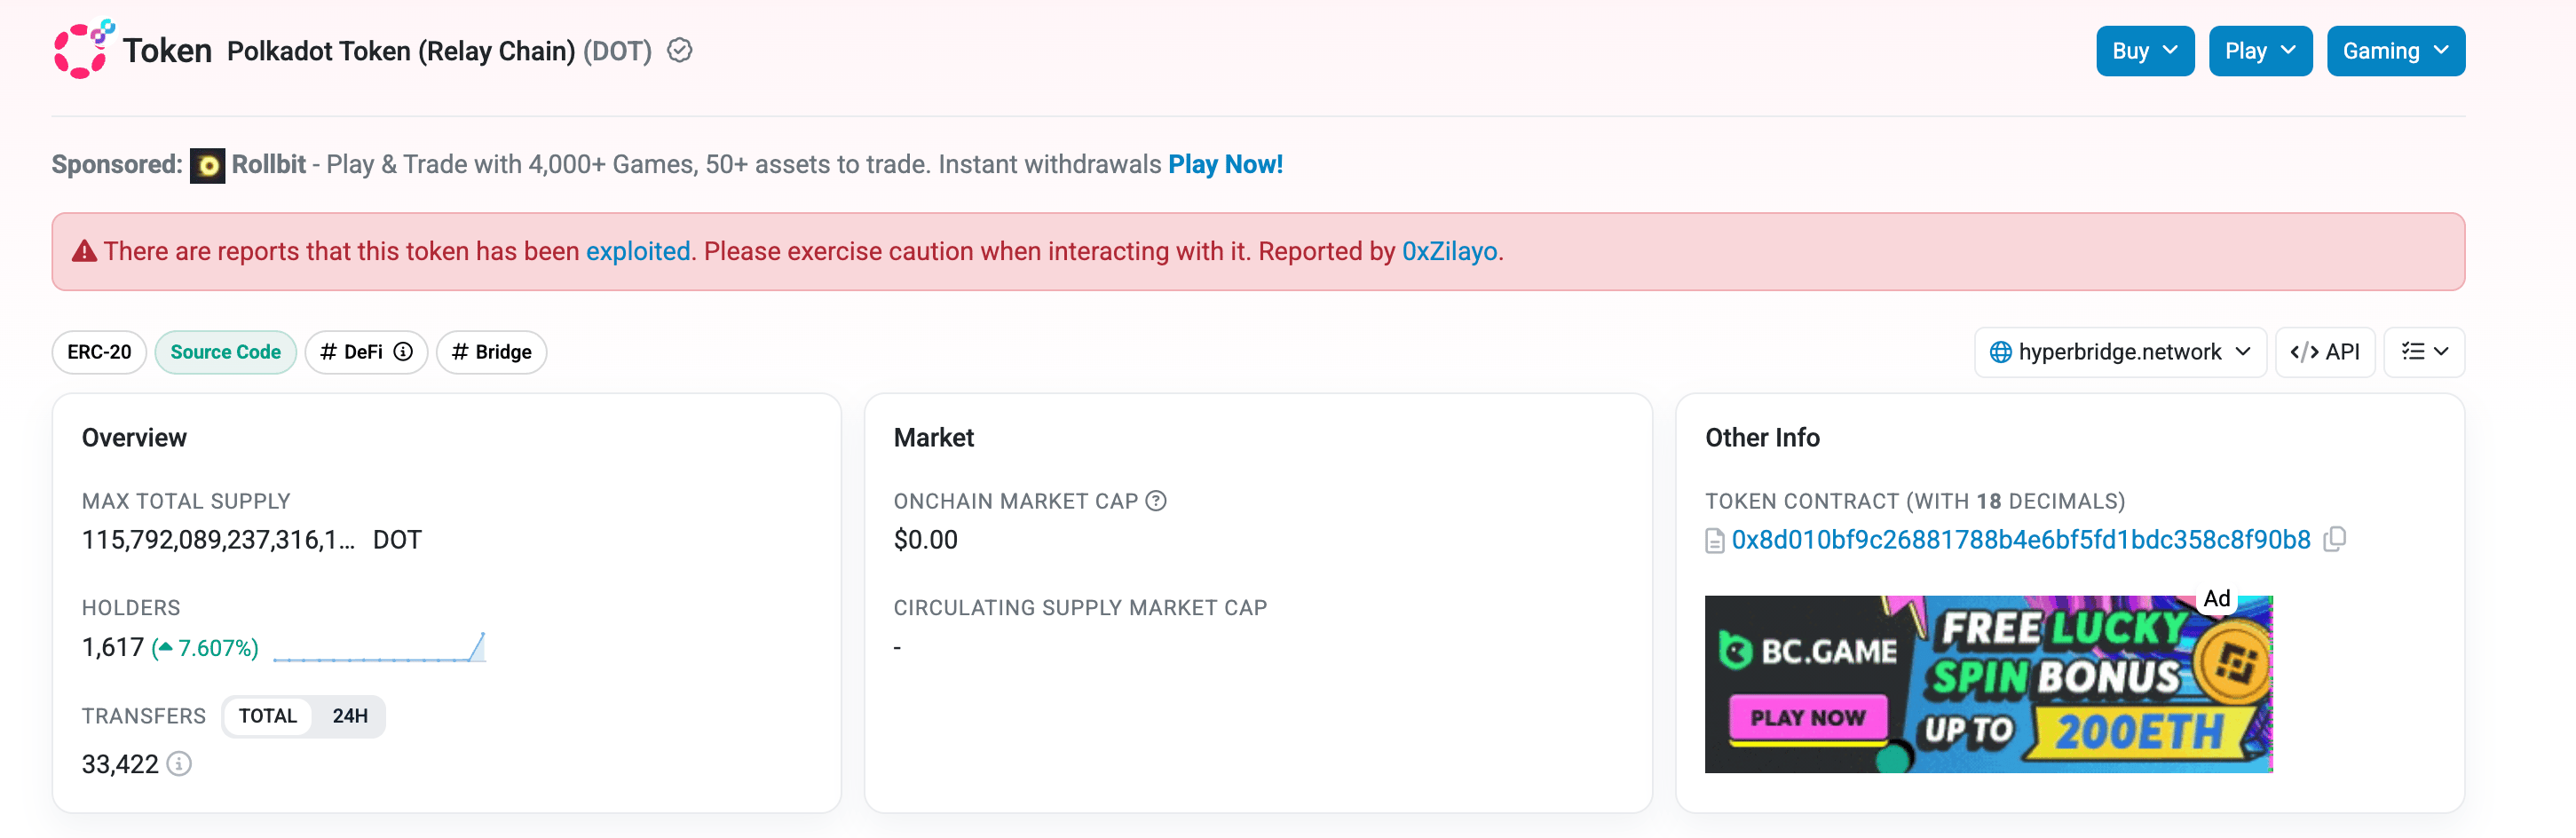
Polkadot relay chain on Ethereum data. Source: Etherscan

Technical outlook: Will DOT extend losses below $1?

Polkadot keeps a clear bearish near-term bias as DOT holds well beneath the 50-day Exponential Moving Average (EMA) at $1.3861 and the longer-term 100-day and 200-day EMAs at $1.5996 and $2.1153, respectively.

The Moving Average Convergence Divergence (MACD) histogram green bars are contracting, with the MACD line pointing to cross below the signal line, which would give a sell signal, while the Relative Strength Index (RSI) is pointing lower near 34 , reflecting increasing bearish momentum.

The path of least resistance for DOT is to the downside, targeting the February 6 low at $1.1020, near the S1 Pivot Point at $1.089. A drop below this zone could drop Polkadot spot below $1, targeting the S2 Pivot Point at $0.9250.

Chart Analysis DOT/USDT (Binance)
DOT/USDT daily price chart.

On the topside, initial resistance is located at the support-turned-resistance level at $1.2320, marked by the February 5 low, where any rebound would likely face its first serious test. A break above that barrier would then expose the 50-day EMA near $1.39.

(The technical analysis of this story was written with the help of an AI tool.)

Isenção de responsabilidade: Apenas para fins informativos. O desempenho passado não é indicativo de resultados futuros.
placeholder
HGLG11 projeta alta na vacância para 2026; RZAK11 paga yield de 1,35% e RZAT11 reduz dividendoO fundo imobiliário CSHG Logística (HGLG11) divulgou seu relatório gerencial referente ao mês de outubro, informando um resultado distribuível de R$ 32,246 milhões. O montante representa um recuo em relação ao desempenho de setembro, quando o fundo havia registrado R$ 36,939 milhões.
Autor  Pedro Augusto Prazeres
20 nov. 2025
O fundo imobiliário CSHG Logística (HGLG11) divulgou seu relatório gerencial referente ao mês de outubro, informando um resultado distribuível de R$ 32,246 milhões. O montante representa um recuo em relação ao desempenho de setembro, quando o fundo havia registrado R$ 36,939 milhões.
placeholder
USD/JPY segue perto de 159,00 e testa topo do canal descendenteO USD/JPY segue perto de 159,00 e testa o topo do canal descendente, mantendo viés de alta enquanto permanecer acima do suporte de 158,51.
Autor  FXStreet
5 Mês 21 Dia Qui
O USD/JPY segue perto de 159,00 e testa o topo do canal descendente, mantendo viés de alta enquanto permanecer acima do suporte de 158,51.
placeholder
Prata recua abaixo de US$ 74 com alerta de bancos sobre pico da demanda industrialA prata segue abaixo de US$ 74 pressionada pela desaceleração da demanda industrial, redução do uso de prata no setor solar, queda nas posições em ETFs e incertezas sobre juros do Fed.
Autor  TradingKey
5 Mês 28 Dia Qui
A prata segue abaixo de US$ 74 pressionada pela desaceleração da demanda industrial, redução do uso de prata no setor solar, queda nas posições em ETFs e incertezas sobre juros do Fed.
placeholder
Ouro cai abaixo de US$ 4.400; suporte em US$ 4.360 pode definir reação do XAU/USDO ouro caiu abaixo de US$ 4.400 após três sessões de forte queda, mas a aproximação do suporte-chave em US$ 4.360 pode abrir espaço para uma recuperação técnica no curto prazo.
Autor  TradingKey
5 Mês 28 Dia Qui
O ouro caiu abaixo de US$ 4.400 após três sessões de forte queda, mas a aproximação do suporte-chave em US$ 4.360 pode abrir espaço para uma recuperação técnica no curto prazo.
placeholder
Índice do dólar segue perto de 99,00 com otimismo sobre acordo EUA-Irã e PCE no radarO índice do dólar segue perto de 99,00 em meio ao otimismo sobre um acordo EUA-Irã e à queda do petróleo, enquanto investidores aguardam os dados de ISM PMI e NFP para definir a próxima direção.
Autor  FXStreet
5 Mês 29 Dia Sex
O índice do dólar segue perto de 99,00 em meio ao otimismo sobre um acordo EUA-Irã e à queda do petróleo, enquanto investidores aguardam os dados de ISM PMI e NFP para definir a próxima direção.
goTop
quote