

Bitcoin Weekly Forecast: No recovery in sight
- Bitcoin price continues to trade sideways between $65,729 and $71,746, extending its consolidation since February 7.
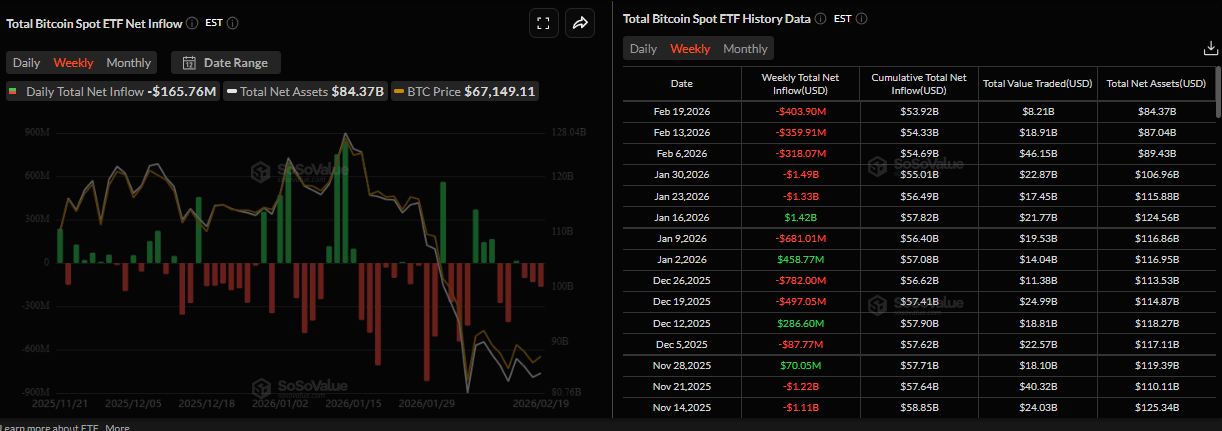
- US-spot ETFs record an outflow of $403.90 million through Thursday, pointing to the fifth consecutive week of withdrawals.
- A hawkish Fed, alongside rising US-Iran geopolitical tensions, adds pressure on BTC.
Bitcoin (BTC) price continues to trade within a range-bound zone, hovering around $67,000 at the time of writing on Friday, and falling slightly so far this week, with no signs of recovery. The ongoing price action heightens the risk of a breakdown as institutional demand continues to weaken, pointing to a fifth consecutive week of withdrawals from spot BTC Exchange Traded Funds (ETFs). In addition, hawkish Federal Open Market Committee (FOMC) Minutes, alongside rising geopolitical tensions between the US and Iran, are further pressuring the largest cryptocurrency by market capitalization.
Fading institutional demand
Institutional outflows persist this week. According to SoSoValue data, spot Bitcoin ETFs have recorded an outflow of $403.90 million through Thursday. If this trend continues through Friday, it will be the fifth straight week of outflows. A similar trend was seen from mid-February to mid-March, where BTC crashed from $100,000 to roughly $80,000. If this trend continues, BTC could see further correction in the upcoming weeks.
However, on the corporate front, Michael Saylor announced on X on Tuesday that Strategy (MSTR) purchased 2,486 BTC, following the purchase of 1,142 BTC in the previous week. Tuesday’s purchase brings the firm’s total holdings to 717,131 BTC, highlighting the firm’s continued aggressive accumulation strategy and long-term conviction in Bitcoin, despite ongoing market weakness, with an average purchase price of $76,027
Fed's hawkish tone sparks risk-off sentiment
The Minutes from the Federal Open Market Committee (FOMC) January meeting showed on Wednesday that policymakers were deeply divided over the necessity and timing of further rate cuts amid concerns about inflation.
In fact, several Federal Reserve (Fed) officials indicated that more rate cuts could be warranted if inflation declines as expected, while others cautioned that easing too early could compromise the central bank’s 2% inflation target.
The cautiously balanced stance, rather than dovish, continues to support the US Dollar (USD), with the US Dollar Index (DXY) trading near two-week high around 98.00 as of Friday. The less dovish FOMC Minutes dampened risk appetite, pressuring risky assets, with Bitcoin (BTC) dropping toward the lower consolidating support at $65,700 before rebounding slightly on Friday.
Geopolitical tensions put the lid on BTC
Apart from a hawkish tilt by the US central bank, the US military is ready for possible strikes on Iran as soon as Saturday, CBS reported on Wednesday.
Later on Thursday, the news came in that the US President Donald Trump said that Iran must make a deal, or “bad things will happen,” with the threat of military strikes still hanging heavy over delicate nuclear negotiations.
Iran told UN Secretary-General Antonio Guterres that it does not seek war but will not tolerate military aggression. Iranian officials also warned of a decisive response if attacked as Trump weighs military options over the nuclear dispute.
Meanwhile, sources said that the USS Abraham Lincoln aircraft carrier group and its flotilla of warships are already in the region. The USS Gerald Ford, a second carrier group, is en route to the Middle East.
Adding to these rising tensions, the third round of US-mediated negotiations between Ukraine and Russia concluded in Geneva on Wednesday without any major breakthrough. This underscores that substantive disagreements remain over the status of eastern Ukrainian territories occupied by Russian forces.
These rising geopolitical risks, in combination with tighter monetary policy expectations, are driving a risk-off tone in markets, with safe-haven assets such as Gold (XAU) rising above $5,000. In contrast, risky assets such as BTC show no signs of recovery.
BTC perpetual long traders are steadily exiting
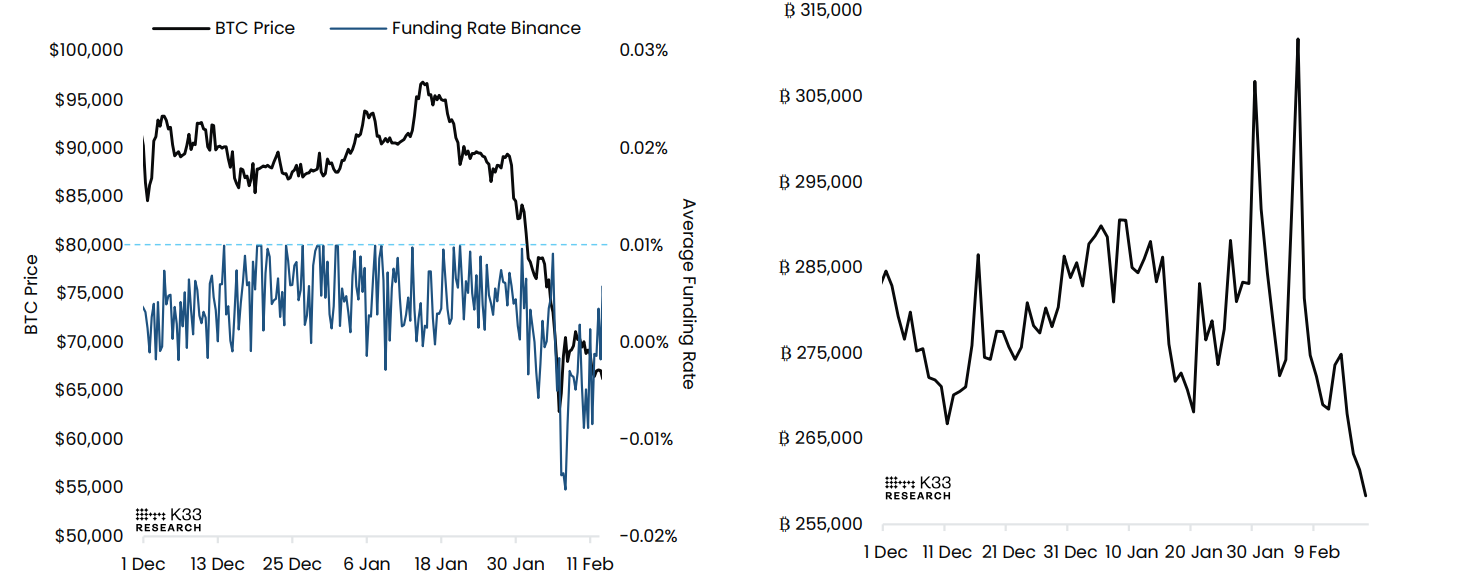
K33 Research’s report this week noted that sentiment remains highly defensive in the perpetual market. The chart below shows that the funding rate averaged -0.64% over the last seven days, marking the eleventh consecutive day of negative weekly funding rates. These negative levels mirror the duration of the negative funding rate cycle between April 28 and May 8 in 2025.
As funding remained muted, notional Open Interest (OI) continued to fall, dropping below 260,000 BTC for the first time since October 12 on Tuesday. These developments in the perpetual market signal that longs were steadily exiting during BTC’s slow consolidation, suggesting a low near-term risk of derivatives-driven squeezes.
In addition, Glassnode reported that the overall market conditions remain defensive across spot, derivatives, ETFs, and on-chain indicators.
The analyst concluded that, “While sell pressure appears to be moderating, participation and capital flows remain weak, leverage is still being reduced, and risk may be underpriced in options markets. A durable recovery still depends on renewed spot demand capable of sustaining price beyond the recent rebound zone.”
Weaker accumulation seen at $60,000
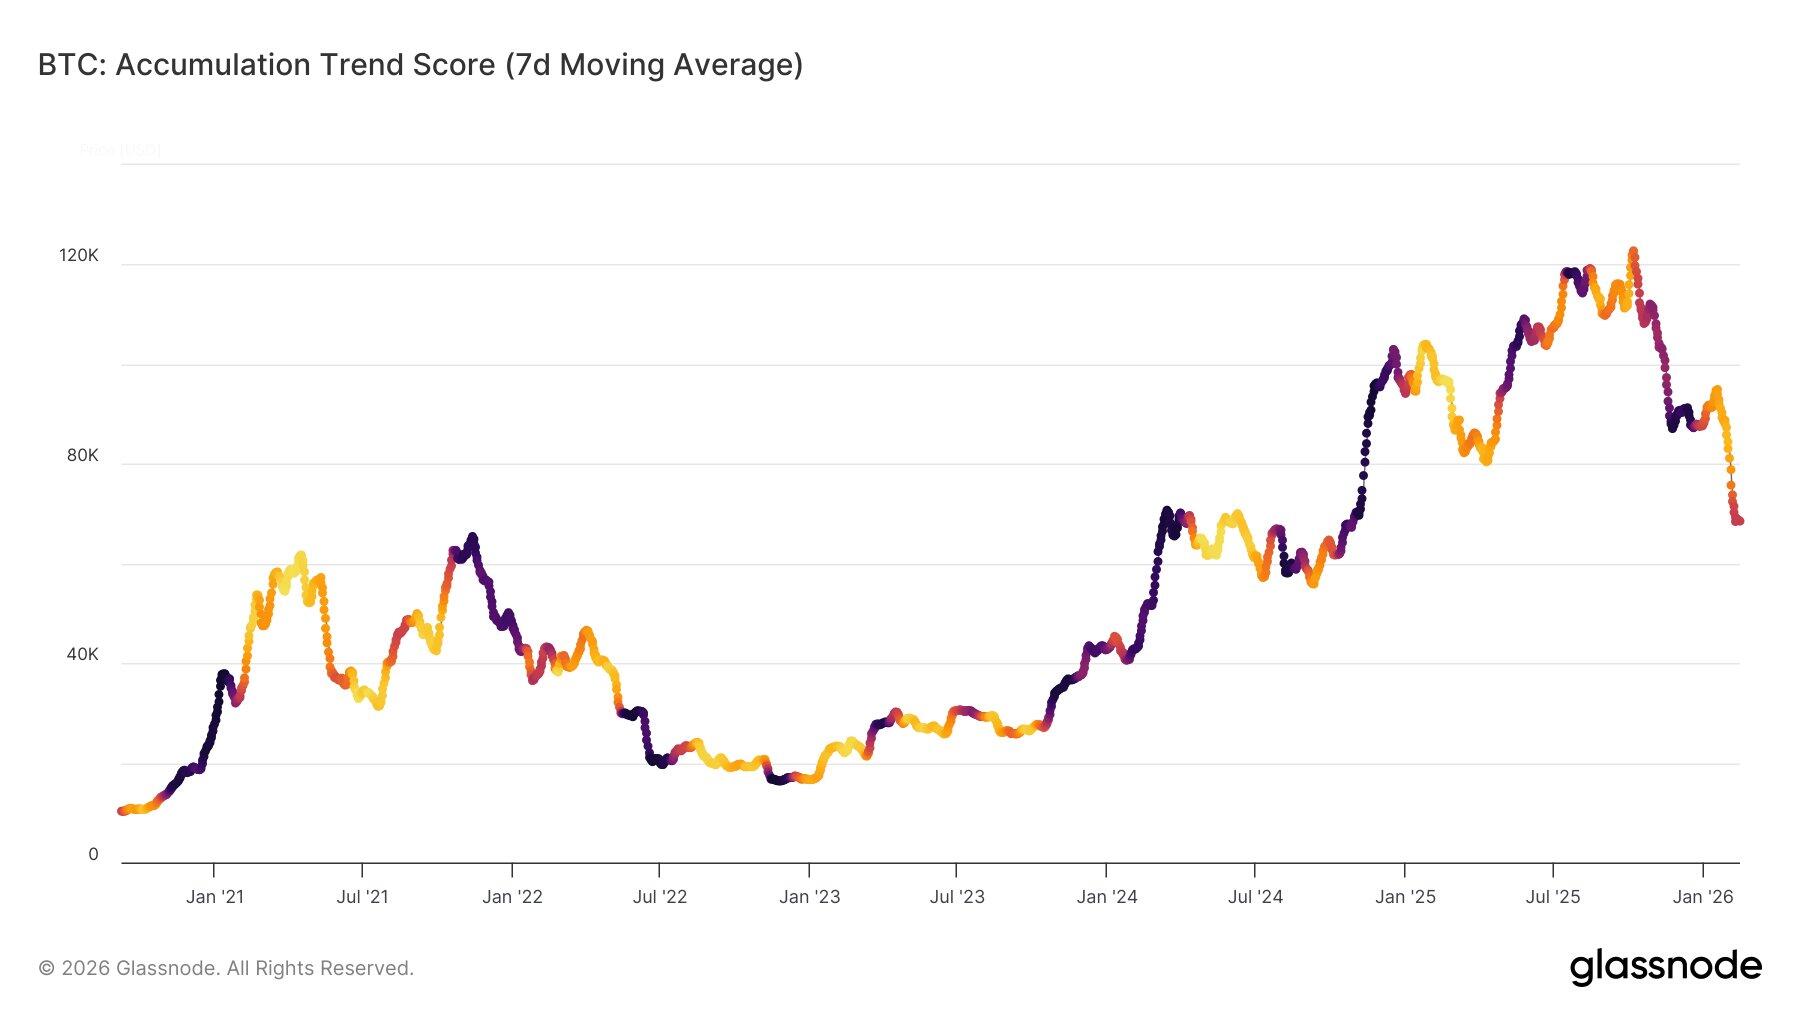
The Bitcoin accumulation trend score (7-day Moving Average) chart below shows that during the first down leg in November 2025, the market absorbed heavy selling pressure aggressively, similar to the post-LUNA & FTX crash responses in May and November 2022, respectively.
However, in the second leg, the recent drop to $60,000 on February 6 saw accumulation weaker than the strong, aggressive dip-buying that followed the LUNA crash. This indicates that current buying interest lacks the urgency and intensity seen during past major capitulation events, which could reinforce the current defensive, range-bound market structure.
Other signs of concern
Reuters Breakingviews reported on Friday that growing concerns about Tether’s financial risk profile persist despite its continued dominance in the stablecoin market. While USDT has grown and remains highly profitable, the company still does not publish full, independent audits of its reserves, as it is based in El Salvador, which is hardly known for its tough financial regulation.
The report noted that Tether’s equity cushion is shrinking. It declined from $7.1 billion to around $6.3 billion between the end of 2024 and the end of 2025, even as the volume of USDT outstanding surged. As a percentage ofassets, equity was 3.3% on December 31 last year, down from 4.9% a year earlier and 5.6% at the end of 2023.
“In other words, if Tether’s assets lose more than 3.3% of their value, it would no longer have sufficient reserves to redeem all the tokens at their dollar peg,” says Liam Proud.
At the same time, reserves are becoming riskier. Cash-like reserves, including repurchase agreements, bank deposits and US Treasury bills, were 76% of total assets in December 2025, compared with a recent historical range of around 80% to 85%.
The flipside is that riskier investments like Bitcoin, Gold and secured loans now make up 24% of the total, compared with around 15% to 20% previously. A simultaneous drop in Bitcoin and Gold, or losses on its $17 billion loan book, could pressure its capital buffer.
Although USDT remains stable and shows no immediate signs of strain, the report warns that any loss of confidence could have far-reaching consequences. As a core liquidity pillar of the crypto ecosystem, a disruption in USDT could destabilize trading markets. Even possible to imagine major exchanges like Binance helping to rescue it in a crisis, effectively making it too big to fail.
The report concluded that Tether remains resilient, but its growing size and thinner safety margin increase systemic risk if market conditions deteriorate.
The new crypto winter is still in play
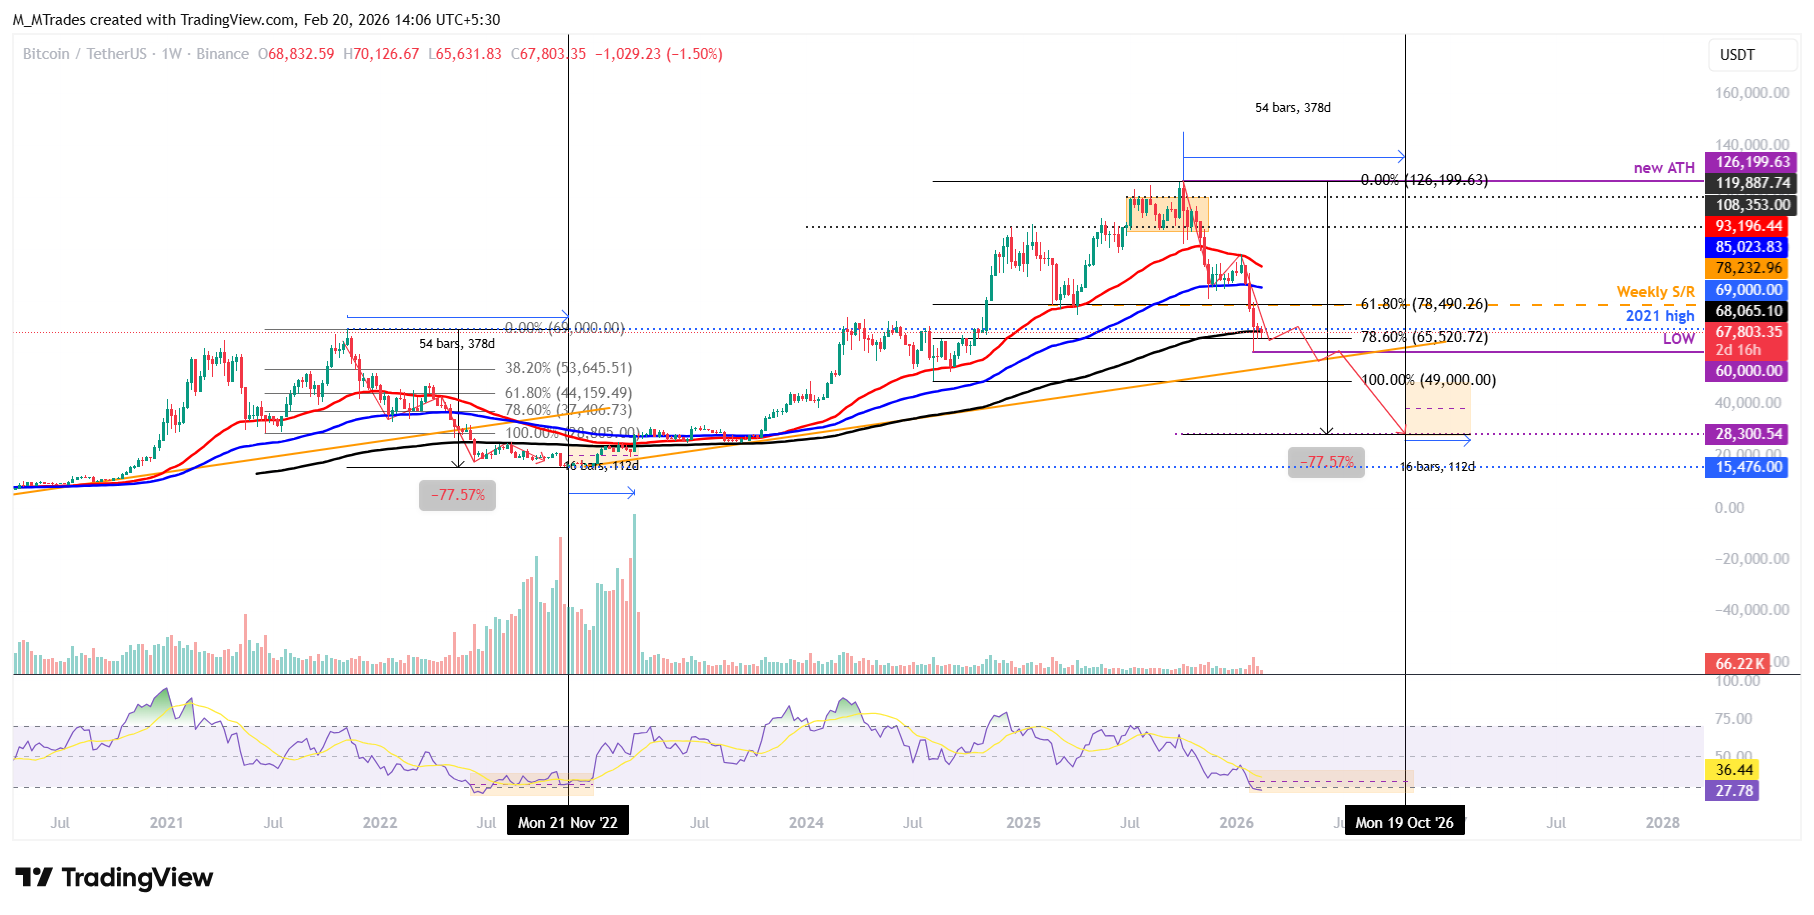
Bitcoin weekly chart shows price action resembling that of the late-2021-2022 bear market. In 2021, BTC hit a new all-time high (ATH) of $69,000 in November and corrected 77.57% from the high to the 2022 bottom of around $15,476 in November 2022 in 378 days. Then consolidated for the next 112 days, before the start of another bull cycle in 2023.
In the 2025-2026 period, BTC reached a new ATH at $126,199 in October 2025 and has since corrected by 47% through the third week of February, as of writing on Friday, slipping below the 200-week Exponential Moving Average at $68,065.
If the current regime follows the 2021-2022 pattern, BTC could see further correction, reaching a low of $28,300 (77.51% from the 2025 ATH) on October 19, 2026. Then consolidate for the next 112 days before the start of another bull cycle (similarly seen in 2023 as discussed above).
On the daily chart, the Crypto King has been consolidating within a range between $65,729 and $71,746 since February 7. BTC started the week on a negative note, declined in the first half, and rebounded slightly on Thursday after retesting the lower consolidation boundary at $65,729. As of writing on Friday, BTC is trading at $67,200.
If BTC closes below the lower consolidation level at $65,729 on a daily basis, it could extend the decline toward the key support level at $60,000.
The Relative Strength Index (RSI) on the daily chart reads 36, below the neutral level of 50, suggesting bearish momentum. However, the Moving Average Convergence Divergence (MACD) showed a bullish crossover on Sunday, which remains in place, suggesting that upside bias has not been invalidated yet.
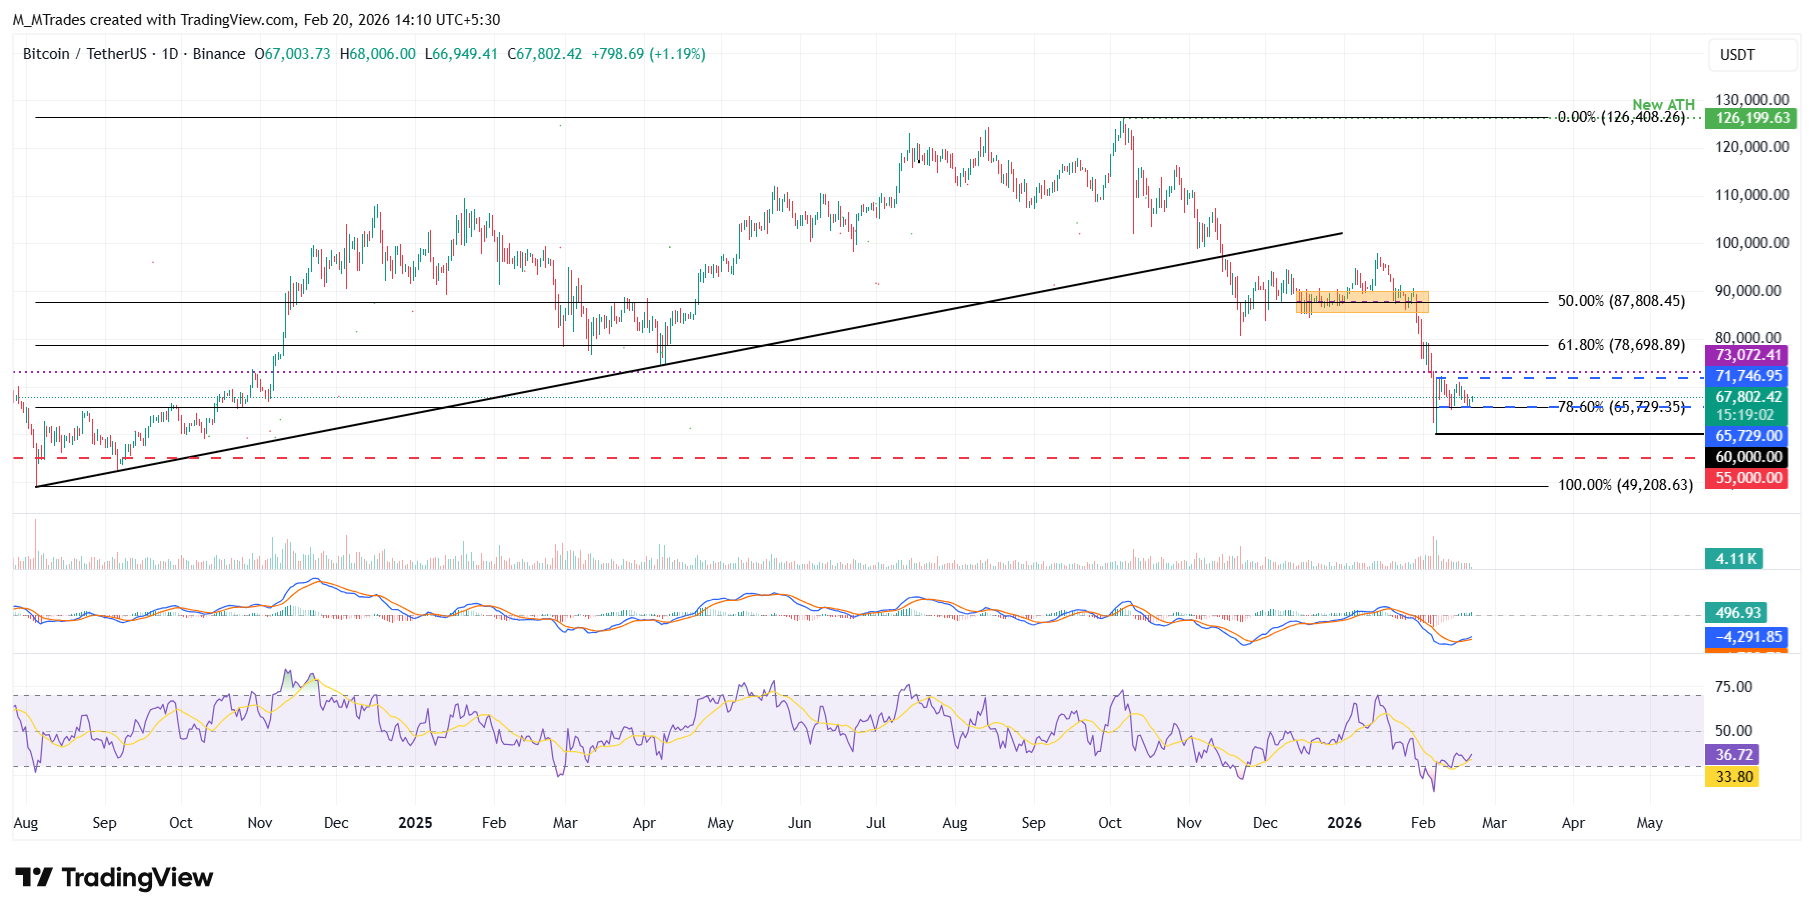
If BTC continues to find support around the lower consolidation range at $65,729, it could extend the advance toward the upper consolidation range at $71,746.
Bitcoin, altcoins, stablecoins FAQs
Bitcoin is the largest cryptocurrency by market capitalization, a virtual currency designed to serve as money. This form of payment cannot be controlled by any one person, group, or entity, which eliminates the need for third-party participation during financial transactions.
Altcoins are any cryptocurrency apart from Bitcoin, but some also regard Ethereum as a non-altcoin because it is from these two cryptocurrencies that forking happens. If this is true, then Litecoin is the first altcoin, forked from the Bitcoin protocol and, therefore, an “improved” version of it.
Stablecoins are cryptocurrencies designed to have a stable price, with their value backed by a reserve of the asset it represents. To achieve this, the value of any one stablecoin is pegged to a commodity or financial instrument, such as the US Dollar (USD), with its supply regulated by an algorithm or demand. The main goal of stablecoins is to provide an on/off-ramp for investors willing to trade and invest in cryptocurrencies. Stablecoins also allow investors to store value since cryptocurrencies, in general, are subject to volatility.
Bitcoin dominance is the ratio of Bitcoin's market capitalization to the total market capitalization of all cryptocurrencies combined. It provides a clear picture of Bitcoin’s interest among investors. A high BTC dominance typically happens before and during a bull run, in which investors resort to investing in relatively stable and high market capitalization cryptocurrency like Bitcoin. A drop in BTC dominance usually means that investors are moving their capital and/or profits to altcoins in a quest for higher returns, which usually triggers an explosion of altcoin rallies.
Artigos Recomendados


