

Gold trades in tight range as upside looks capped by USD recovery
- Gold continues unfolding a mini-range above $2,500.
- The upside is capped by a recovering US Dollar on the back of easing concerns about the US economy.
- Labor market data out this week could be key, with Nonfarm Payrolls the main release on Friday.
Gold (XAU/USD) continues trading in a familiar range just above $2,500 on Monday even as Asian stocks fall due to China-growth fears following the release of mixed Manufacturing Purchasing Managers Index (PMI) data. Whilst China’s official NBS Manufacturing PMI fell deeper into contraction territory, the Caixin Manufacturing PMI beat estimates and rose into expansion territory.
Gold’s wings clipped by recovery of US Dollar
Gold’s price is facing a little bit of a headwind from the US Dollar (USD), which has bounced back from the year-to-date lows that reached last Tuesday when the US Dollar Index (DXY) touched down at 100.52. It is now trading back up in the 101.60s after the release of July’s US Personal Consumption Expenditures (PCE) data on Friday showed inflation unchanged from the previous month. This, in turn, reassured markets that the US economy is probably heading for a “soft” rather than a “hard” landing.
The outlook for US interest rates, another major driver for the precious metal, remains about the same, with the probabilities of a 50 basis point (bps) cut in September still just above 30% and a 25 bps cut fully priced in, according to the CME FedWatch Tool.
Trading conditions will be thin on Monday as both the US and Canada are on holiday due to Labor Day. Employment data out this week – culminating in Nonfarm Payrolls (NFP) on Friday – however, will be a key deciding factor as to whether the Federal Reserve (Fed) will opt for a big half percent cut or a more standard quarter percent reduction.
Technical Analysis: Continues trading in mini-range
Gold (XAU/USD) continues trading within a mini-range between $2,500 and $2,531. The short-term trend could now probably be characterized as “sideways” and, therefore, is more likely than not to continue oscillating until a breakout occurs.
Gold’s medium and long-term trends remain bullish, which, given “the trend is your friend,” means the odds favor an eventual breakout higher materializing.
XAU/USD 4-hour Chart
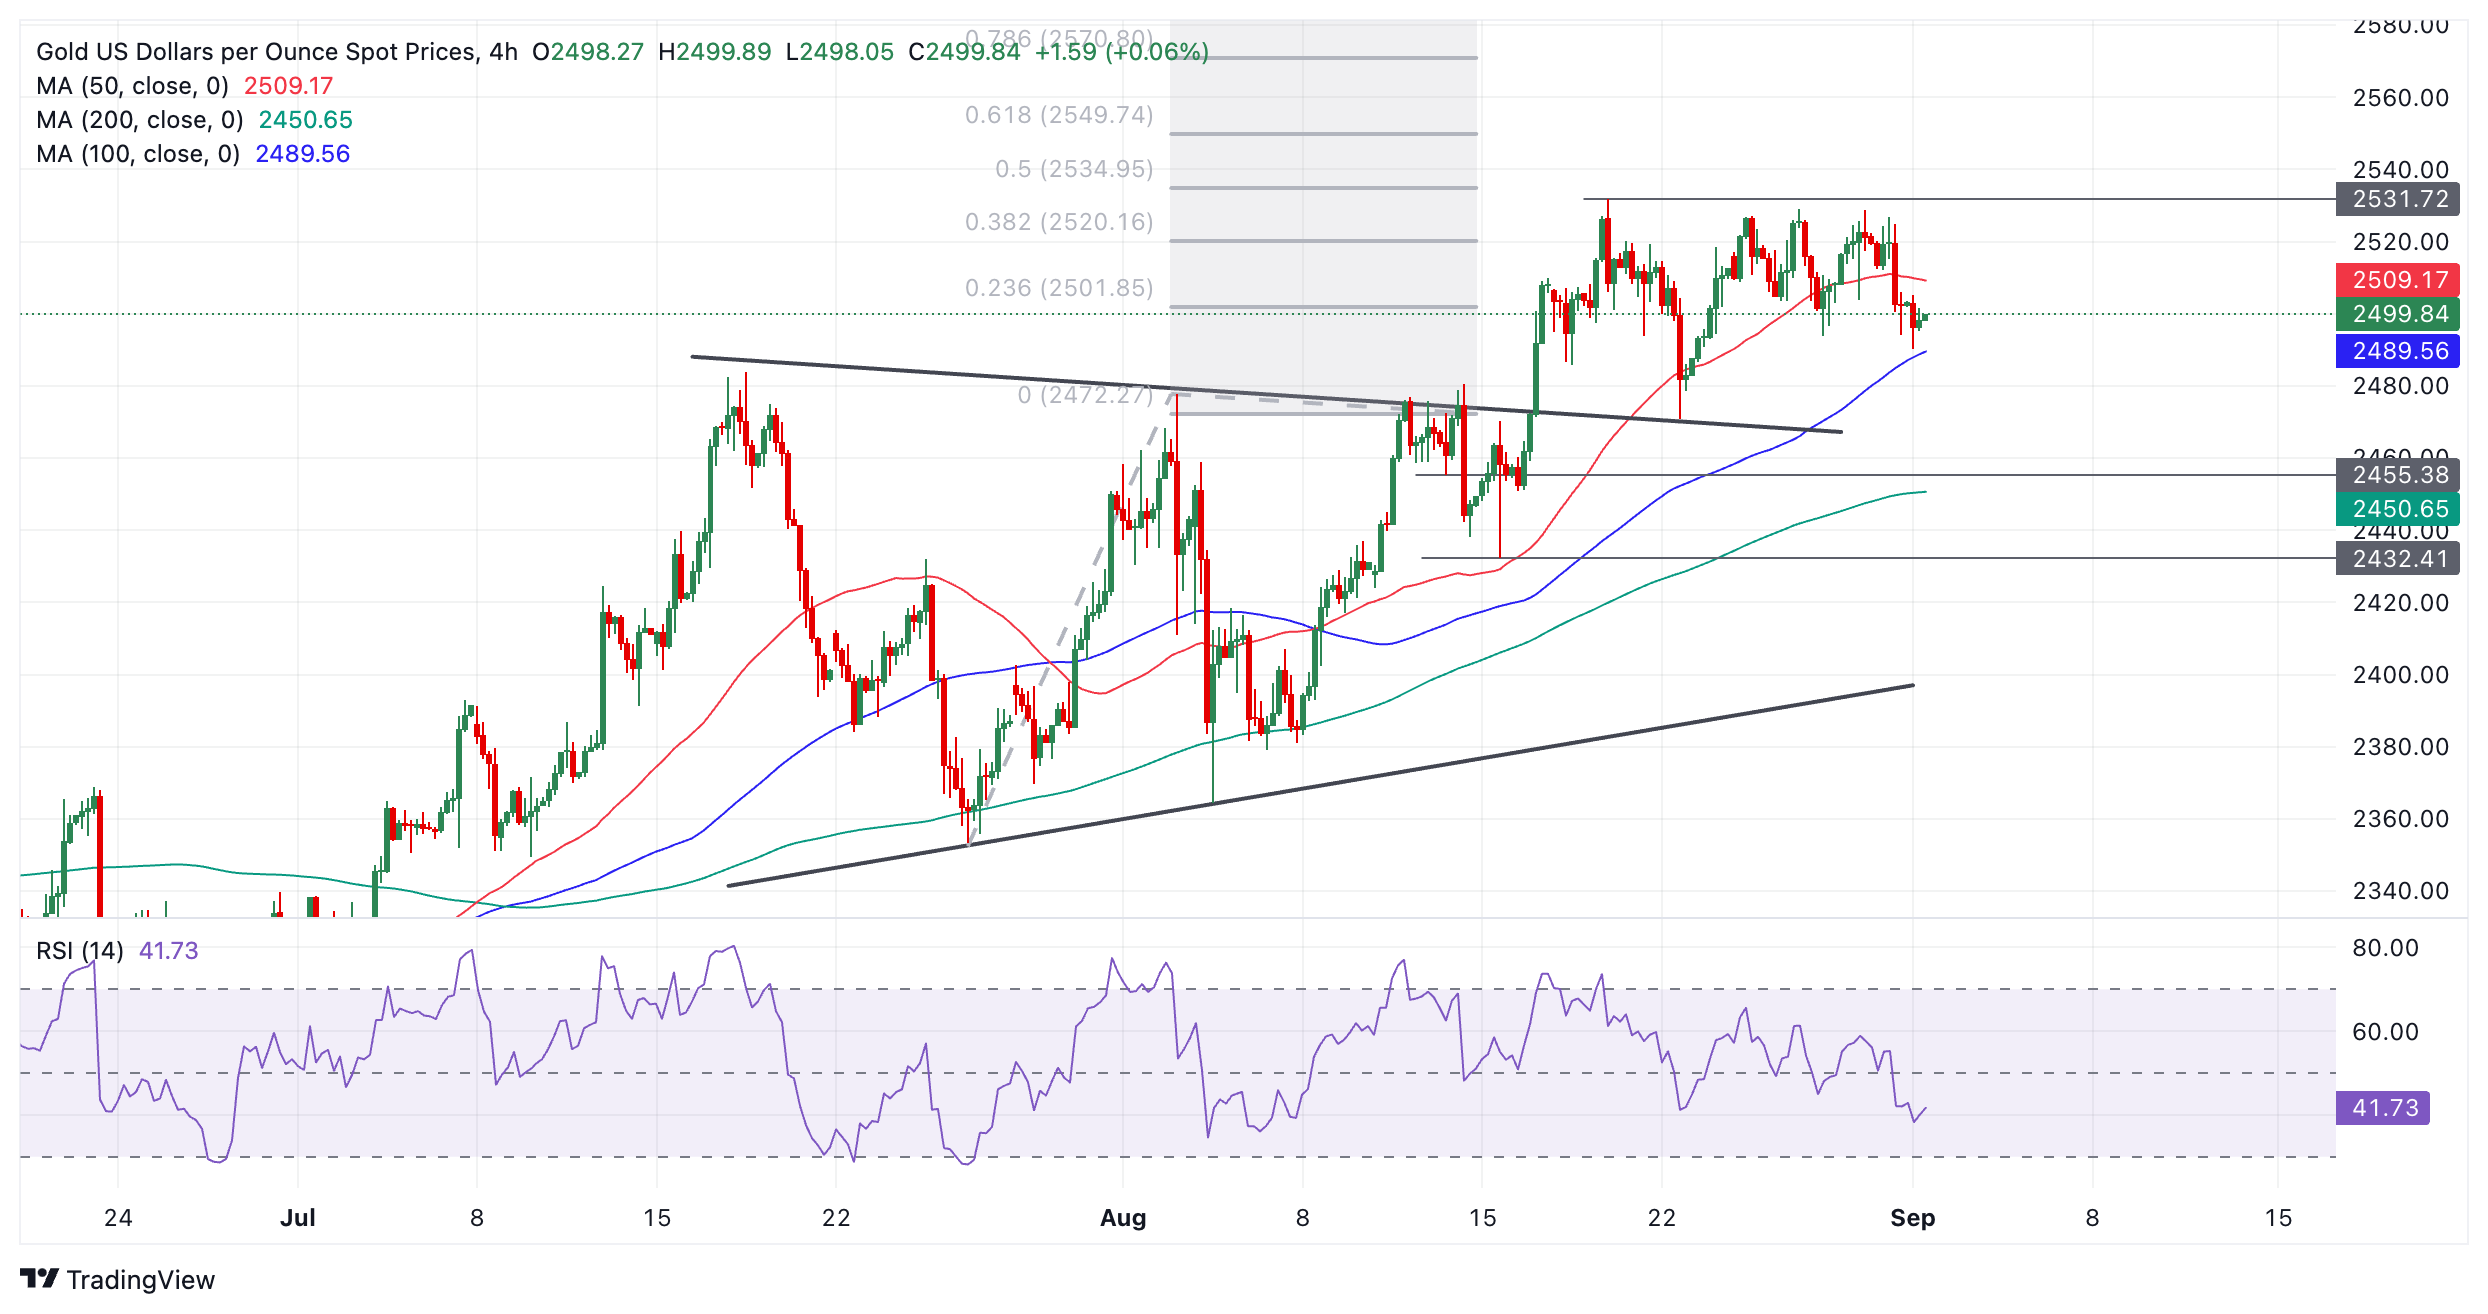
The breakout from the prior range (which resembles an incomplete triangle pattern) that occurred on August 14 generated an upside target at roughly $2,550, calculated by taking the 0.618 Fibonacci ratio of the range’s height and extrapolating it higher. This target is the minimum expectation for the follow-through from a breakout based on principles of technical analysis.
A break above the August 20 all-time high of $2,531 would provide confirmation of a continuation higher toward the $2,550 target.
Alternatively, a break back inside the previous range would negate the projected upside target. Such a move would be confirmed on a daily close below $2,470 (August 22 low). It would change the picture for Gold and suggest that the commodity might start a short-term downtrend.
Gold FAQs
Gold has played a key role in human’s history as it has been widely used as a store of value and medium of exchange. Currently, apart from its shine and usage for jewelry, the precious metal is widely seen as a safe-haven asset, meaning that it is considered a good investment during turbulent times. Gold is also widely seen as a hedge against inflation and against depreciating currencies as it doesn’t rely on any specific issuer or government.
Central banks are the biggest Gold holders. In their aim to support their currencies in turbulent times, central banks tend to diversify their reserves and buy Gold to improve the perceived strength of the economy and the currency. High Gold reserves can be a source of trust for a country’s solvency. Central banks added 1,136 tonnes of Gold worth around $70 billion to their reserves in 2022, according to data from the World Gold Council. This is the highest yearly purchase since records began. Central banks from emerging economies such as China, India and Turkey are quickly increasing their Gold reserves.
Gold has an inverse correlation with the US Dollar and US Treasuries, which are both major reserve and safe-haven assets. When the Dollar depreciates, Gold tends to rise, enabling investors and central banks to diversify their assets in turbulent times. Gold is also inversely correlated with risk assets. A rally in the stock market tends to weaken Gold price, while sell-offs in riskier markets tend to favor the precious metal.
The price can move due to a wide range of factors. Geopolitical instability or fears of a deep recession can quickly make Gold price escalate due to its safe-haven status. As a yield-less asset, Gold tends to rise with lower interest rates, while higher cost of money usually weighs down on the yellow metal. Still, most moves depend on how the US Dollar (USD) behaves as the asset is priced in dollars (XAU/USD). A strong Dollar tends to keep the price of Gold controlled, whereas a weaker Dollar is likely to push Gold prices up.
Artigos Recomendados


