


Silver Price Forecast: XAG/USD bears eye $50.00 as RSI enters oversold territory
- Silver tumbles to fresh yearly lows as hawkish Fed expectations dominate.
- XAG/USD trades below daily SMAs, keeping the bearish outlook intact.
- RSI signals oversold conditions, while MACD and ADX suggest sellers remain in control.
Silver (XAG/USD) falls around 3% on Thursday, sliding to fresh year-to-date lows as hawkish Federal Reserve (Fed) expectations keep buyers on the sidelines. At the time of writing, XAG/USD trades around $52.32, its lowest level since November 2025.
The decline comes despite a softer US Dollar (USD), suggesting that price action remains driven by interest rate expectations. Higher borrowing costs increase the opportunity cost of holding non-yielding Silver.
The latest US economic data released on Thursday keep bets on a December rate hike firmly in place. The core Personal Consumption Expenditures (PCE) Price Index, closely watched by the Fed, rose 0.3% MoM in September. Annual core inflation increased to 3.1% from 3.0%, remaining above the Fed’s 2% target.
Meanwhile, the preliminary estimate of third-quarter Gross Domestic Product (GDP) showed the US economy grew at an annualised rate of 3.4%, above expectations of 3.2% and up from 2.2% in the previous quarter. Traders see around an 80% chance of a December rate hike, according to the CME FedWatch Tool.
This comes after the Fed opted to keep interest rates unchanged at 3.75%-4.00% at the conclusion of its October meeting on Wednesday. However, the main takeaway was that inflation remained elevated and the central bank remained committed to ensuring price stability.
Technical Analysis
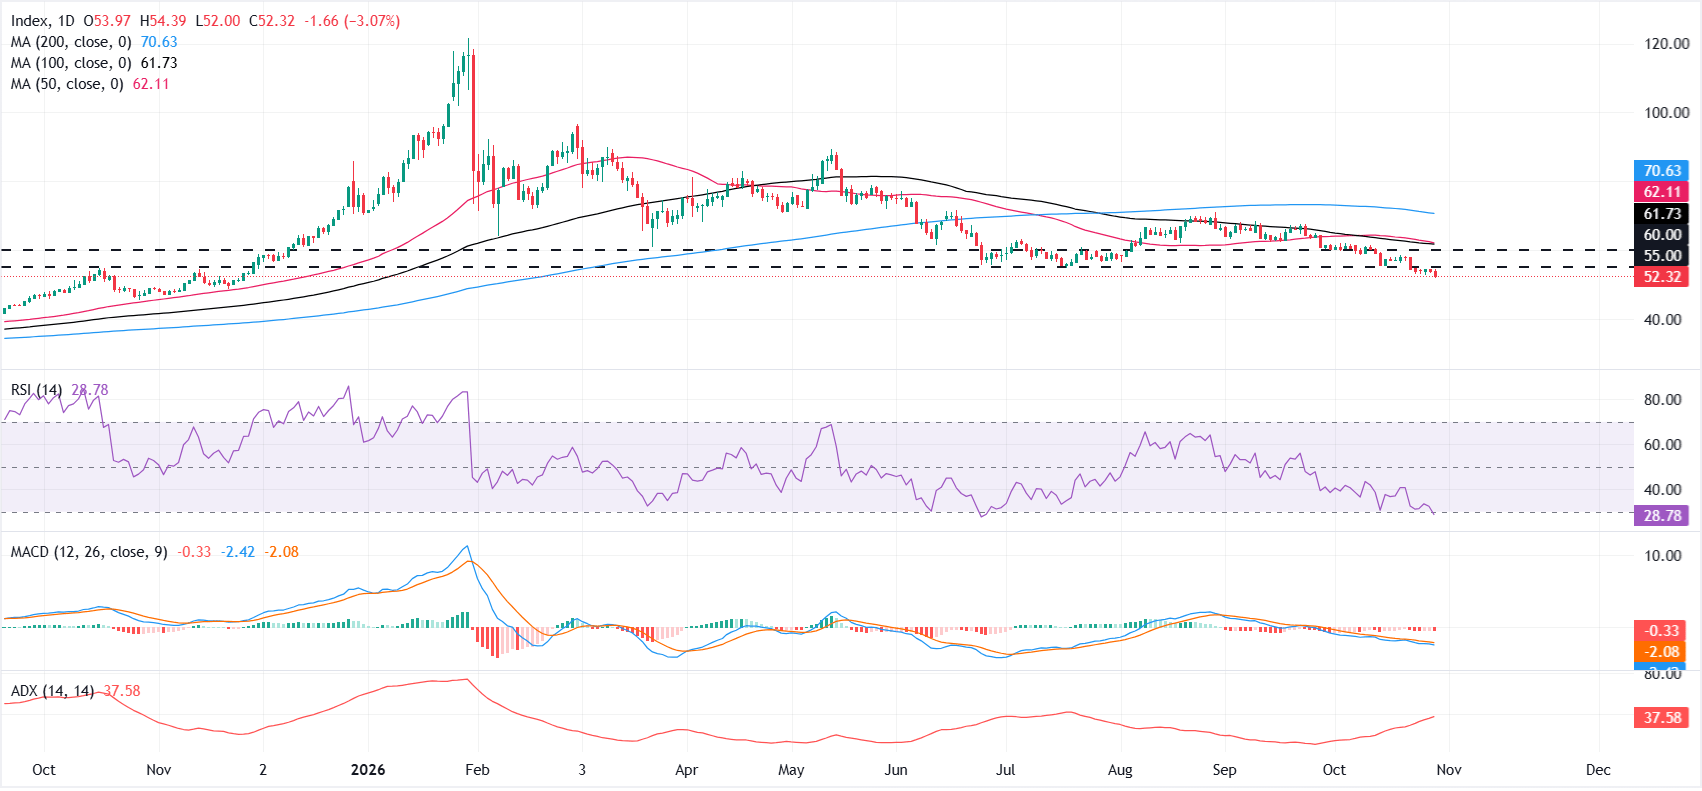
On the technical front, sellers remain in control as XAG/USD trades well below its key daily moving averages. The Relative Strength Index (RSI) sits near 28, signalling oversold conditions that could allow a short-term bounce. However, the Moving Average Convergence Divergence (MACD) remains negative, while the Average Directional Index (ADX) near 37 suggests the downtrend remains strong.
On the topside, initial resistance is seen at the horizontal level near $55.00, followed by the former congestion zone around $60.00 before the 100-day SMA at $61.73 and the 50-day SMA at $62.11 come into play as a broader resistance band, with the 200-day SMA further up at $70.63 marking a major barrier to any sustained recovery.
On the downside, an extension of the decline would bring the $50.00 psychological level into focus as major support. A decisive break below it could open the door to deeper losses.
(The technical analysis of this story was written with the help of an AI tool. Know more.)
US Dollar Price Today
The table below shows the percentage change of US Dollar (USD) against listed major currencies today. US Dollar was the strongest against the Australian Dollar.
| USD | EUR | GBP | JPY | CAD | AUD | NZD | CHF | |
|---|---|---|---|---|---|---|---|---|
| USD | -0.15% | -0.34% | 0.02% | -0.16% | 0.24% | -0.11% | -0.26% | |
| EUR | 0.15% | -0.19% | 0.18% | 0.02% | 0.40% | 0.03% | -0.12% | |
| GBP | 0.34% | 0.19% | 0.36% | 0.16% | 0.58% | 0.20% | 0.07% | |
| JPY | -0.02% | -0.18% | -0.36% | -0.19% | 0.22% | -0.16% | -0.29% | |
| CAD | 0.16% | -0.02% | -0.16% | 0.19% | 0.41% | 0.06% | -0.09% | |
| AUD | -0.24% | -0.40% | -0.58% | -0.22% | -0.41% | -0.35% | -0.51% | |
| NZD | 0.11% | -0.03% | -0.20% | 0.16% | -0.06% | 0.35% | -0.12% | |
| CHF | 0.26% | 0.12% | -0.07% | 0.29% | 0.09% | 0.51% | 0.12% |
The heat map shows percentage changes of major currencies against each other. The base currency is picked from the left column, while the quote currency is picked from the top row. For example, if you pick the US Dollar from the left column and move along the horizontal line to the Japanese Yen, the percentage change displayed in the box will represent USD (base)/JPY (quote).
Artigos Recomendados


