


Silver Price Forecast: XAG/USD remains vulnerable near $60
- Silver remains under pressure as hawkish Fed expectations outweigh softer US inflation data.
- Technically, XAG/USD holds below the 50-day, 100-day and 200-day SMAs.
- Momentum remains bearish, with the $60 level offering initial support.
Silver (XAG/USD) trades under pressure on Wednesday even as traders reduce bets that the Federal Reserve (Fed) will raise interest rates again in October following softer-than-expected US PCE inflation data. At the time of writing, the metal trades around $60.38 and is set to close September with a loss of nearly 9%.
The white metal briefly strengthened after the inflation data pushed the US Dollar and Treasury yields lower. However, the move proved short-lived as stronger Gross Domestic Product (GDP) and ADP employment figures showed that the US economy remains resilient. The data keeps expectations alive that the Fed could still raise rates later this year as policymakers remain committed to bringing inflation back to the central bank’s 2% target.
These hawkish Fed expectations keep the US Dollar and Treasury yields supported, weighing on non-yielding assets such as Silver, which tend to perform better when borrowing costs are low. Attention now turns to the US ISM Manufacturing PMI on Thursday and the Nonfarm Payrolls report on Friday for fresh clues about the Fed’s policy path.
Technical analysis
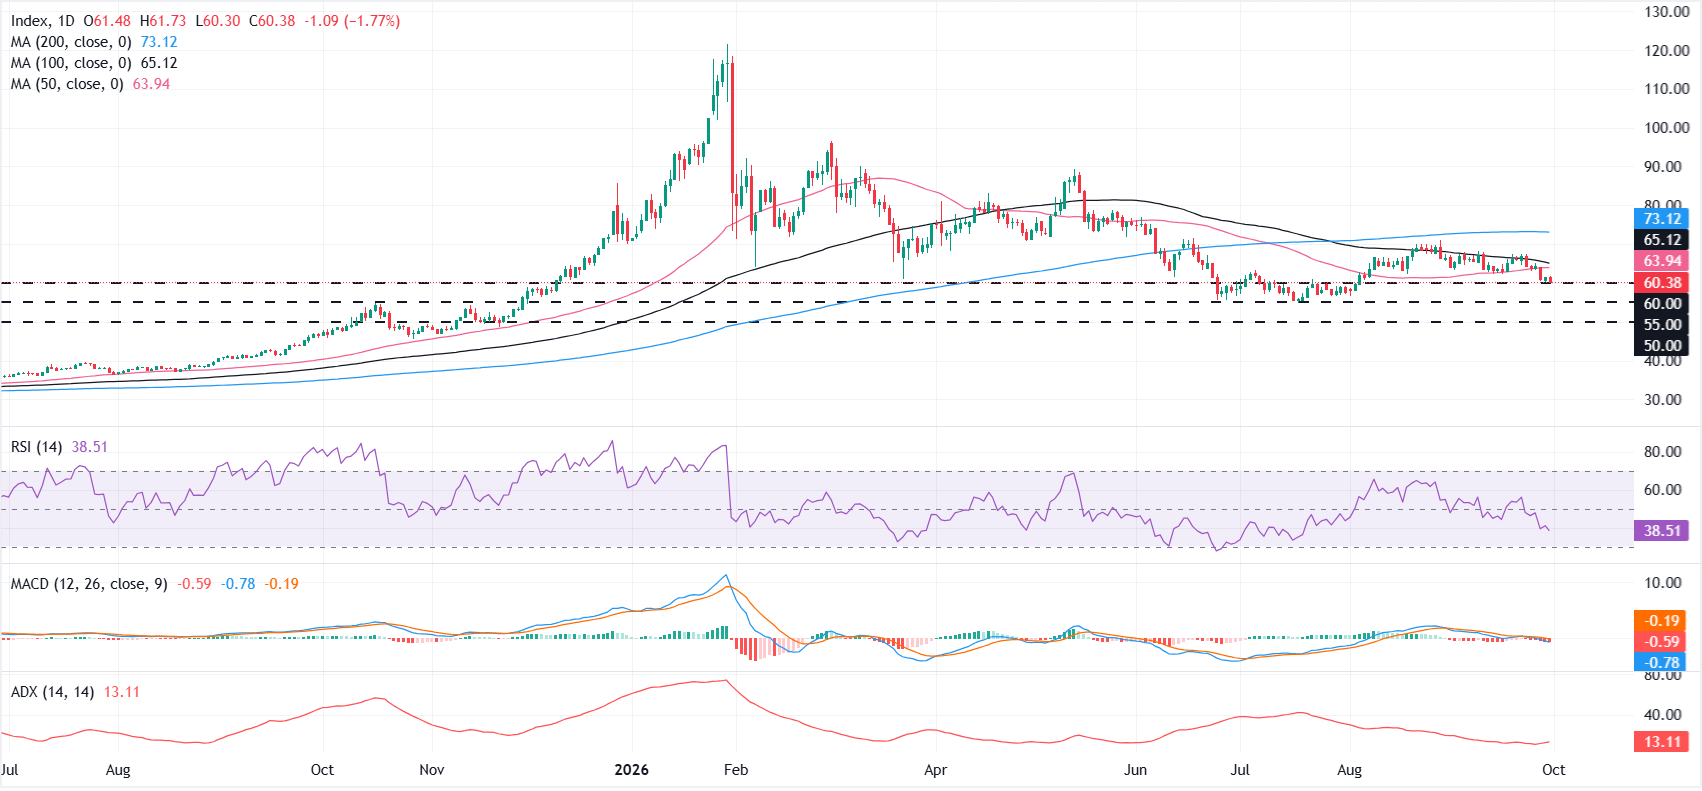
On the daily chart, XAG/USD maintains a bearish near-term bias as it holds well below the 50-day, 100-day and 200-day Simple Moving Averages (SMAs).
Momentum reinforces this pressured tone, with the Relative Strength Index (RSI) slipping toward the lower 40s and Moving Average Convergence Divergence (MACD) remaining below zero with a negative reading, while the subdued Average Directional Index (ADX) around 13 suggests a weak but persistent downtrend.
On the downside, initial support emerges at the horizontal level near $60, ahead of a deeper floor at $55 and the more distant $50 zone. On the topside, any recovery would first need to challenge resistance at the 50-day SMA around $63, followed by the 100-day SMA at $65, while the 200-day SMA near $73 remains a broader bearish barrier capping the medium-term outlook.
(The technical analysis of this story was written with the help of an AI tool. Know more.)
Fed FAQs
Monetary policy in the US is shaped by the Federal Reserve (Fed). The Fed has two mandates: to achieve price stability and foster full employment. Its primary tool to achieve these goals is by adjusting interest rates. When prices are rising too quickly and inflation is above the Fed’s 2% target, it raises interest rates, increasing borrowing costs throughout the economy. This results in a stronger US Dollar (USD) as it makes the US a more attractive place for international investors to park their money. When inflation falls below 2% or the Unemployment Rate is too high, the Fed may lower interest rates to encourage borrowing, which weighs on the Greenback.
The Federal Reserve (Fed) holds eight policy meetings a year, where the Federal Open Market Committee (FOMC) assesses economic conditions and makes monetary policy decisions. The FOMC is attended by twelve Fed officials – the seven members of the Board of Governors, the president of the Federal Reserve Bank of New York, and four of the remaining eleven regional Reserve Bank presidents, who serve one-year terms on a rotating basis.
In extreme situations, the Federal Reserve may resort to a policy named Quantitative Easing (QE). QE is the process by which the Fed substantially increases the flow of credit in a stuck financial system. It is a non-standard policy measure used during crises or when inflation is extremely low. It was the Fed’s weapon of choice during the Great Financial Crisis in 2008. It involves the Fed printing more Dollars and using them to buy high grade bonds from financial institutions. QE usually weakens the US Dollar.
Quantitative tightening (QT) is the reverse process of QE, whereby the Federal Reserve stops buying bonds from financial institutions and does not reinvest the principal from the bonds it holds maturing, to purchase new bonds. It is usually positive for the value of the US Dollar.
Artigos Recomendados


