

Gold price extends losses on weak safe haven demand, Fed’s hawkish outlook
- Gold price slips below $2,300 as fears of widening Middle East conflict wane.
- The US Dollar’s appeal improves on a strong US economic outlook.
- The Fed supports keeping interest rates higher until there is confidence that inflation will return to 2%.
Gold price (XAU/USD) extends its downside for a second consecutive day, trading slightly below the crucial support of $2,300 in Tuesday’s European session. The precious metal shifts into bearish territory as investors shrug off Middle East fears amid hopes that the conflict between Iran and Israel will not escalate further. This has improved investors’ risk appetite while safe-haven demand has waned.
The outlook of Gold turns vulnerable as an improved appeal for the US Dollar negatively impacts the dollar-denominated commodity. Investment banking firm Goldman Sachs said: “As we move into the second quarter, ongoing upgrades to already-robust US growth forecasts give the FOMC the luxury of a later and more gradual policy adjustment.” The US Dollar Index (DXY), which tracks the US Dollar’s value against six major currencies, hovers near 106.00.
Meanwhile, 10-year US Treasury yields trade sideways around 4.62% as the focus shifts to the US core Personal Consumption Expenditure Price Index (PCE) data for March, which will be published on Friday. The inflation data will provide cues about the Federal Reserve’s (Fed) guidance on interest rates in the May policy meeting, in which policymakers are widely anticipated to keep them unchanged in the range of 5.25%-5.50%. The Fed’s preference for keeping interest rates higher bodes well for the US bond yields and weighs on Gold.
Daily digest market movers: Gold price weakens while US bond yields consolidate
- Gold price dips below the crucial support of $2,300 as safe-haven demand has melted amid easing Middle East tensions. The limited retaliatory attack from Israel on Isfahan against the hundreds of missiles and drones launched in their state on April 13 as well as Iran’s no plan for an immediate response indicate that both nations aren’t interested in widening the conflict.
- Apart from that, recent hawkish guidance from Federal Reserve policymakers on interest rates has also weighed on Gold. Fed policymakers see the current monetary policy framework as appropriate given that inflation has remained stubbornly higher in the first three months of this year and labor demand remains robust.
- Fed policymakers are expected to keep interest rates at their current levels until they get confidence that inflation will come down to the 2% target. Currently, traders expect that the Fed will start reducing interest rates from the September meeting. This week, investors will focus on the US core PCE Price Index data, which will influence expectations for Fed rate cuts.
- The monthly core PCE is estimated to have grown steadily by 0.3%, with annual figures decelerating to 2.6% from 2.8% in February. The core PCE is the Fed’s preferred inflation measure as it excludes volatile food and energy prices. Softer-than-expected US inflation numbers would increase expectations of early rate cuts by the Fed, which will help Gold gauge a firm footing. On the contrary, sticky or hotter-than-expected figures will likely weigh on Gold prices.
- Before the US core PCE inflation data, investors will focus on the preliminary Q1 Gross Domestic Product (GDP), which exhibits the performance of the US economy in the period. The economy is anticipated to have expanded at an annualised pace of 2.5%, slower than the 3.4% increase noted in the last quarter of 2023.
Technical Analysis: Gold price tests territory below $2,300
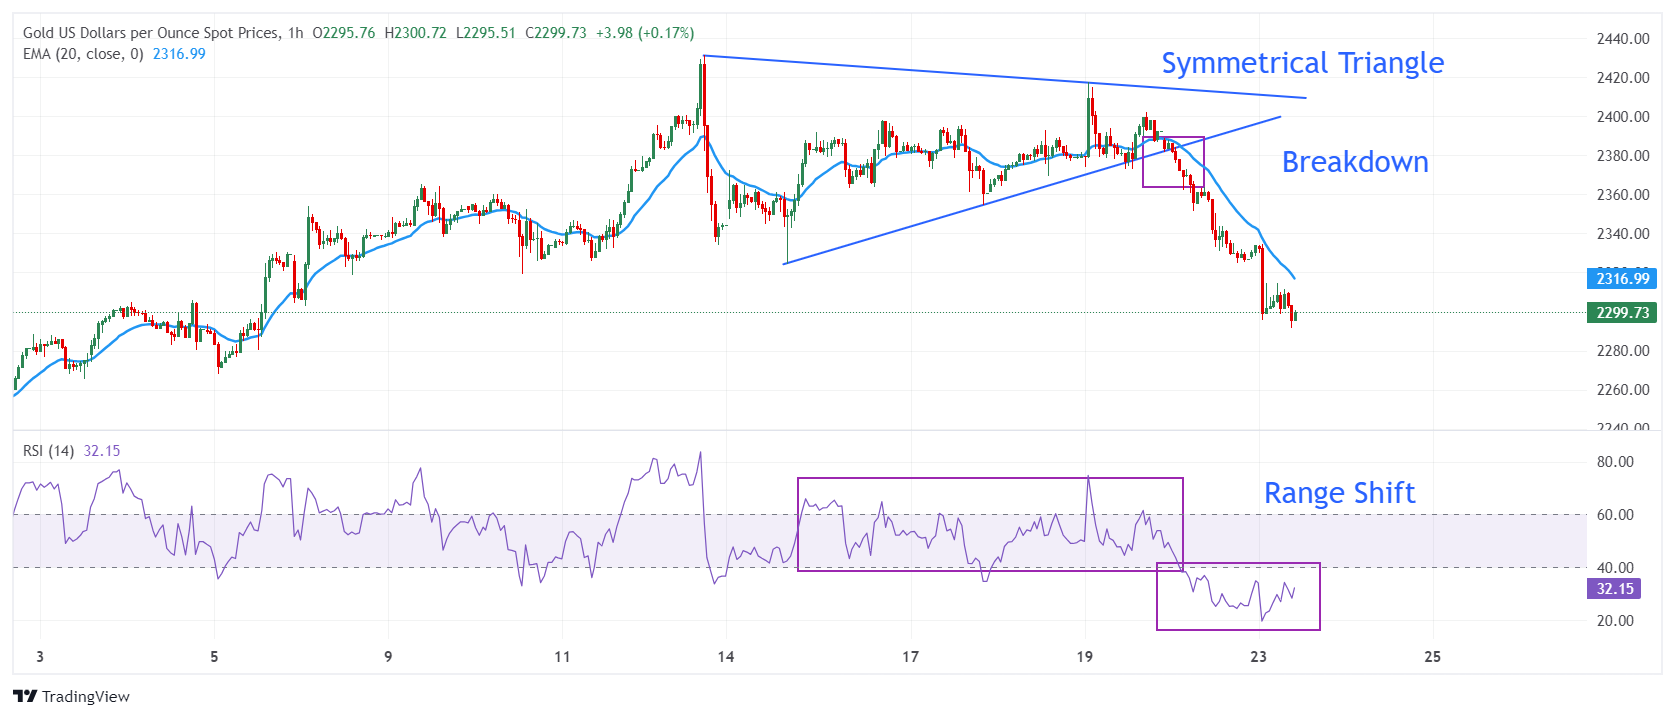
Gold price faces an intense sell-off after a breakdown of the Symmetrical Triangle formation on the hourly time frame. The precious metal slips below $2,300 as a downside break of the above-mentioned pattern explodes the volatility, resulting in wider ticks on the downside and heavy selling volume.
The 20-period Exponential Moving Average (EMA) at $2,317 is acting as a major barricade for the Gold price bulls. The 14-period Relative Strength Index (RSI) has delivered a range shift move from the 40.00-60.00 territory to the 20.00-40.00 region, indicating that a bearish momentum has been triggered.
Gold FAQs
Gold has played a key role in human’s history as it has been widely used as a store of value and medium of exchange. Currently, apart from its shine and usage for jewelry, the precious metal is widely seen as a safe-haven asset, meaning that it is considered a good investment during turbulent times. Gold is also widely seen as a hedge against inflation and against depreciating currencies as it doesn’t rely on any specific issuer or government.
Central banks are the biggest Gold holders. In their aim to support their currencies in turbulent times, central banks tend to diversify their reserves and buy Gold to improve the perceived strength of the economy and the currency. High Gold reserves can be a source of trust for a country’s solvency. Central banks added 1,136 tonnes of Gold worth around $70 billion to their reserves in 2022, according to data from the World Gold Council. This is the highest yearly purchase since records began. Central banks from emerging economies such as China, India and Turkey are quickly increasing their Gold reserves.
Gold has an inverse correlation with the US Dollar and US Treasuries, which are both major reserve and safe-haven assets. When the Dollar depreciates, Gold tends to rise, enabling investors and central banks to diversify their assets in turbulent times. Gold is also inversely correlated with risk assets. A rally in the stock market tends to weaken Gold price, while sell-offs in riskier markets tend to favor the precious metal.
The price can move due to a wide range of factors. Geopolitical instability or fears of a deep recession can quickly make Gold price escalate due to its safe-haven status. As a yield-less asset, Gold tends to rise with lower interest rates, while higher cost of money usually weighs down on the yellow metal. Still, most moves depend on how the US Dollar (USD) behaves as the asset is priced in dollars (XAU/USD). A strong Dollar tends to keep the price of Gold controlled, whereas a weaker Dollar is likely to push Gold prices up.
Artigos Recomendados


