

EUR/JPY Price Analysis: Bulls need to wait for strength above 200-day SMA, around 165.00
- EUR/JPY attracts buyers for the third straight day and climbs closer to the weekly top.
- The BoJ uncertainty continues to undermine the JPY and lends support to the cross.
- A neutral technical setup warrants caution for bulls amid the German political crisis.
The EUR/JPY cross builds on the overnight bounce from the vicinity of the 163.25-163.20 horizontal support, or the weekly low and gains some follow-through traction on Wednesday. This marks the third day of a positive move and lifts spot prices to the top end of the weekly range, around the 164.60-164.65 region during the first half of the European session.
The uncertainty over the Bank of Japan's (BoJ) rate-hike plans is seen undermining the Japanese Yen (JPY) and turning out to be a key factor acting as a tailwind for the EUR/JPY cross. That said, speculations that Japanese authorities will intervene in the FX market to prop up the domestic currency, along with a weaker risk tone, should limit losses for the safe-haven JPY. Furthermore, a political crisis in Germany – the Eurozone's largest economy – continues to weigh on the shared currency and should cap gains for the currency pair.
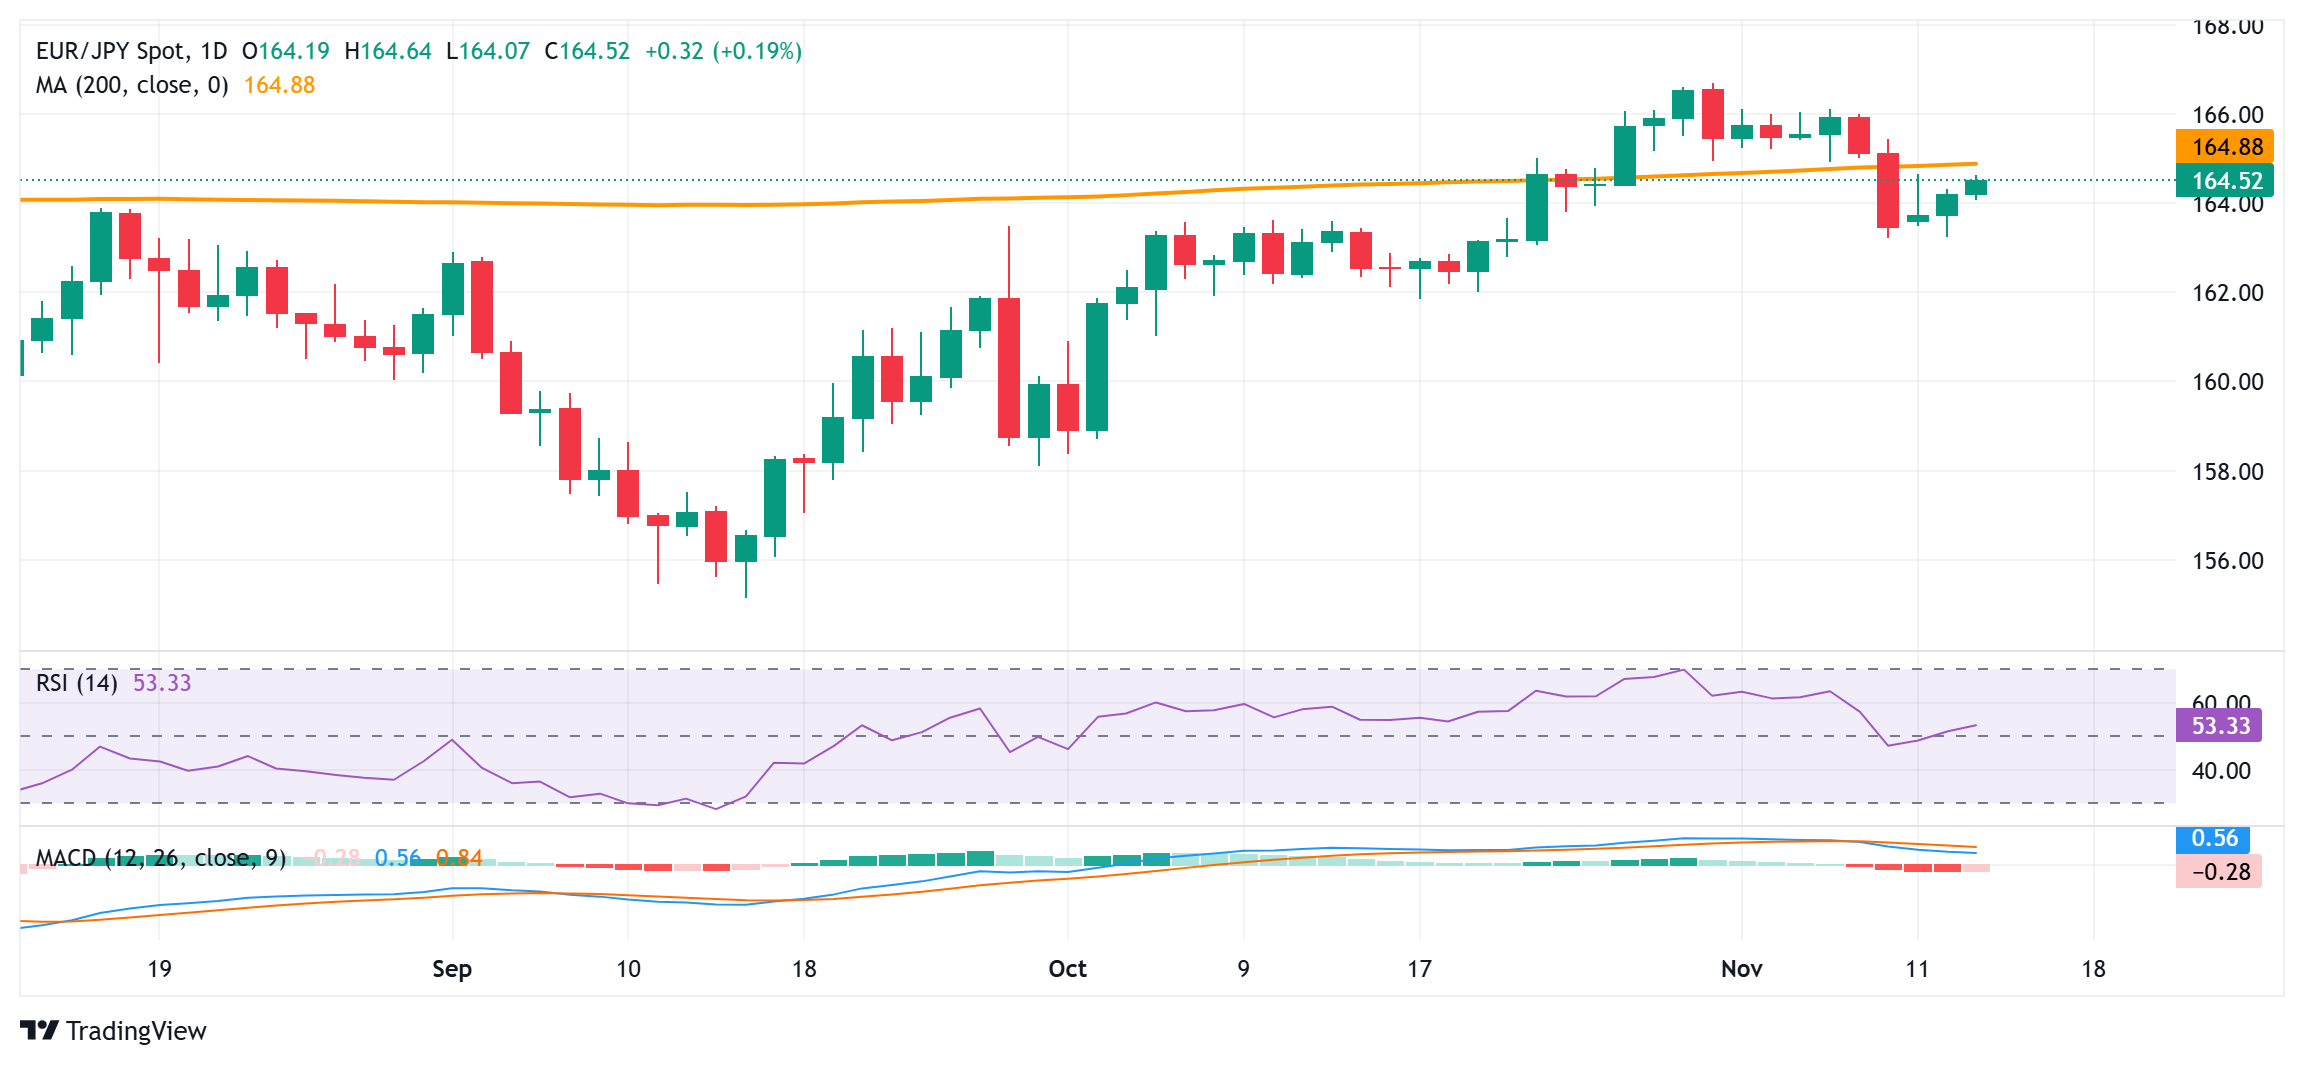
Moreover, neutral oscillators on the daily chart warrant some caution for bulls and suggest that any subsequent move up is more likely to face stiff resistance near the 165.00 psychological mark, or the 200-day Simple Moving Average (SMA). A sustained move beyond should lift the EUR/JPY cross towards the 165.45 hurdle en route to the 165.90-166.00 supply zone. This is followed by a multi-year peak, around the 166.65-166.70 area touched in October, which if cleared should pave the way for the resumption of a two-month-old uptrend.
On the flip side, the 164.00 round figure now seems to protect the immediate downside ahead of the 163.25-163.20 horizontal support. A convincing break below the latter might prompt some technical selling and drag the EUR/JPY cross below the 163.00 mark, towards testing the next relevant support near the 162.50-162.45 region. The corrective decline could extend further towards the 50-day SMA, currently pegged near the 162.00-161.95 zone.
EUR/JPY daily chart
Japanese Yen FAQs
The Japanese Yen (JPY) is one of the world’s most traded currencies. Its value is broadly determined by the performance of the Japanese economy, but more specifically by the Bank of Japan’s policy, the differential between Japanese and US bond yields, or risk sentiment among traders, among other factors.
One of the Bank of Japan’s mandates is currency control, so its moves are key for the Yen. The BoJ has directly intervened in currency markets sometimes, generally to lower the value of the Yen, although it refrains from doing it often due to political concerns of its main trading partners. The BoJ ultra-loose monetary policy between 2013 and 2024 caused the Yen to depreciate against its main currency peers due to an increasing policy divergence between the Bank of Japan and other main central banks. More recently, the gradually unwinding of this ultra-loose policy has given some support to the Yen.
Over the last decade, the BoJ’s stance of sticking to ultra-loose monetary policy has led to a widening policy divergence with other central banks, particularly with the US Federal Reserve. This supported a widening of the differential between the 10-year US and Japanese bonds, which favored the US Dollar against the Japanese Yen. The BoJ decision in 2024 to gradually abandon the ultra-loose policy, coupled with interest-rate cuts in other major central banks, is narrowing this differential.
The Japanese Yen is often seen as a safe-haven investment. This means that in times of market stress, investors are more likely to put their money in the Japanese currency due to its supposed reliability and stability. Turbulent times are likely to strengthen the Yen’s value against other currencies seen as more risky to invest in.
Artigos Recomendados


