

Canadian Dollar churns on the low side after jobs miss
- The Canadian Dollar shed 0.4% against the Greenback on Friday.
- Canada saw a worse-than-expected print in net new jobs additions in October.
- Average Canadian wages also rose, maintaining upward pressure on inflation expectations.
The Canadian Dollar flubbed a near-term technical recovery on Friday, slumping back into familiar lows against the Greenback. The Loonie remains under pressure as the Bank of Canada (BoC) continues to keep downward pressure on interest rates in the face of lagging employment figures, though the Canadian central bank is quickly running out of runway as rising wages keep inflation expectations simmering in the background.
Canada reported a much lower than expected print in Net Change in Employment in October, entirely missing the mark as job gains continue to wither. Canadian Average Hourly Wages also rebounded, reminding investors of Canada’s ongoing battle with still-high inflation expectations despite overall price growth well outpacing wages across the gamut of timeframes.
Daily digest market movers: Canadian Dollar backslides on missed jobs growth
- Canadian Net Change in Employment rose by a scant 14.5K in October, missing the forecast 25K and well below September’s 46.7K print.
- Average Hourly Wages also grew 4.9% YoY in October, rebounding from September’s slowdown to 4.5%.
- With wages back on the rise, inflation expectations are likely to remain elevated, crimping the BoC’s hopes to single-handedly restart Canada’s growth engine using steep interest rate cuts.
- The US Consumer Sentiment Index also rose on Friday, with November chalking in an upswing to 73.0 in aggregated consumer survey results. Markets anticipated a much more moderate upswing to 71.0 from the previous 70.5.
- Despite a wider miss in Canada’s jobs figures for October, the Canadian Unemployment Rate held steady at 5.5% versus the forecast uptick to 6.6%. However, the on-balance Unemployment Rate print is likely due to long-term unemployed workers dropping out of the unemployment reference period as the Canadian Labor Force Participation Rate continues to sink below 65%.
- Canada’s LFPR last printed at 64.8%, and hasn’t been this low since the global recovery from the COVID pandemic in mid-2020.
Canadian Dollar price forecast: Loonie remains sticky near familiar lows
The Canadian Dollar (CAD) continues to churn chart paper close to medium-term lows against the US Dollar. USD/CAD marched to 14-month highs near 1.3960 earlier in November, and a sputtering technical recovery in the Canadian Dollar coupled with a broad-market strengthening of the Greenback has kept the pair bolstered north of the 1.3900 handle.
USD/CAD daily chart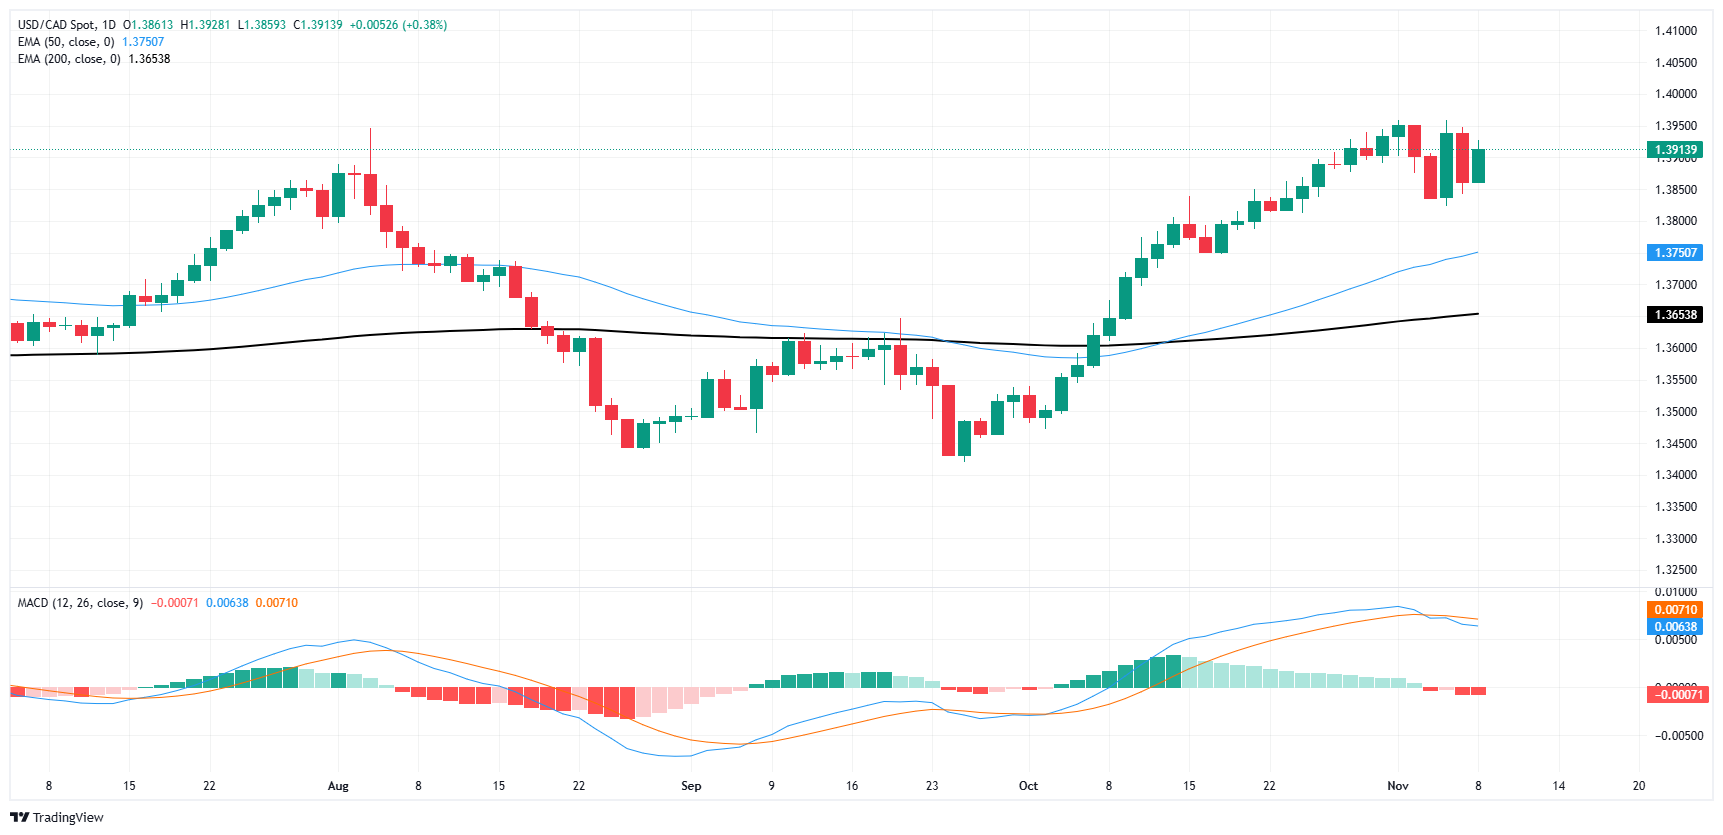
Canadian Dollar FAQs
The key factors driving the Canadian Dollar (CAD) are the level of interest rates set by the Bank of Canada (BoC), the price of Oil, Canada’s largest export, the health of its economy, inflation and the Trade Balance, which is the difference between the value of Canada’s exports versus its imports. Other factors include market sentiment – whether investors are taking on more risky assets (risk-on) or seeking safe-havens (risk-off) – with risk-on being CAD-positive. As its largest trading partner, the health of the US economy is also a key factor influencing the Canadian Dollar.
The Bank of Canada (BoC) has a significant influence on the Canadian Dollar by setting the level of interest rates that banks can lend to one another. This influences the level of interest rates for everyone. The main goal of the BoC is to maintain inflation at 1-3% by adjusting interest rates up or down. Relatively higher interest rates tend to be positive for the CAD. The Bank of Canada can also use quantitative easing and tightening to influence credit conditions, with the former CAD-negative and the latter CAD-positive.
The price of Oil is a key factor impacting the value of the Canadian Dollar. Petroleum is Canada’s biggest export, so Oil price tends to have an immediate impact on the CAD value. Generally, if Oil price rises CAD also goes up, as aggregate demand for the currency increases. The opposite is the case if the price of Oil falls. Higher Oil prices also tend to result in a greater likelihood of a positive Trade Balance, which is also supportive of the CAD.
While inflation had always traditionally been thought of as a negative factor for a currency since it lowers the value of money, the opposite has actually been the case in modern times with the relaxation of cross-border capital controls. Higher inflation tends to lead central banks to put up interest rates which attracts more capital inflows from global investors seeking a lucrative place to keep their money. This increases demand for the local currency, which in Canada’s case is the Canadian Dollar.
Macroeconomic data releases gauge the health of the economy and can have an impact on the Canadian Dollar. Indicators such as GDP, Manufacturing and Services PMIs, employment, and consumer sentiment surveys can all influence the direction of the CAD. A strong economy is good for the Canadian Dollar. Not only does it attract more foreign investment but it may encourage the Bank of Canada to put up interest rates, leading to a stronger currency. If economic data is weak, however, the CAD is likely to fall.
Artigos Recomendados


