NZD/USD Price Analysis: Bulls maintain momentum, eyes on bullish crossover

Fonte Fxstreet
  • The daily indicators remain in positive territory but somewhat flattened .
  • The hourly charts reveal a temporary dip in the RSI and a MACD flattening, signaling a possible short-term consolidation.
  • Pending bullish crossover between the 200 and 100-day SMA at 0.6040 could bolster the bullish momentum in future sessions.

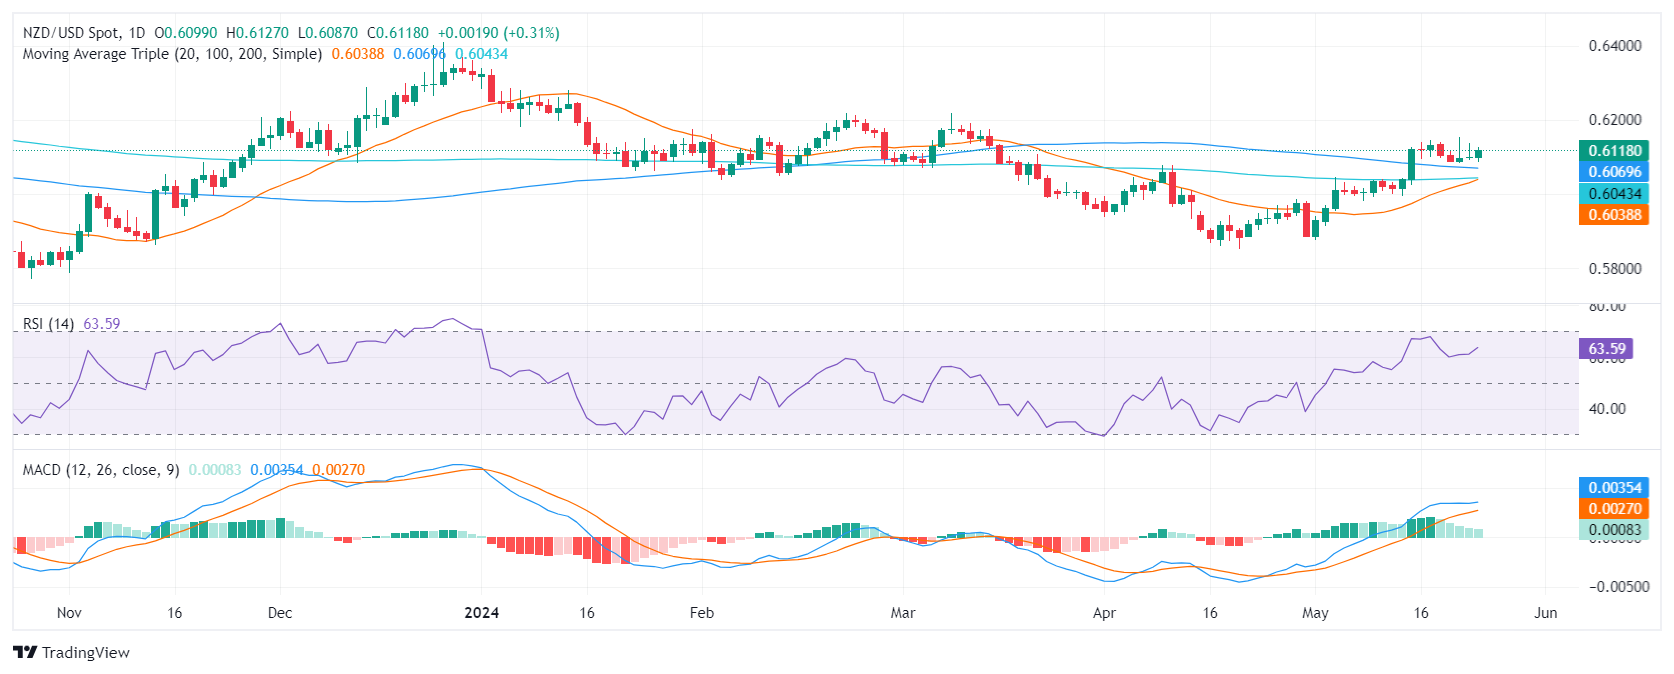
During Friday's session, NZD/USD rose towards the 0.6125 level. The positive trajectory of the pair continues to convey a strong buyer influence in the market. However, echoes of consolidation may suggest a breather following the recent surge which pushed the pair above the 100 and 200-day Simple Moving Averages (SMA).

Examining the daily chart of the NZD/ pair, it is apparent that the Relative Strength Index (RSI) reveals a robust positive trend. After a close approach to overbought conditions at 69, the RSI receded to a still positive level of 63. In line with that, the Moving Average Convergence Divergence (MACD) prints flat green bars which may suggest a flattening momentum.

NZD/USD daily chart
Transitioning to the hourly chart, there is a discernible decreasing trend in the RSI readings, with figures retreating from 64 to 57 throughout Friday’s session. The MACD histogram aligns with this pattern, with flat green bars that signal reduced upward momentum.

NZD/USD hourly chart
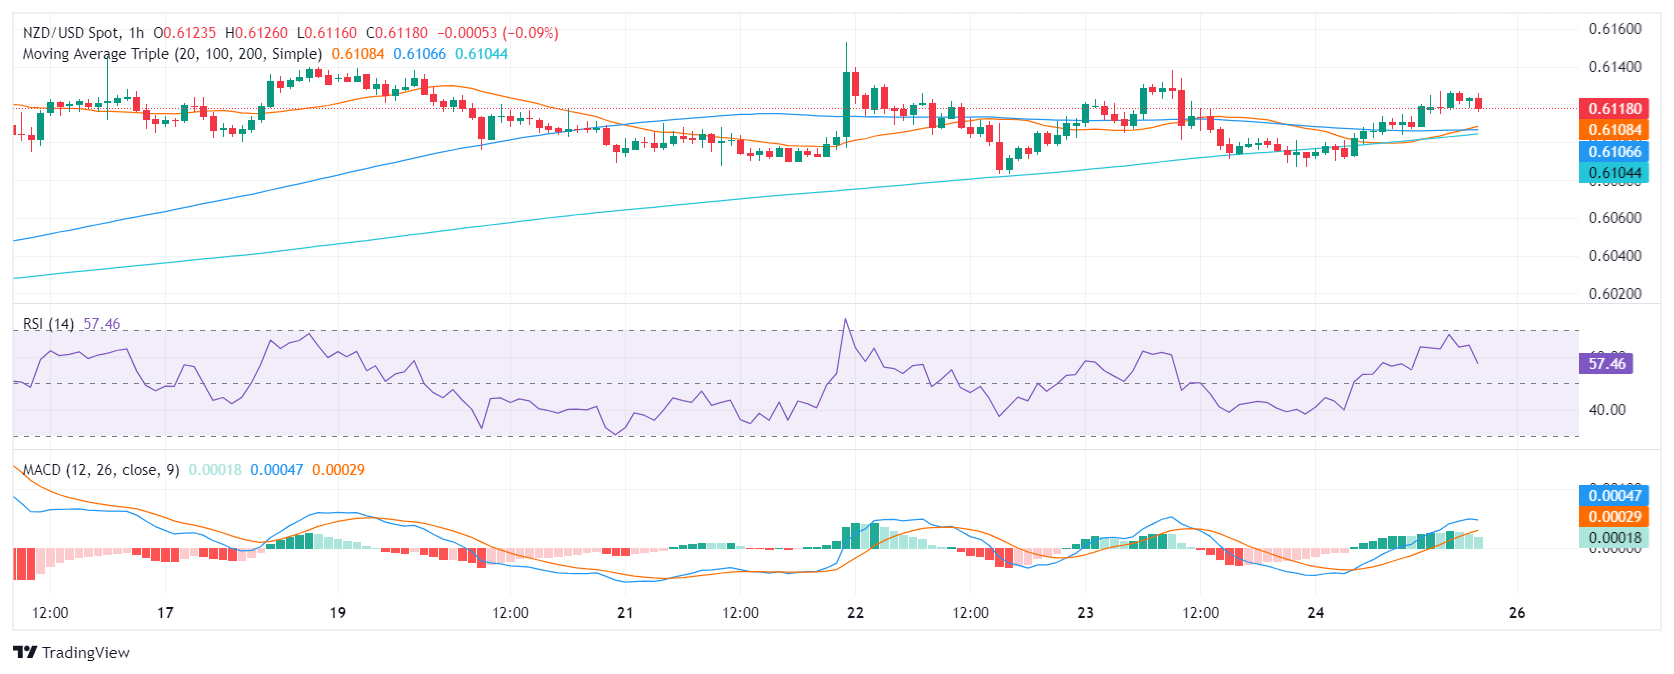
From a broader perspective, the position of NZD/USD suggests a strong bullish trend. Trading above the Simple Moving Averages (SMA) of 20, 100, and 200-day, the pair displays upward momentum both on short-term and long-term scales.

Incorporating both the daily and hourly RSI trends, along with MACD and SMA positioning, the conclusion is drawn that the NZD/USD may need some respite after its recent surge. Despite this, the market structure maintains its bullish tone.


NZD/USD

Overview
Today last price 0.6118
Today Daily Change 0.0019
Today Daily Change % 0.31
Today daily open 0.6099
 
Trends
Daily SMA20 0.603
Daily SMA50 0.6003
Daily SMA100 0.6071
Daily SMA200 0.6042
 
Levels
Previous Daily High 0.6138
Previous Daily Low 0.6091
Previous Weekly High 0.6146
Previous Weekly Low 0.5995
Previous Monthly High 0.6079
Previous Monthly Low 0.5851
Daily Fibonacci 38.2% 0.612
Daily Fibonacci 61.8% 0.6109
Daily Pivot Point S1 0.6081
Daily Pivot Point S2 0.6062
Daily Pivot Point S3 0.6033
Daily Pivot Point R1 0.6128
Daily Pivot Point R2 0.6157
Daily Pivot Point R3 0.6175


Isenção de responsabilidade: Apenas para fins informativos. O desempenho passado não é indicativo de resultados futuros.
placeholder
Ibovespa sobe 0,77% e fecha em 155 mil pontos, um novo recordeO Ibovespa emplacou sua 14ª sessão consecutiva de alta nesta segunda-feira (10), impulsionado pelo viés positivo no exterior, e renovou suas máximas históricas.
Autor  Pedro Augusto Prazeres
11 Mês 11 Dia Ter
O Ibovespa emplacou sua 14ª sessão consecutiva de alta nesta segunda-feira (10), impulsionado pelo viés positivo no exterior, e renovou suas máximas históricas.
placeholder
Petróleo sobe com geopolítica; Ouro recua levemente mas segura US$ 4.000 com dados de empregoOs contratos futuros de petróleo fecharam em alta nesta terça-feira (18), em uma sessão marcada pela volatilidade. Os preços do WTI para janeiro subiram 1,35%, encerrando a US$ 60,67 o barril na Nymex, enquanto o Brent para o mesmo mês avançou 1,07%, cotado a US$ 64,89 o barril na ICE.
Autor  Pedro Augusto Prazeres
11 Mês 19 Dia Qua
Os contratos futuros de petróleo fecharam em alta nesta terça-feira (18), em uma sessão marcada pela volatilidade. Os preços do WTI para janeiro subiram 1,35%, encerrando a US$ 60,67 o barril na Nymex, enquanto o Brent para o mesmo mês avançou 1,07%, cotado a US$ 64,89 o barril na ICE.
placeholder
Bitcoin (BTC) cai a US$ 80 mil e confirma "Cruz da Morte"; perdas realizadas superam nível do colapso da FTXO Bitcoin (BTC) pode ter confirmado sua entrada oficial em um mercado de baixa ("bear market") após o preço despencar para a região de US$ 80.000 nesta sexta-feira (21). Essa visão pessimista é reforçada por uma convergência rara de indicadores técnicos negativos.
Autor  Pedro Augusto Prazeres
Ontem 01: 48
O Bitcoin (BTC) pode ter confirmado sua entrada oficial em um mercado de baixa ("bear market") após o preço despencar para a região de US$ 80.000 nesta sexta-feira (21). Essa visão pessimista é reforçada por uma convergência rara de indicadores técnicos negativos.
placeholder
Grupo Mateus (GMAT3) estende quedas; CVC (CVCB3) desaba 7,6% com dólar a R$ 5,40 e tensão políticaAs ações do Grupo Mateus (GMAT3) registraram queda pela sétima sessão consecutiva nesta sexta-feira (21). O movimento estende uma sequência negativa que já acumula perdas de cerca de 25% no período.
Autor  Pedro Augusto Prazeres
Ontem 01: 52
As ações do Grupo Mateus (GMAT3) registraram queda pela sétima sessão consecutiva nesta sexta-feira (21). O movimento estende uma sequência negativa que já acumula perdas de cerca de 25% no período.
placeholder
O ouro recua em meio à valorização do dólar americano e ao apetite por risco; potencial de queda parece limitadoO ouro (XAU/USD) atrai novos vendedores durante a sessão asiática desta segunda-feira e recua para abaixo do nível de US$ 4.050 na última hora, embora sem continuidade no movimento.
Autor  FXStreet
20 horas atrás
O ouro (XAU/USD) atrai novos vendedores durante a sessão asiática desta segunda-feira e recua para abaixo do nível de US$ 4.050 na última hora, embora sem continuidade no movimento.
Produtos relacionados
goTop
quote