NZD/JPY Price Analysis: Bullish momentum gains as bears failed to conquer the 20-day SMA

Fonte Fxstreet
  • The NZD/JPY's daily RSI reveals a transition towards positive territory, indicating a growing buying momentum.
  • Both daily and hourly MACD portray a neutral scenario with their flat green bars, neither favoring buyers nor sellers significantly.
  • Buyer's decisive support at the 20-day SMA in recent sessions indicates heightened bullish sentiment within the market.

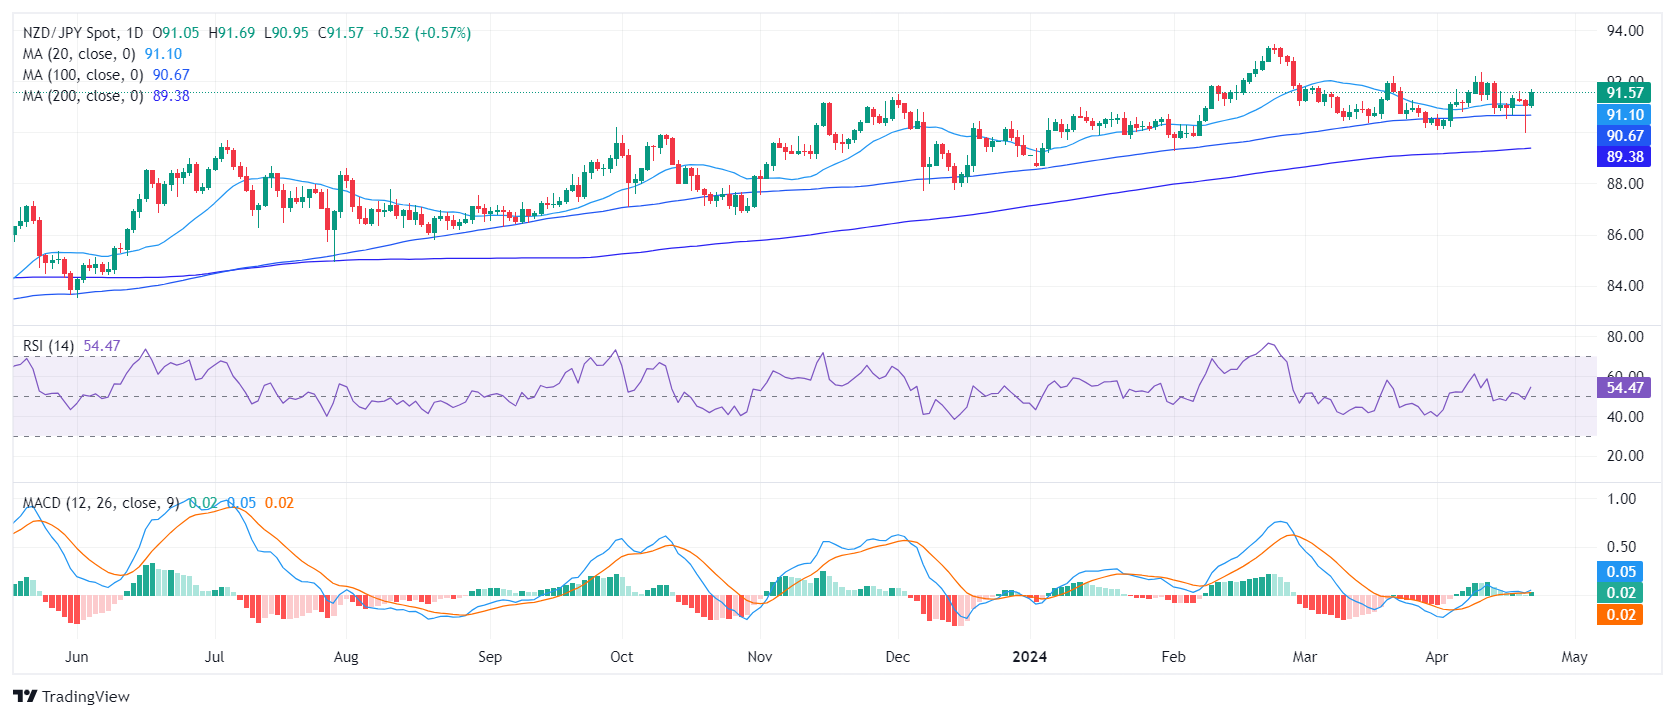
The NZD/JPY rose to 91.59 on Monday and maintains a steady uptrend. Indicators on the daily and hourly charts are favoring the buyers and as the bears failed to breach the 20-day Simple Moving Average (SMA), the outlook remains positive for the short term.

On the daily chart, the Relative Strength Index (RSI) reveals a transition from negative to positive territory, currently at 55. This shift shows a slight bullish momentum, indicating that traders are favoring more buying activities. The Moving Average Convergence Divergence (MACD) histogram exhibits flat green bars, suggesting a neutral momentum, neither favoring buyers nor sellers significantly.

NZD/JPY daily chart
On the hourly chart, the RSI advances further into positive territory, peaking at 64 before slightly receding to 59. This movement signifies that buying activities have intensified during the American session. The MACD continues to exhibit flat green bars, mirroring the neutral momentum indicated on the daily chart.

NZD/JPY hourly chart
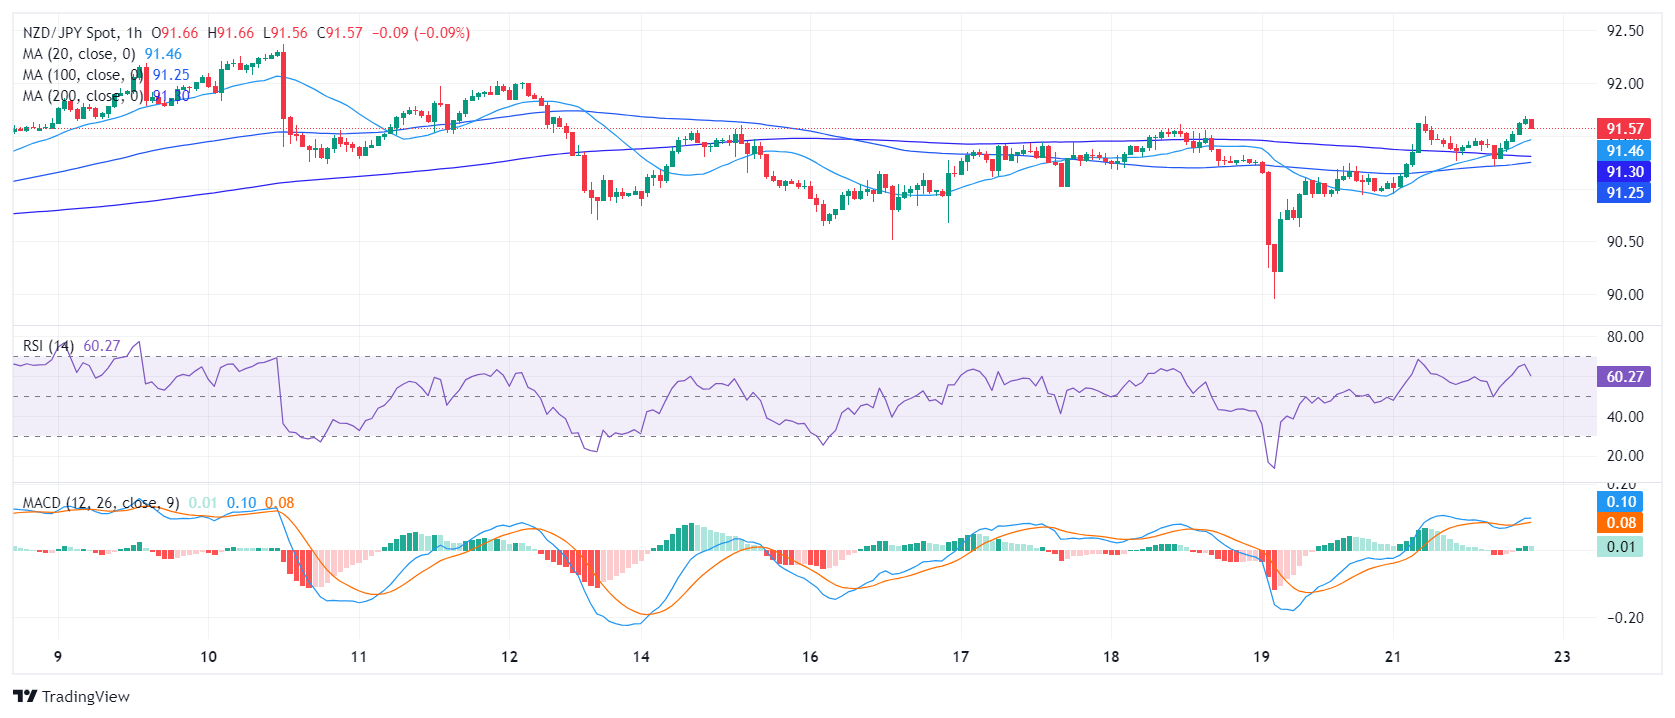
From a broader perspective, the NZD/JPY demonstrates a robust performance by situating above its key Simple Moving Averages (SMA), a technical indicator that averages the currency pair's closing prices over specific periods. Its stance above the 20, 100, and 200-day SMA suggests a consistent uptrend, representing both short-term and long-term strength. In the last sessions, the buyers defended the 20-day SMA at 91.10. This type of decisive support provides further evidence of a bullish sentiment among traders, which could stimulate more upside potential for the NZD/JPY.


NZD/JPY

Overview
Today last price 91.58
Today Daily Change 0.53
Today Daily Change % 0.58
Today daily open 91.05
 
Trends
Daily SMA20 91.07
Daily SMA50 91.42
Daily SMA100 90.67
Daily SMA200 89.36
 
Levels
Previous Daily High 91.32
Previous Daily Low 89.96
Previous Weekly High 91.62
Previous Weekly Low 89.96
Previous Monthly High 92.2
Previous Monthly Low 90.17
Daily Fibonacci 38.2% 90.48
Daily Fibonacci 61.8% 90.8
Daily Pivot Point S1 90.23
Daily Pivot Point S2 89.42
Daily Pivot Point S3 88.88
Daily Pivot Point R1 91.59
Daily Pivot Point R2 92.13
Daily Pivot Point R3 92.95


Isenção de responsabilidade: Apenas para fins informativos. O desempenho passado não é indicativo de resultados futuros.
placeholder
Ibovespa sobe 0,77% e fecha em 155 mil pontos, um novo recordeO Ibovespa emplacou sua 14ª sessão consecutiva de alta nesta segunda-feira (10), impulsionado pelo viés positivo no exterior, e renovou suas máximas históricas.
Autor  Pedro Augusto Prazeres
11 Mês 11 Dia Ter
O Ibovespa emplacou sua 14ª sessão consecutiva de alta nesta segunda-feira (10), impulsionado pelo viés positivo no exterior, e renovou suas máximas históricas.
placeholder
Petróleo sobe com geopolítica; Ouro recua levemente mas segura US$ 4.000 com dados de empregoOs contratos futuros de petróleo fecharam em alta nesta terça-feira (18), em uma sessão marcada pela volatilidade. Os preços do WTI para janeiro subiram 1,35%, encerrando a US$ 60,67 o barril na Nymex, enquanto o Brent para o mesmo mês avançou 1,07%, cotado a US$ 64,89 o barril na ICE.
Autor  Pedro Augusto Prazeres
11 Mês 19 Dia Qua
Os contratos futuros de petróleo fecharam em alta nesta terça-feira (18), em uma sessão marcada pela volatilidade. Os preços do WTI para janeiro subiram 1,35%, encerrando a US$ 60,67 o barril na Nymex, enquanto o Brent para o mesmo mês avançou 1,07%, cotado a US$ 64,89 o barril na ICE.
placeholder
Bitcoin (BTC) cai a US$ 80 mil e confirma "Cruz da Morte"; perdas realizadas superam nível do colapso da FTXO Bitcoin (BTC) pode ter confirmado sua entrada oficial em um mercado de baixa ("bear market") após o preço despencar para a região de US$ 80.000 nesta sexta-feira (21). Essa visão pessimista é reforçada por uma convergência rara de indicadores técnicos negativos.
Autor  Pedro Augusto Prazeres
Ontem 01: 48
O Bitcoin (BTC) pode ter confirmado sua entrada oficial em um mercado de baixa ("bear market") após o preço despencar para a região de US$ 80.000 nesta sexta-feira (21). Essa visão pessimista é reforçada por uma convergência rara de indicadores técnicos negativos.
placeholder
Grupo Mateus (GMAT3) estende quedas; CVC (CVCB3) desaba 7,6% com dólar a R$ 5,40 e tensão políticaAs ações do Grupo Mateus (GMAT3) registraram queda pela sétima sessão consecutiva nesta sexta-feira (21). O movimento estende uma sequência negativa que já acumula perdas de cerca de 25% no período.
Autor  Pedro Augusto Prazeres
Ontem 01: 52
As ações do Grupo Mateus (GMAT3) registraram queda pela sétima sessão consecutiva nesta sexta-feira (21). O movimento estende uma sequência negativa que já acumula perdas de cerca de 25% no período.
placeholder
O ouro recua em meio à valorização do dólar americano e ao apetite por risco; potencial de queda parece limitadoO ouro (XAU/USD) atrai novos vendedores durante a sessão asiática desta segunda-feira e recua para abaixo do nível de US$ 4.050 na última hora, embora sem continuidade no movimento.
Autor  FXStreet
21 horas atrás
O ouro (XAU/USD) atrai novos vendedores durante a sessão asiática desta segunda-feira e recua para abaixo do nível de US$ 4.050 na última hora, embora sem continuidade no movimento.
Produtos relacionados
goTop
quote