
US Dollar Index swings back above 100.00 on potential US-UK trade deal
- The US Dollar Index edges higher and pops back above 100.00 on news about a potential trade deal between the US and the UK.
- With the euphoria due to the possibility of a first trade deal, questions immediately arise about the underlying details.
- The US Dollar Index tests its upside resistance at around a one-month high.
The US Dollar Index (DXY), which tracks the performance of the US Dollar (USD) against six major currencies, extends gains on Thursday following the Federal Reserve (Fed) decision and the upcoming announcement by Donald Trump on a “major trade deal” between the United States (US) and, reportedly, the United Kingdom (UK).
The Dollar sprinted higher since late Wednesday, fueled by the Fed rate decision and comments from Fed Chairman Jerome Powell. The Fed kept its policy rate unchanged at the 4.25%-4.50% range, as expected, while Fed Chairman Powell kept his wait-and-see approach on rates as uncertainty is high and there are risks for a return of inflation. That means the Fed will not cut anytime soon, making the US Dollar stronger with the yield differential between the US and other countries remaining wider in favor of the Greenback as the high-yielder.
The second wave that triggered a surge in the US Dollar came with the announcement of a trade deal between the United States (US) and the United Kingdom (UK). Euphoria on those rumours pushed equities higher across the board and saw the US Dollar advance against most major peers. The announcement by US President Donald Trump is expected around 14:00 GMT.
Daily digest market movers: Data on the background
- Several traders and analysts are expressing concerns about the trade deal between the UK and the US. Generally, a solid trade deal on several topics and sectors takes years to negotiate and be ratified by both involved parties’ first. The tail risk here is that this could only be a deal in principle or even a simple exchange of goods without any details or concrete action as of yet, Bloomberg reports.
- The Trump administration is looking into cancelling or ignoring former President Biden’s chip act, which limits US exports of chips from ASML, AMD and Nvidia. The news that the Trump administration is considering overturning the order is seeing a surge in the Nasdaq Futures pre-market.
- At 12:30 GMT, the US weekly Jobless Claims data are due. Expectations are for the Initial Claims to dip to 230,000 against the previous 241,000. The Continuing Claims are seen edging lower to 1.89 million, from 1.916 million.
- At 14:00 GMT, US President Trump will deliver a speech regarding the expected UK trade deal.
- Equities are surging across the board, with European equities up 1%, while US Futures are seeing the Nasdaq leading the charge, up over 1%.
- The CME FedWatch tool shows the chance of an interest rate cut by the Federal Reserve in June’s meeting at 20.2%. Further ahead, the July 30 decision sees odds for rates being lower than current levels at 66.4%.
- The US 10-year yields trade around 4.30%, not really moving much after the Fed and trade deal announcements.
US Dollar Index Technical Analysis: A break or again a dud?
The US Dollar Index (DXY) has quickly sprinted back to above 100.00 in a boost of positivity following the trade deal headlines. First, this is one of the smallest trade deals possible because the UK isn’t the main problem for the large US trade deficit in goods. Secondly, a trade deal with still a lot of blanks to get filled in – or a very minor deal on just one sector or one agricultural item – will raise the question of whether the billions in revenue promised by Trump will actually be received.
On the upside, the DXY’s first resistance comes in at 100.22, a level that supported the Index in September 2024. A firm recovery would be a return to 101.90, which acted as a pivotal level throughout December 2023 and as a base for the inverted head-and-shoulders (H&S) formation during the summer of 2024.
On the other hand, the 97.73 support could quickly be tested on any substantial bearish headline. Further below, a relatively thin technical support comes in at 96.94 before looking at the lower levels of this new price range. These would be at 95.25 and 94.56, meaning fresh lows not seen since 2022.
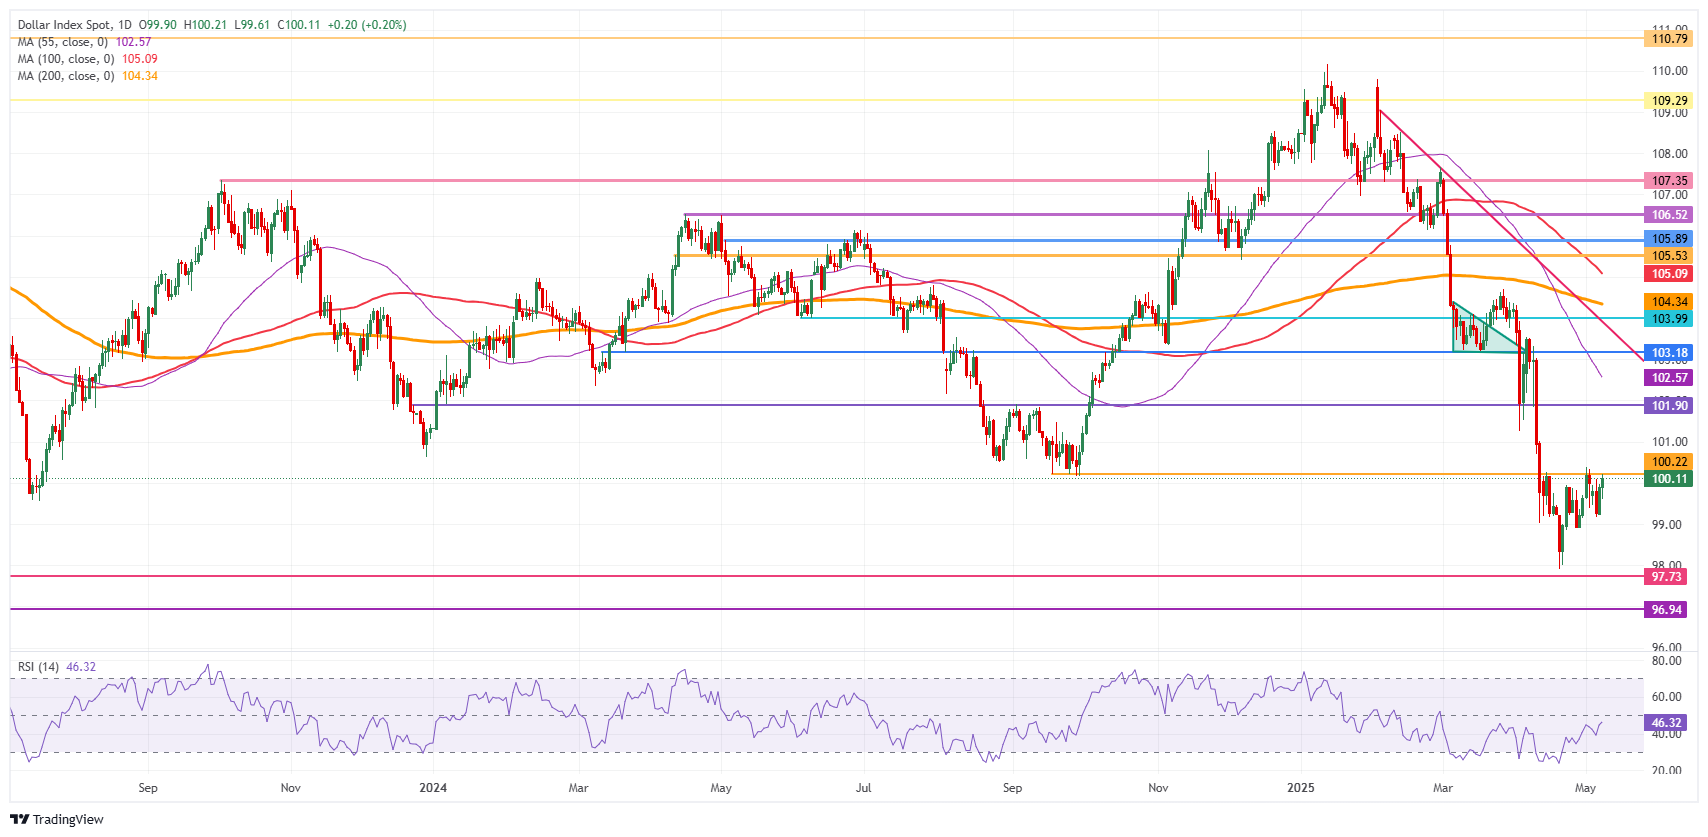
US Dollar Index: Daily Chart
US-China Trade War FAQs
Generally speaking, a trade war is an economic conflict between two or more countries due to extreme protectionism on one end. It implies the creation of trade barriers, such as tariffs, which result in counter-barriers, escalating import costs, and hence the cost of living.
An economic conflict between the United States (US) and China began early in 2018, when President Donald Trump set trade barriers on China, claiming unfair commercial practices and intellectual property theft from the Asian giant. China took retaliatory action, imposing tariffs on multiple US goods, such as automobiles and soybeans. Tensions escalated until the two countries signed the US-China Phase One trade deal in January 2020. The agreement required structural reforms and other changes to China’s economic and trade regime and pretended to restore stability and trust between the two nations. However, the Coronavirus pandemic took the focus out of the conflict. Yet, it is worth mentioning that President Joe Biden, who took office after Trump, kept tariffs in place and even added some additional levies.
The return of Donald Trump to the White House as the 47th US President has sparked a fresh wave of tensions between the two countries. During the 2024 election campaign, Trump pledged to impose 60% tariffs on China once he returned to office, which he did on January 20, 2025. With Trump back, the US-China trade war is meant to resume where it was left, with tit-for-tat policies affecting the global economic landscape amid disruptions in global supply chains, resulting in a reduction in spending, particularly investment, and directly feeding into the Consumer Price Index inflation.
추천 기사


