
GBP/USD rises past 1.3350 as traders brace for Fed, BoE rate decisions
- Sterling extends gains as weaker US trade balance and tariff impact weigh on Dollar.
- Markets expect Fed to hold and BoE to cut 25 bps this week; 75 bps of easing seen from both in 2025.
- GBP/USD hits 1.3402 intraday high as UK markets reopen and risk sentiment improves.
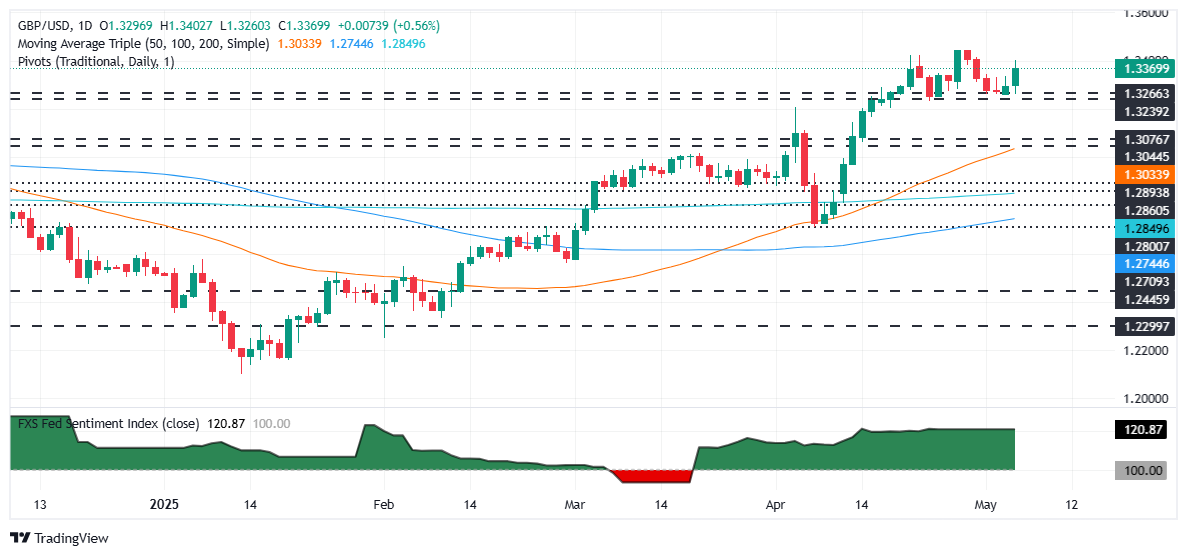
The Pound Sterling advanced for the second consecutive day, gaining over 0.65% against the US Dollar amid a scarce economic docket on both sides of the Atlantic. Major central banks like the Federal Reserve and the Bank of England (BoE) are preparing for their policy meetings. At the time of writing, the GBP/USD trades at 1.3381 shy of the 1.34 mark.
GBP/USD edges up amid light data, widening US trade deficit, and rising bets on synchronized central bank easing
US trade-related news continued to grab the headlines. US Treasury Secretary Scott Bessent said the US is negotiating with 17 trading partners but not yet with China. He said that some deals could be announced during the week.
Data-wise, the US trade deficit widened in March, boosted by businesses' imports of goods before the effect of enacted US President Donald Trump’s tariffs. The US Commerce Department revealed that the Balance of Trade came at $-140 billion more than the $-137 billion expected and exceeded February’s $-123.2 billion print. Reuters revealed that “Imports from China were, however, the lowest in five years and could drop further as Trump has hiked duties on Chinese goods to a staggering 145%.”
After the data, GBP/USD extended its uptrend, hitting a daily high of 1.3402 as UK markets re-opened from a long weekend holiday.
Traders bracing for Fed, BoE meetings
On Wednesday, the Federal Reserve is expected to keep rates unchanged, but traders will eye Fed Chair Jerome Powell's post-meeting press conference. A day later, the Bank of England (BoE) is foreseen to reduce rates by 25 basis points (bps), giving the Fed the upper hand regarding the interest rate differential.
Nevertheless, the interest rate parity is expected to remain unchanged for the whole year. Markets are pricing 75 basis points of easing by the Fed, the same amount as the BoE.
GBP/USD Price Forecast: Technical outlook
The GBP/USD uptrend remains in place, but a possible ‘head and shoulders’ chart pattern is looming as buyers seem to be losing some steam as the major approaches 1.34. A daily close above the latter could sponsor a retest of the year-to-date (YTD) high of 1.3443, negating the ‘head and shoulders’ bearish chart pattern.
Conversely, if GBP/USD tumbles beneath 1.3300, look for a test of the latest swing low seen on May 5 at 1.3257. If cleared, this could be the first sign of the ‘head and shoulders’ confirmation and pave the way to test lower prices. The immediate support would be 1.3200, followed by the 50-day Simple Moving Average (SMA) at 1.3030.
British Pound PRICE This week
The table below shows the percentage change of British Pound (GBP) against listed major currencies this week. British Pound was the strongest against the US Dollar.
| USD | EUR | GBP | JPY | CAD | AUD | NZD | CHF | |
|---|---|---|---|---|---|---|---|---|
| USD | -0.12% | -0.81% | -1.29% | -0.16% | -0.50% | -0.91% | -0.22% | |
| EUR | 0.12% | -0.42% | -0.92% | 0.23% | -0.10% | -0.52% | 0.17% | |
| GBP | 0.81% | 0.42% | -0.73% | 0.64% | 0.31% | -0.11% | 0.59% | |
| JPY | 1.29% | 0.92% | 0.73% | 1.15% | 0.81% | 0.47% | 1.20% | |
| CAD | 0.16% | -0.23% | -0.64% | -1.15% | -0.63% | -0.75% | -0.05% | |
| AUD | 0.50% | 0.10% | -0.31% | -0.81% | 0.63% | -0.42% | 0.29% | |
| NZD | 0.91% | 0.52% | 0.11% | -0.47% | 0.75% | 0.42% | 0.69% | |
| CHF | 0.22% | -0.17% | -0.59% | -1.20% | 0.05% | -0.29% | -0.69% |
The heat map shows percentage changes of major currencies against each other. The base currency is picked from the left column, while the quote currency is picked from the top row. For example, if you pick the British Pound from the left column and move along the horizontal line to the US Dollar, the percentage change displayed in the box will represent GBP (base)/USD (quote).
추천 기사


