


Crypto Today: Bitcoin, Ethereum, XRP extend losses as bears tighten their grip
- Bitcoin bears gain ground as spot price hovers below $68,000 on Friday.
- Ethereum tests lows below $2,000, reflecting broader risk-off sentiment in the crypto market.
- XRP sell-off persists for the ninth consecutive day, with the token delicately holding above $1.00.
Bitcoin's (BTC) sell-off deepens on Friday, with the spot price below $69,000. The largest crypto by market capitalization leads the intense selling, with Ethereum (ETH) below $2,000 and Ripple (XRP) hovering just above $1.00.
Oversold conditions don't appear to be easing the pressure, which has persisted since the $6.3 billion Binance hack and the United States (US) midterm elections.
Risk-off sentiment persists
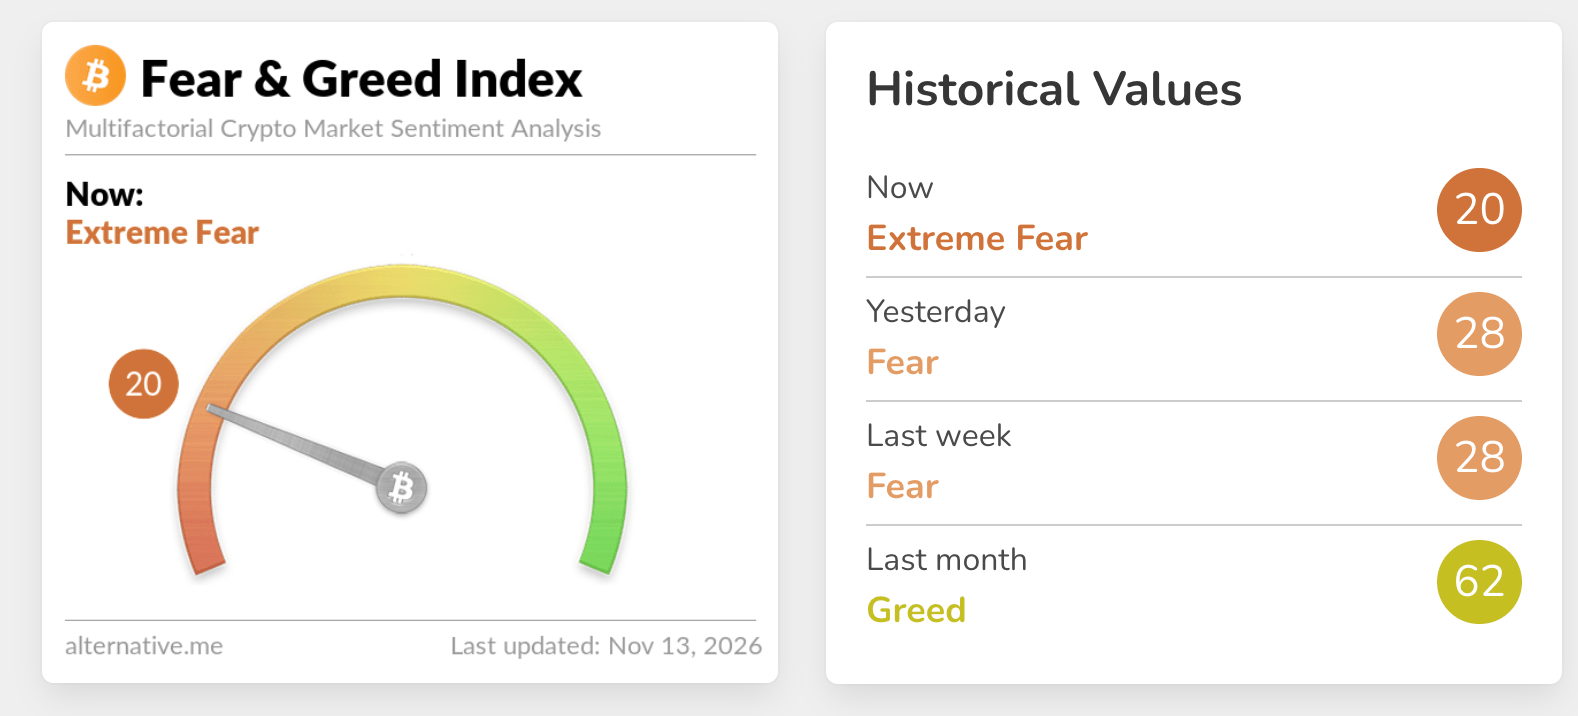
The broader cryptocurrency market is seeing subdued interest, as reflected in the Fear & Greed Index at 20 in the Fear territory on Friday, down from 20 in the Extreme Fear range the day before. This outlook suggests investors are retreating to the sidelines and repositioning portfolios amid sticky US inflation.
The Federal Reserve (Fed) is widely expected to hike interest rates by 25 basis points in December to the 3.75-4.00% range. The Fed remains committed to lowering inflation in the world’s largest economy to the long-term 2% target. Stricter monetary policy rarely favors risk assets, which could weigh on market sentiment and reduce the odds of a steady recovery.
Technical analysis: Bitcoin sell-off seems unstoppable
Bitcoin trades at $68,603, extending a bearish near-term bias as price holds well below the key Exponential Moving Averages (EMAs). The 200-day EMA around $76,309 forms the first significant topside cap, with the SuperTrend at $77,026 and the 100-day EMA near $77,194 reinforcing a dense overhead supply zone. The 50-day EMA higher up at $78,220 suggests that any recovery would still face layered resistance.
Momentum remains stressed, with the Moving Average Convergence Divergence (MACD) line deep in negative territory and below its signal line, while the Relative Strength Index (RSI) at 25 sits in oversold conditions, hinting that while selling pressure dominates, scope for a corrective bounce is growing.
A daily close back above the 200-day EMA at $76,309 would be the first sign of stabilization, opening the way toward the SuperTrend barrier at $77,026 and the 100-day EMA at $77,194 as subsequent resistance levels. Only a sustained move above the 50-day EMA at $78,220 would start to weaken the current bearish structure.
On the downside, with no nearby indicator-derived supports, the focus stays on price action and prior lows, where failure to build a floor above the $68,000 area would keep BTC exposed to further declines before any oversold rebound can gain traction.
Ethereum technical analysis: ETH sellers retain control
Ethereum trades at $1,937, extending its decline and holding firmly below the key moving averages, which keeps the near-term bias bearish. The 50-day EMA at $2,319, the 100-day EMA at $2,312, and the 200-day EMA at $2,293 all sit overhead, reinforcing a capped structure, while the SuperTrend line at $2,253 marks the first technical barrier.
Momentum remains weak, as the MACD stays below zero, while the RSI at 25 signals oversold territory, hinting at stretched bearish pressure but not yet a clear reversal.
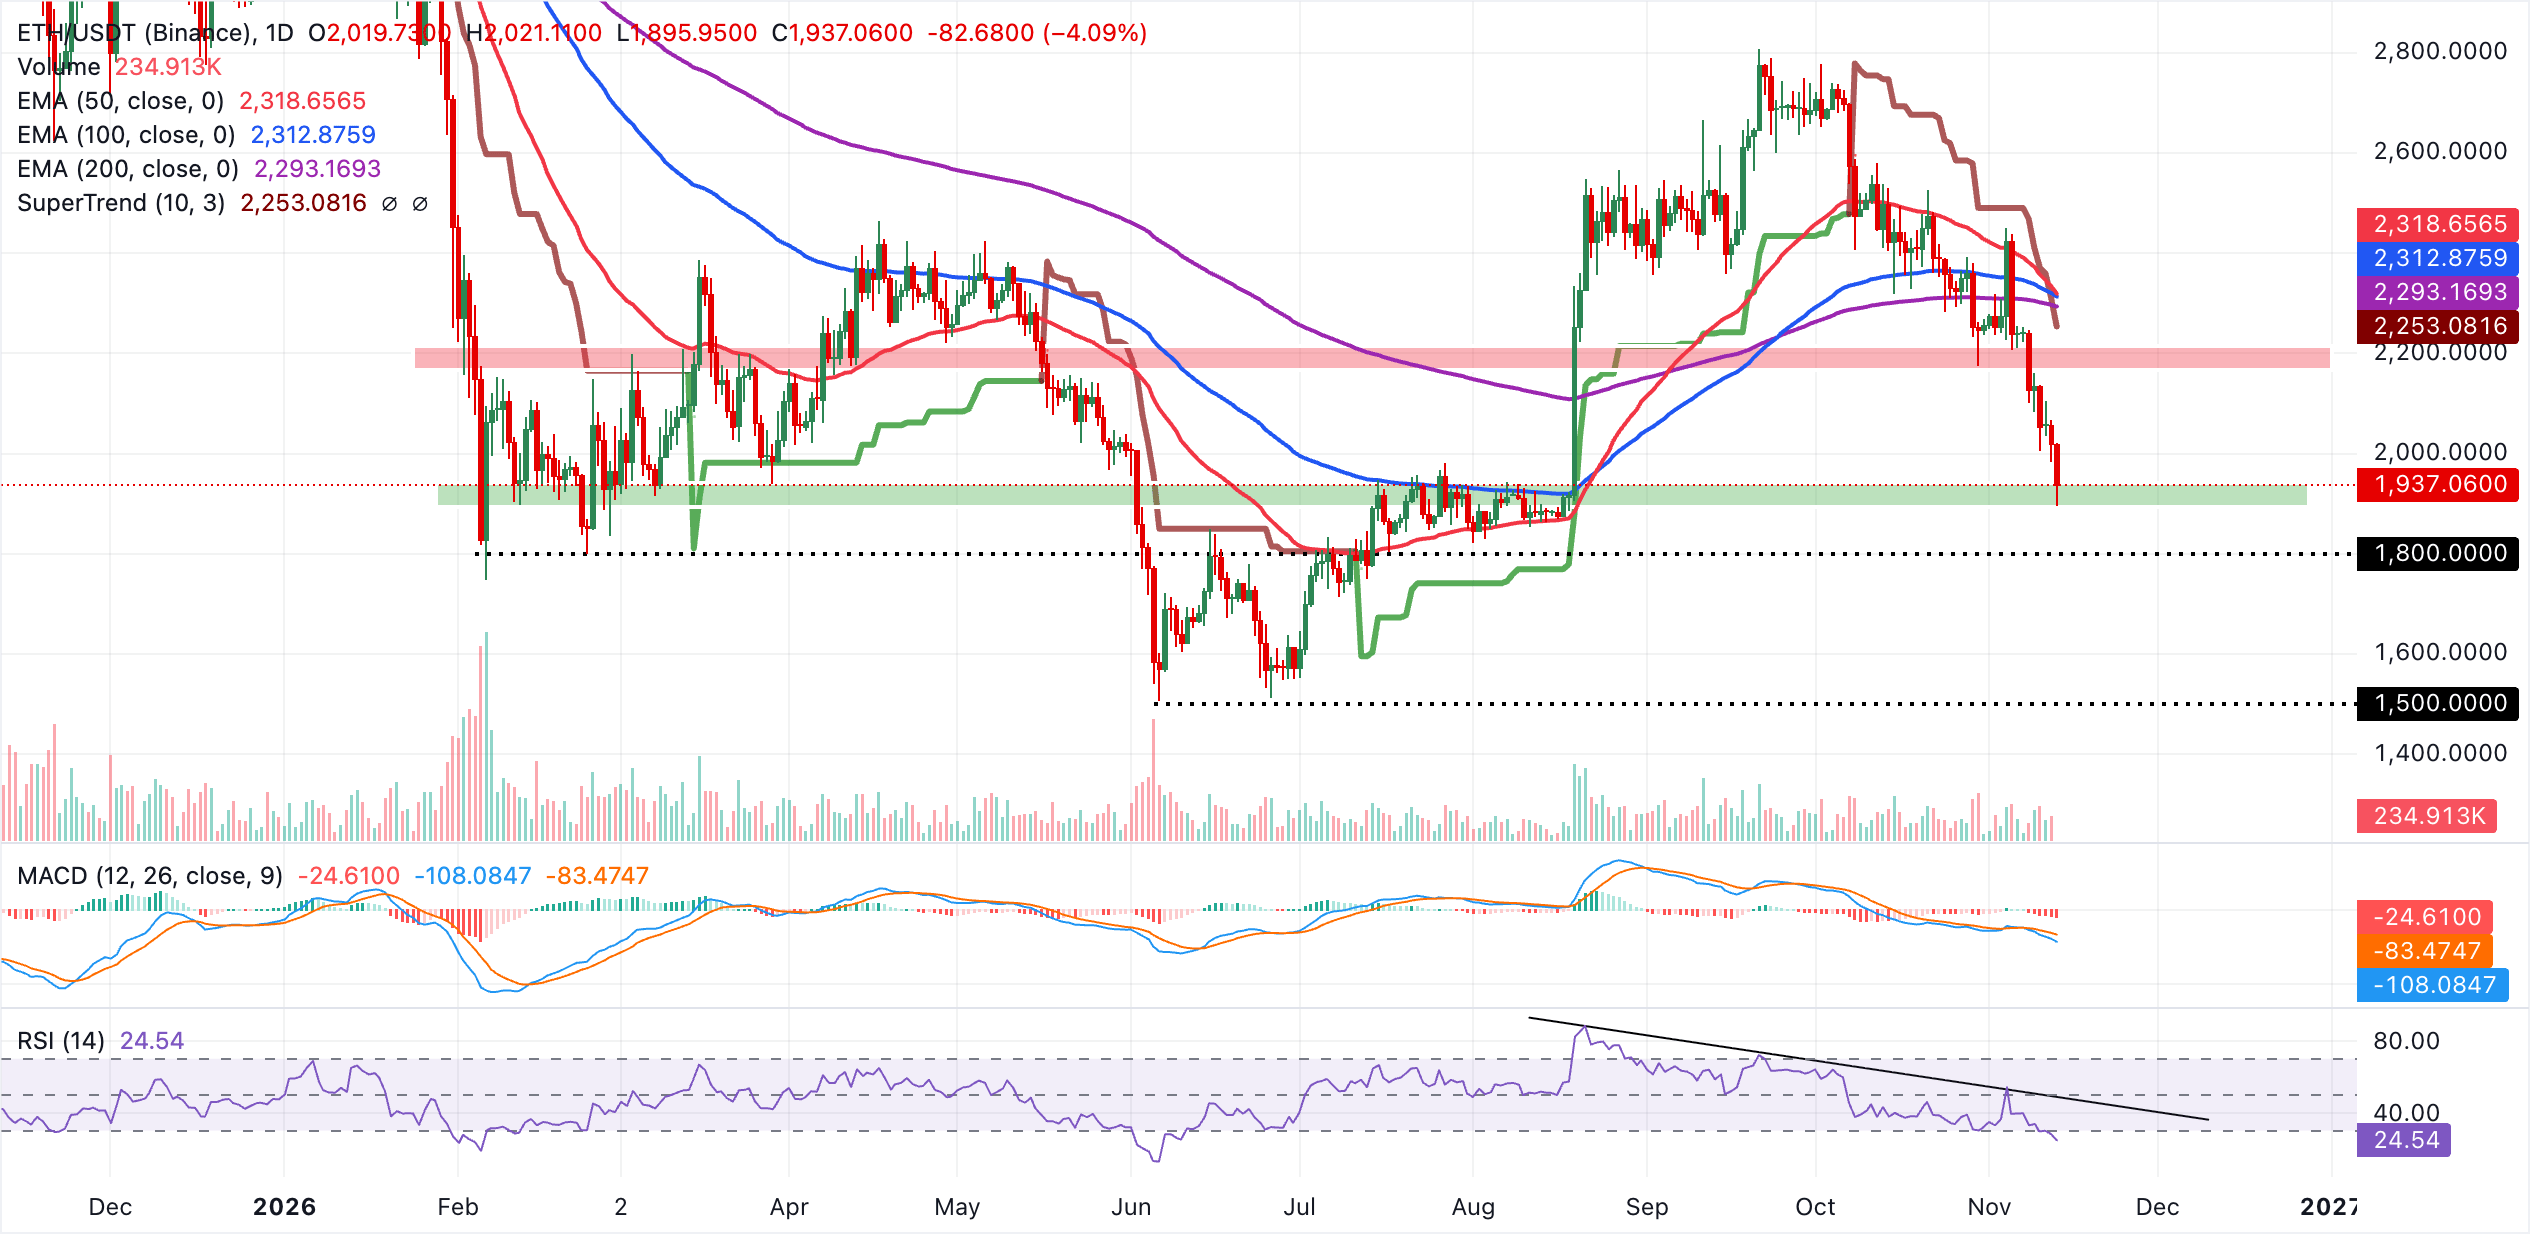
Initial resistance lies at the SuperTrend level around $2,253, followed by the 200-day EMA at $2,293, which would need to be decisively reclaimed to ease the current downside bias. Higher up, the 100-day EMA at $2,313 and the 50-day EMA at $2,319 form a dense resistance cluster that would likely cap any recovery attempts unless buyers gain significant traction.
The lack of clearly defined indicator-based supports leaves the recent low near the current price as a soft reference floor, suggesting that a failure to stabilize above $1,937 could open the door to further weakness as sellers remain in control.
Technical analysis: XRP trades under heavy selling pressure
XRP trades at $1.03, extending its slide well below the main moving averages and the broken downward trendline, which keeps the near-term bias firmly bearish. Price holds under the 50-day EMA at $1.26, the 100-day EMA at $1.29 and the 200-day EMA at $1.34, while the SuperTrend at $1.19 continues to track overhead, suggesting rallies remain vulnerable to selling.
Momentum is weak, with the RSI stuck in oversold territory near 22, and the MACD line below zero with a negative, slightly contracting histogram, hinting at persistent downside pressure with only limited scope for a corrective bounce.
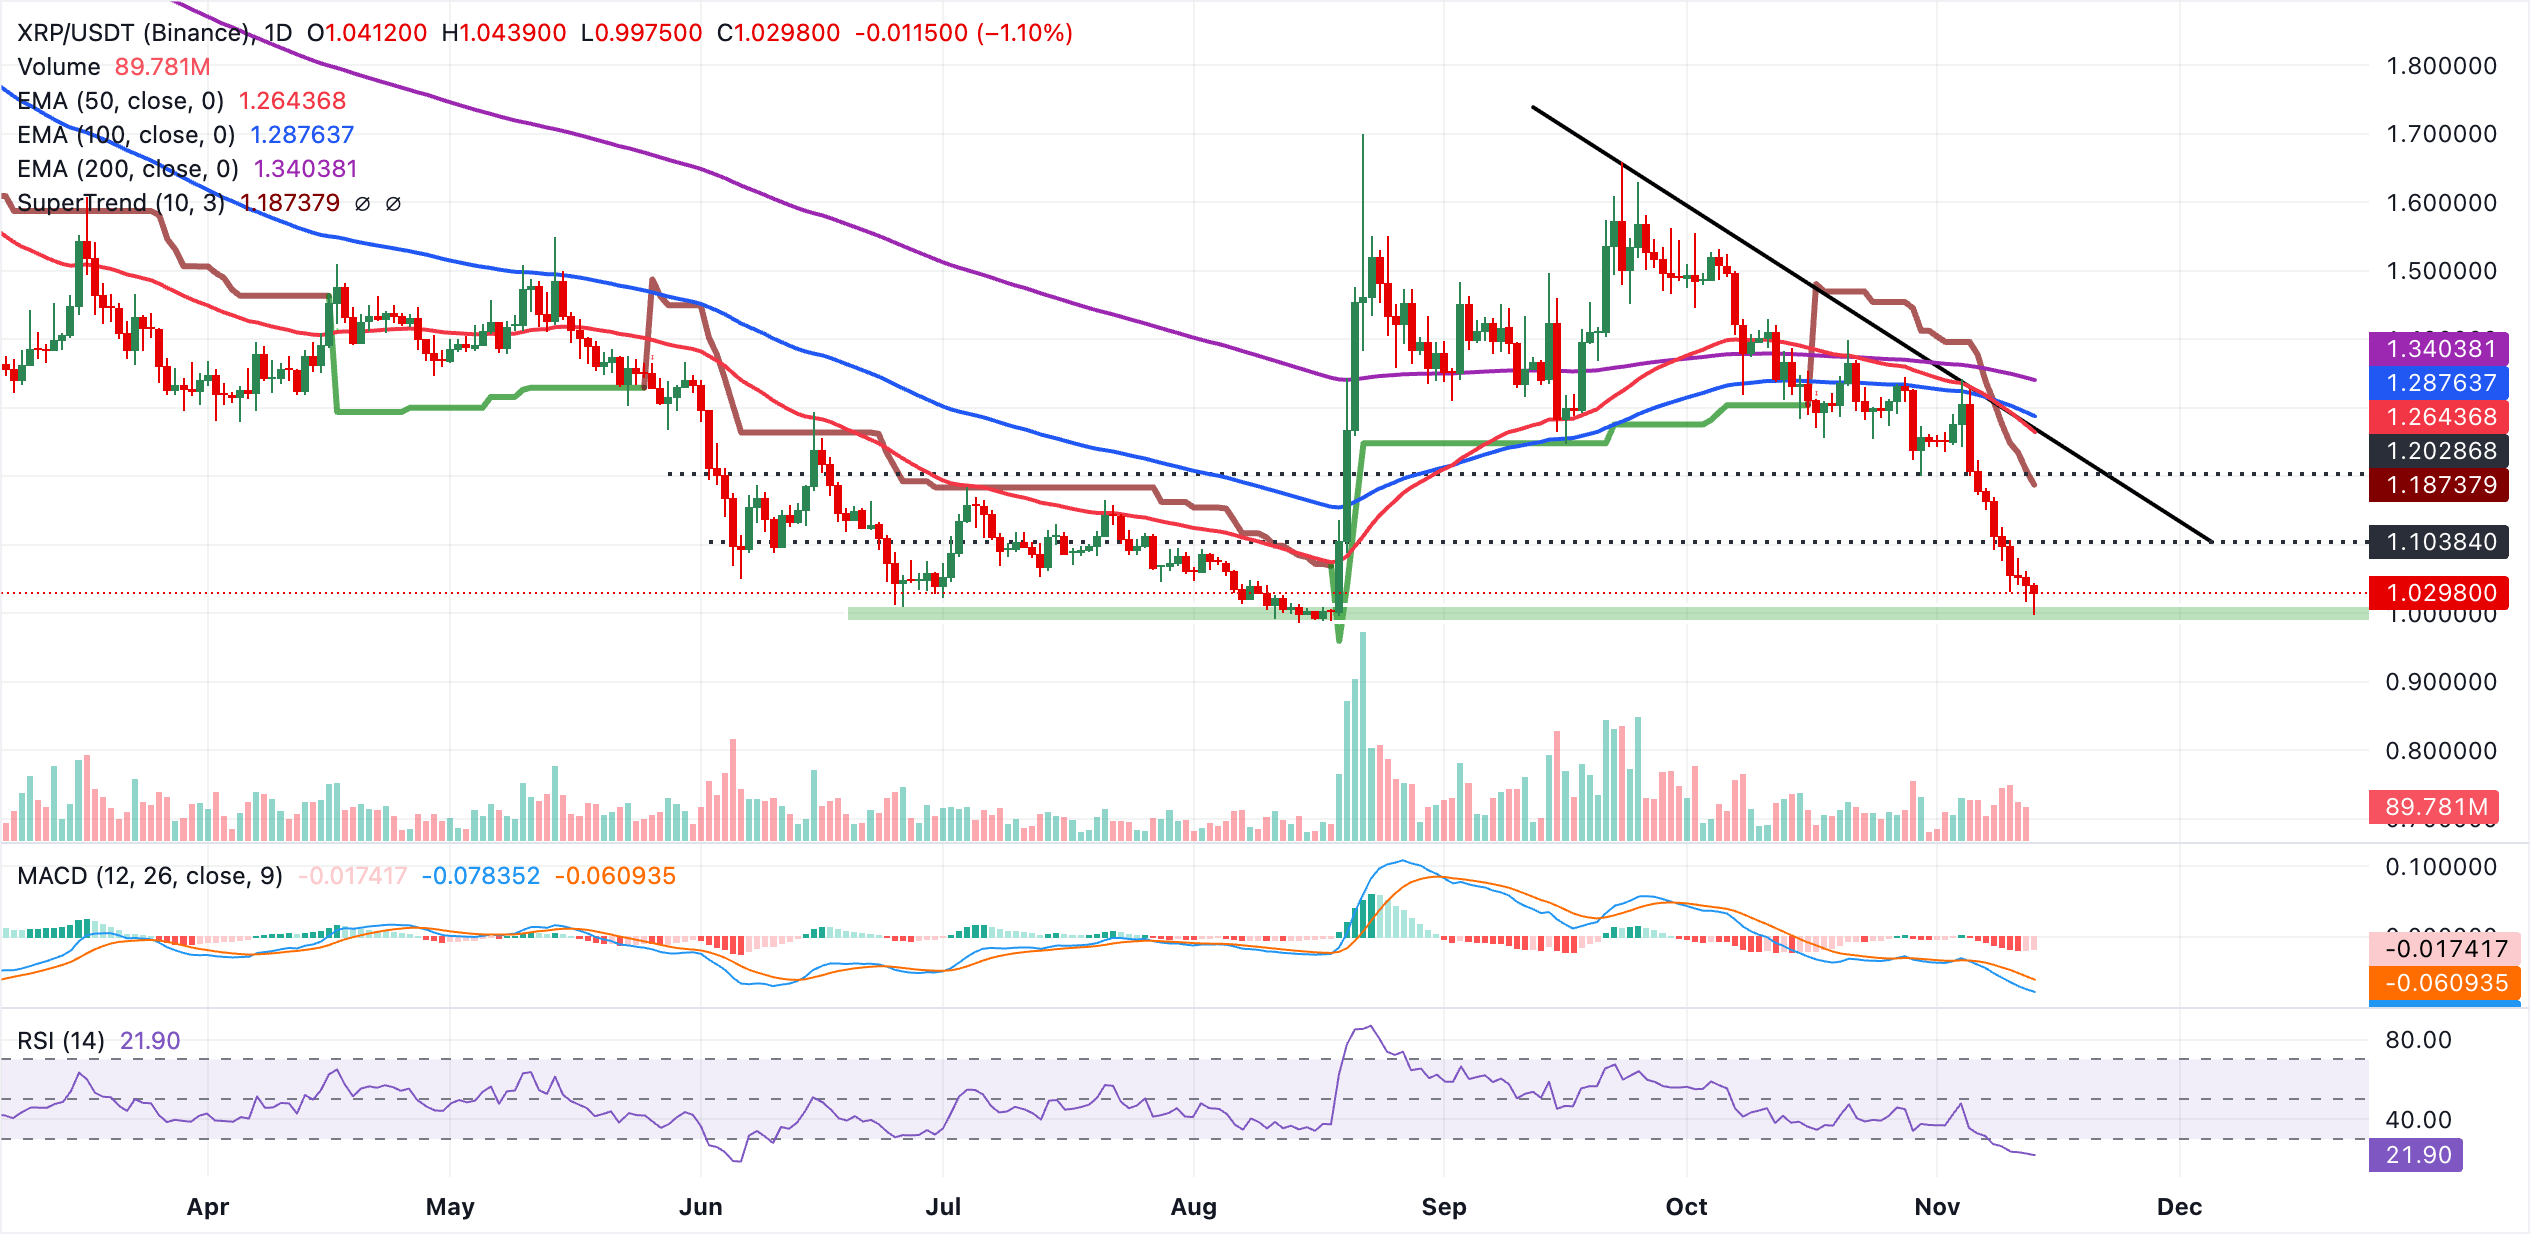
Immediate resistance lies at the SuperTrend level around $1.19, ahead of a dense confluence formed by the 50-day EMA at $1.26 and the prior trendline break level at $1.27. Above this cluster, the 100-day EMA at $1.29 and the longer-term 200-day EMA at $1.34 are likely to cap any recovery attempts while price trades beneath them.
With no clear structural support defined by the current indicator set below spot on the daily chart, traders should monitor emerging price action for signs of base-building before expecting a sustainable reversal of the prevailing bearish trend.
(The technical analysis of this story was written with the help of an AI tool. Know more.)
Bitcoin, altcoins, stablecoins FAQs
Bitcoin is the largest cryptocurrency by market capitalization, a virtual currency designed to serve as money. This form of payment cannot be controlled by any one person, group, or entity, which eliminates the need for third-party participation during financial transactions.
Altcoins are any cryptocurrency apart from Bitcoin, but some also regard Ethereum as a non-altcoin because it is from these two cryptocurrencies that forking happens. If this is true, then Litecoin is the first altcoin, forked from the Bitcoin protocol and, therefore, an “improved” version of it.
Stablecoins are cryptocurrencies designed to have a stable price, with their value backed by a reserve of the asset it represents. To achieve this, the value of any one stablecoin is pegged to a commodity or financial instrument, such as the US Dollar (USD), with its supply regulated by an algorithm or demand. The main goal of stablecoins is to provide an on/off-ramp for investors willing to trade and invest in cryptocurrencies. Stablecoins also allow investors to store value since cryptocurrencies, in general, are subject to volatility.
Bitcoin dominance is the ratio of Bitcoin's market capitalization to the total market capitalization of all cryptocurrencies combined. It provides a clear picture of Bitcoin’s interest among investors. A high BTC dominance typically happens before and during a bull run, in which investors resort to investing in relatively stable and high market capitalization cryptocurrency like Bitcoin. A drop in BTC dominance usually means that investors are moving their capital and/or profits to altcoins in a quest for higher returns, which usually triggers an explosion of altcoin rallies.
추천 기사


