


Ripple and Stellar outlook: XRP rally cools, XLM heads toward a make-or-break support
- XRP is near key 200-day EMA support on Thursday after slipping slightly so far this week.
- XLM gravitates toward the key support at $0.177, if it holds, it supports a recovery.
- Mixed derivatives and on-chain metrics cap upside for both altcoins.
Ripple (XRP) and Stellar (XLM) trade under pressure on Thursday after losing over 2% and 3% so far this week. XRP and XLM are both nearing their crucial support zones, which could determine the next directional move. Meanwhile, mixed derivatives and on-chain data suggest upside potential remains limited for both altcoins.
On-chain data shows a slight bearish tilt
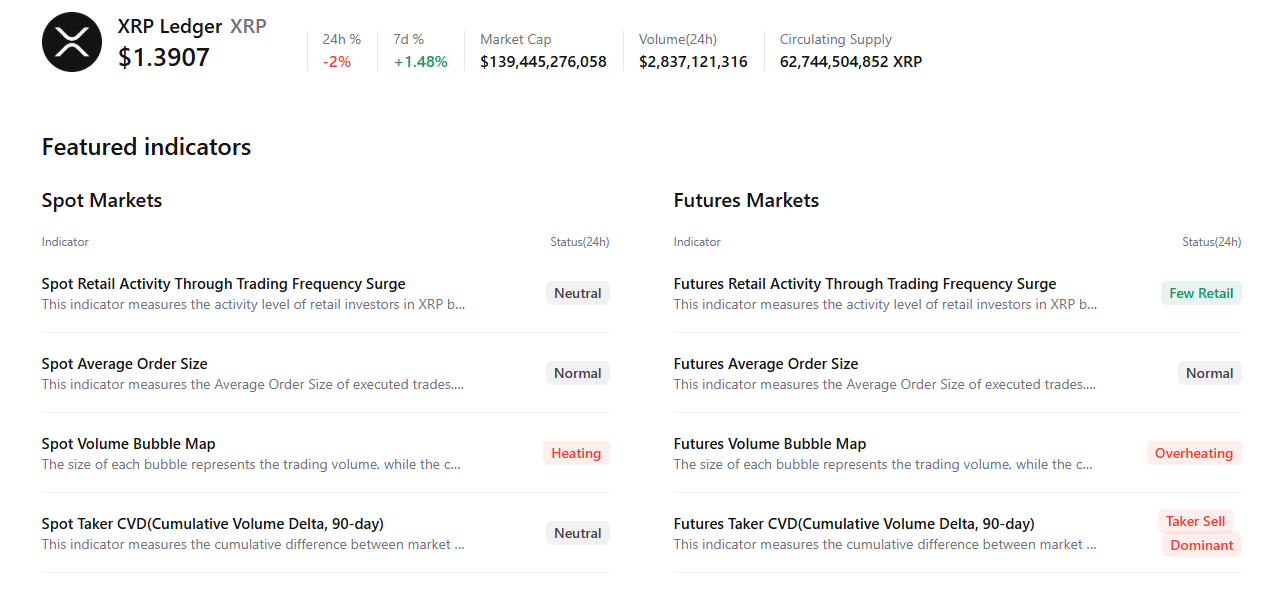
CryptoQuant’s summary data shows cautious signs for both altcoins. XRP’s futures markets show overheating conditions and sell-side dominance, while a few retail traders are active. The spot market also shows heating conditions while other metrics remain neutral, highlighting a bearish, cautious sentiment bias among Ripple traders.
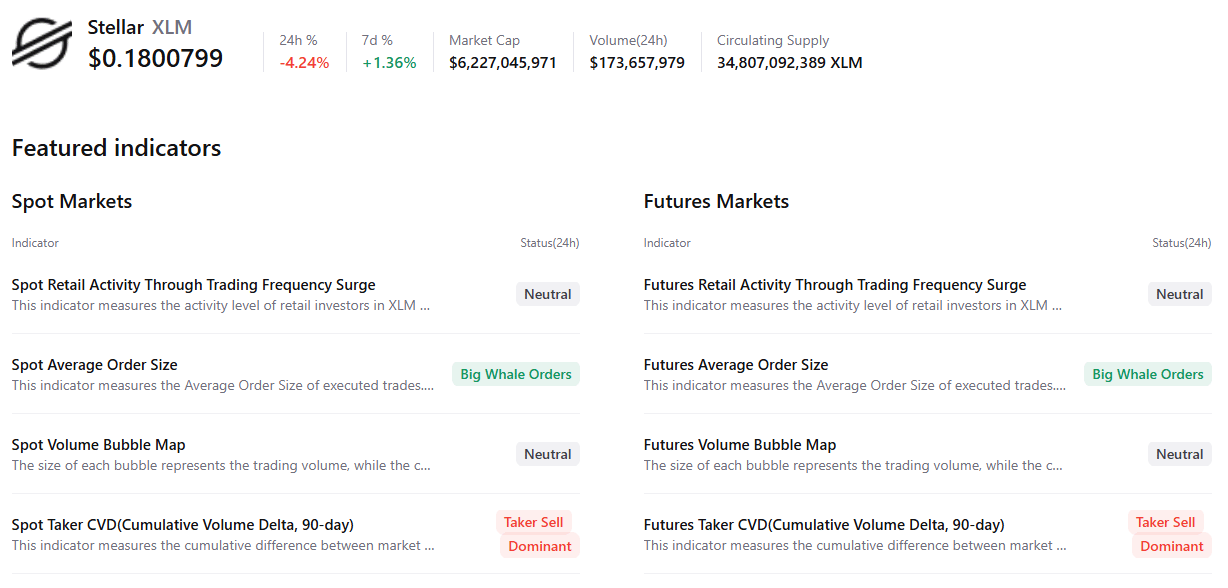
For XLM, spot and futures markets show large whale orders; however, it also shows sell-side dominance, indicating a negative outlook among Stellar traders.
Derivatives metrics show mixed outlook
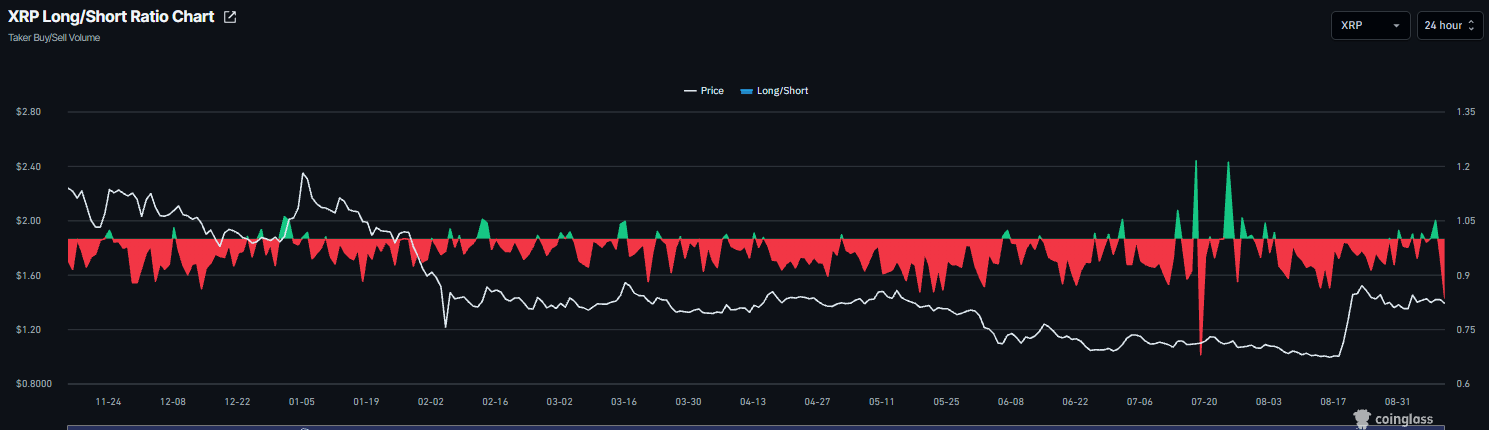
Derivatives data shows a mixed outlook among XRP and XLM traders. CoinGlass’ long-to-short ratios for Ripple read 0.83 on Tuesday, nearing its lowest level in a month. A ratio below one indicates bearish sentiment, as traders bet that asset prices will fall.
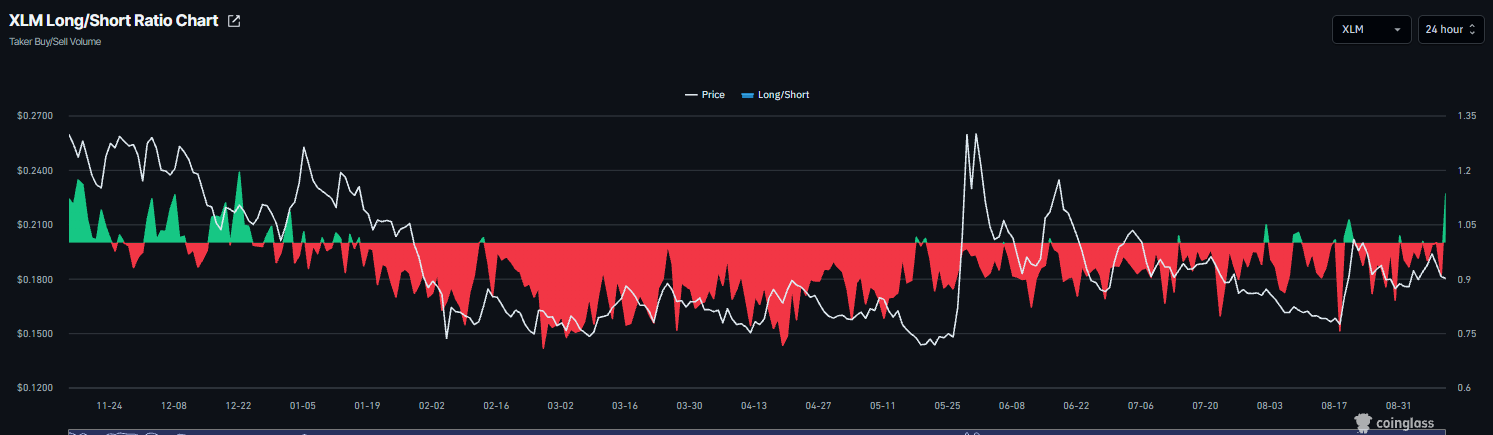
Meanwhile, XLM’s ratio read 1.13 on Thursday, nearing its highest level in a month. A ratio above one indicates bullish sentiment, as traders bet that asset prices will rise.
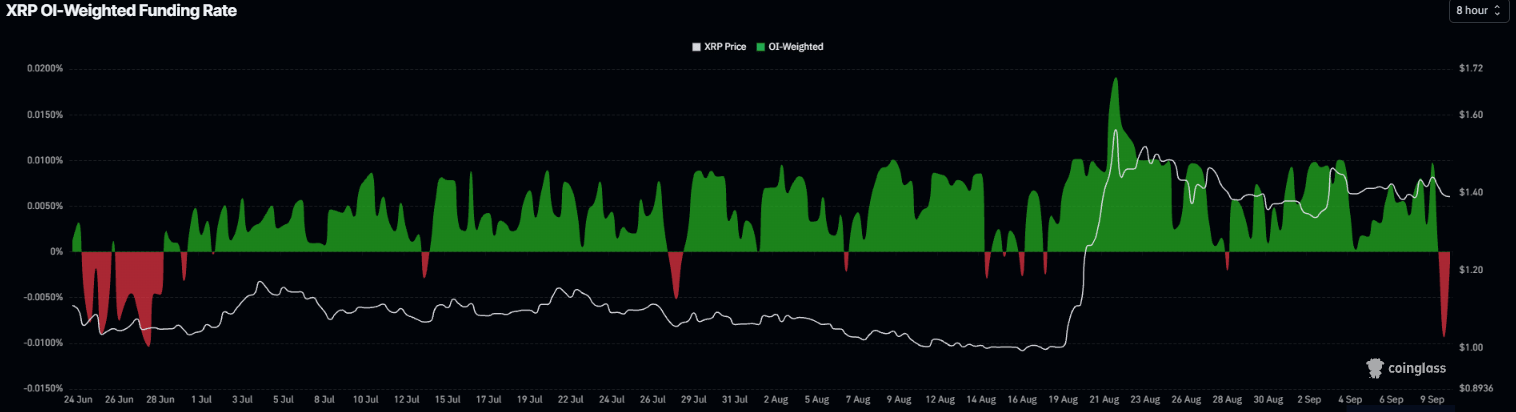
In addition, the XRP funding rate flipped negative on Wednesday, reading -0.0012% on Thursday. This indicates shorts are paying longs, reflecting a bearish outlook for XRP.
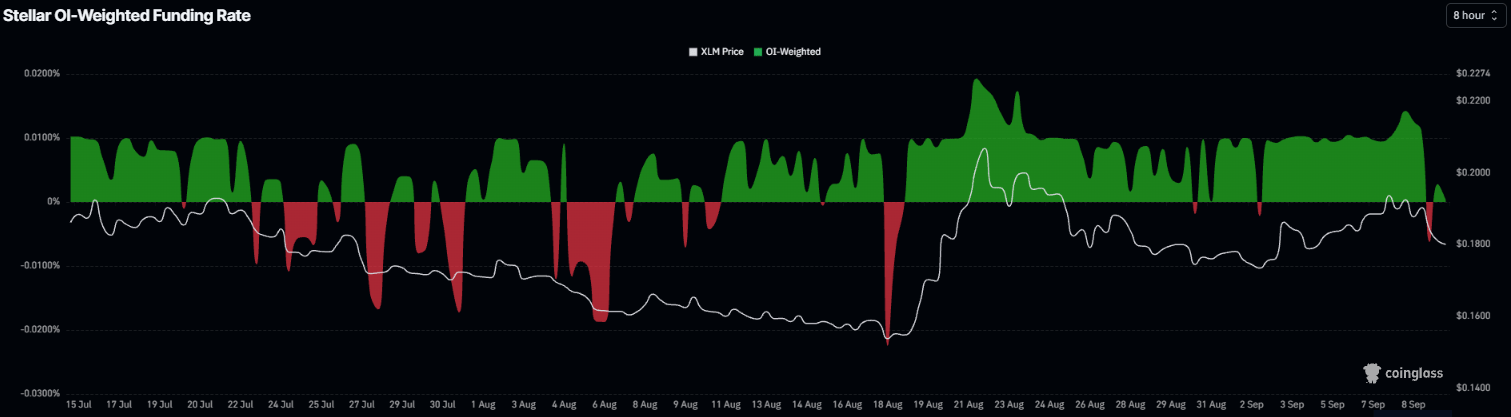
Meanwhile, the XLM funding rate is gravitating toward negative territory, reading 0.003%. If the rate turns negative, it could signal growing bearish sentiment among XLM traders.
XRP technical outlook: Heads toward the key 200-day EMA
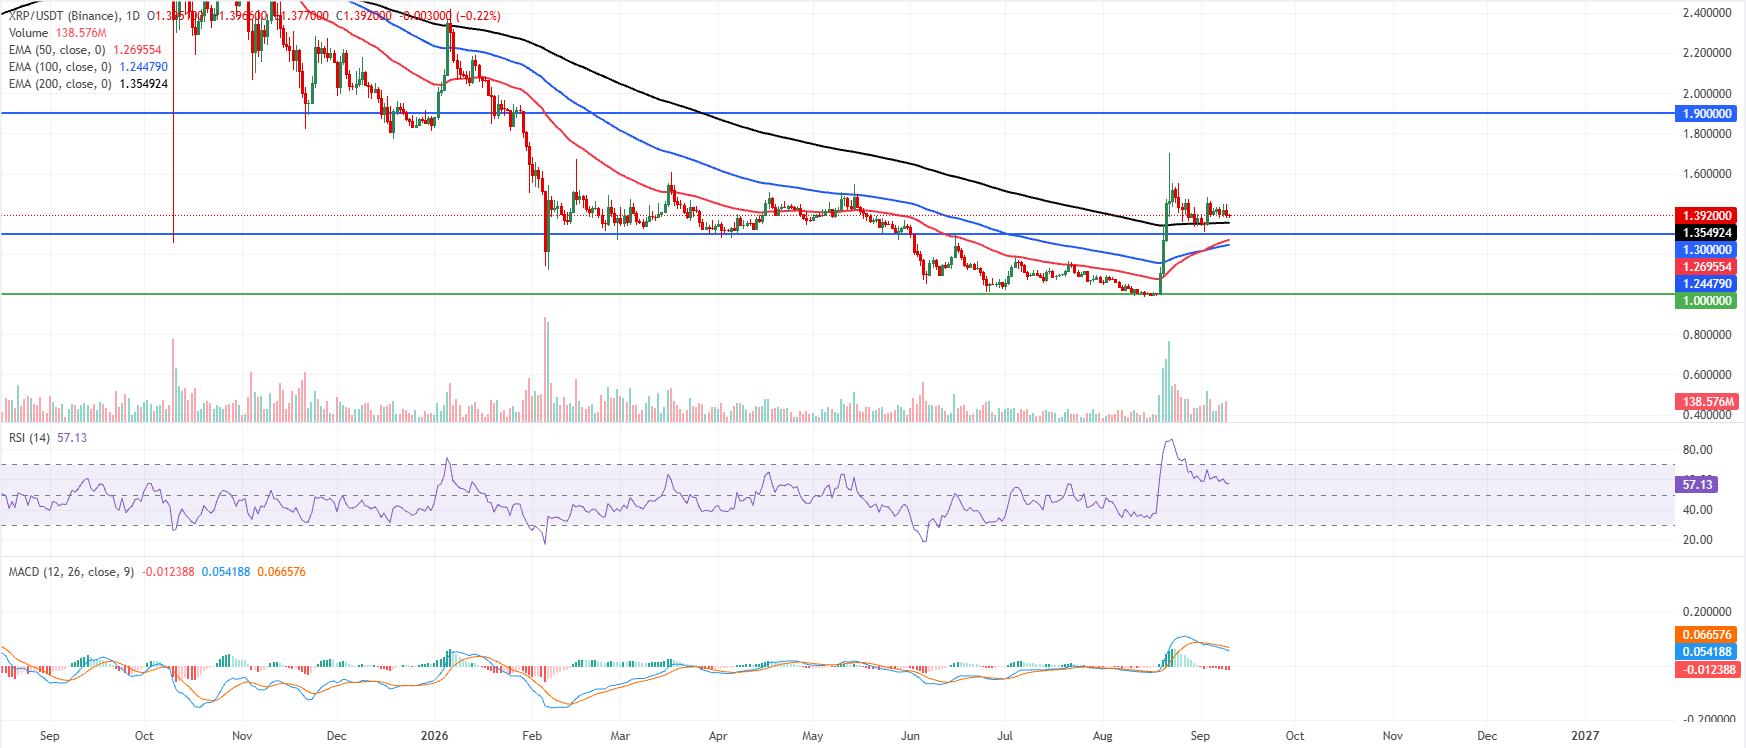
XRP trades at $1.392 on Thursday after falling over 2% so far this week. Despite this correction, XRP holds above the 50-day, 100-day, and 200-day Exponential Moving Averages (EMAs), clustered between roughly $1.244 and $1.354, reinforcing a constructive near-term bias as long as these dynamic floors hold.
The Relative Strength Index (RSI) hovers in the mid-50s, hinting at moderated bullish momentum, while the Moving Average Convergence Divergence (MACD) line sits below the zero line, suggesting upside is losing some traction even as price stays supported by the underlying trend structure.
On the downside, initial support is seen at the 200-day EMA near $1.354, with further cushions at the horizontal level around $1.300 and the 50-day and 100-day EMAs just beneath, before a more distant floor near $1.000.
On the topside, the next notable resistance comes at the prior horizontal cap around $1.900, and a daily close above that barrier would be needed to reopen a stronger bullish extension despite the current slowdown in momentum.
XLM technical outlook: XLM near the make-or-break zone
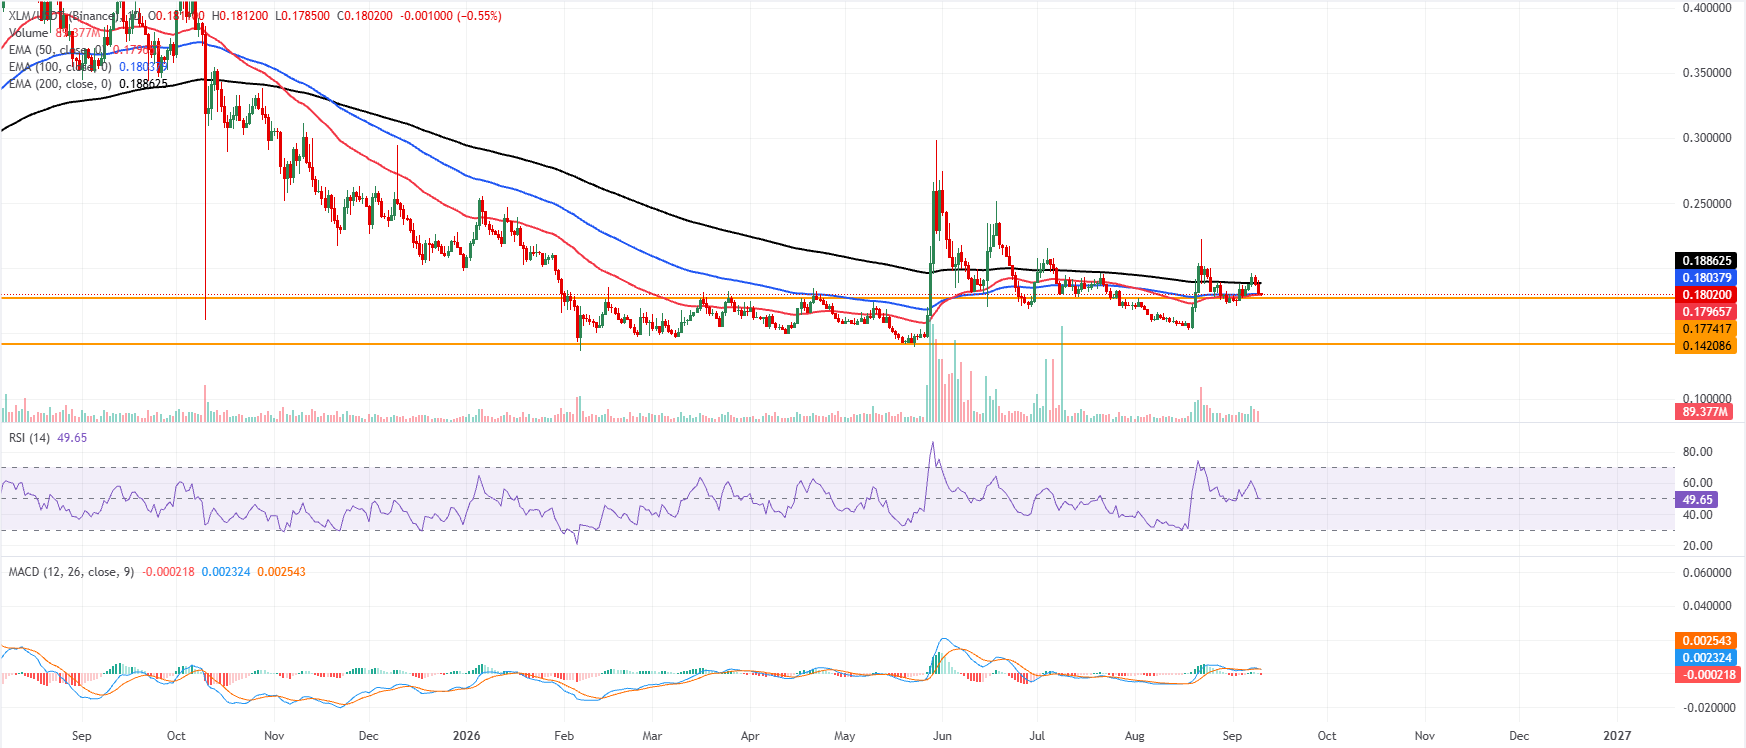
XLM price trades at $0.1802 on Thursday after a correction of over 3% so far this week. XLM is hovering in a neutral range as it sits just above the 50-day EMA at $0.1796 but remains capped by the 100-day EMA at $0.1803 and the broader 200-day EMA resistance near $0.1886. This tight clustering of EMAs suggests price is consolidating after its recent pullback, with the RSI holding around a neutral 50 and the MACD line slipping fractionally below the signal line, hinting at waning bullish momentum without a clear downside break.
On the downside, immediate support sits at the 50-day EMA around $0.1796, with a more defined horizontal floor at $0.1774; a daily close below this zone would expose broader support near $0.1420.
On the topside, bulls must first reclaim the 100-day EMA at $0.1803, with the 200-day EMA at $0.1886 as the next key barrier; only a sustained move above this higher resistance band would reopen the path toward a more constructive medium-term recovery.
(The technical analysis of this story was written with the help of an AI tool. Know more.)
추천 기사


