


US Dollar Index Price Forecast: Likely revisit yearly high at around 101.80
- The US Dollar Index trades higher at around 101.25 ahead of the US JOLTS Job Openings data for August.
- The Fed is highly anticipated to hike interest rates in both policy meetings remaining this year.
- Stabilized US labor market conditions and hot inflationary pressures have prompted hawkish Fed bets.
The US Dollar (USD) outperforms its peers amid firm expectations that the Federal Reserve (Fed) will deliver more interest rate hikes this year. At press time, the US Dollar Index (DXY), which gauges the Greenback’s value against six major currencies, trades 0.1% higher to near 101.25. The DXY is close to its two-month high of 101.40 posted last week.
US Dollar Price Today
The table below shows the percentage change of US Dollar (USD) against listed major currencies today. US Dollar was the strongest against the Australian Dollar.
| USD | EUR | GBP | JPY | CAD | AUD | NZD | CHF | |
|---|---|---|---|---|---|---|---|---|
| USD | 0.08% | 0.14% | 0.02% | 0.10% | 0.43% | 0.21% | 0.14% | |
| EUR | -0.08% | 0.05% | -0.07% | 0.00% | 0.35% | 0.12% | 0.06% | |
| GBP | -0.14% | -0.05% | -0.15% | -0.03% | 0.28% | 0.07% | 0.00% | |
| JPY | -0.02% | 0.07% | 0.15% | 0.10% | 0.41% | 0.19% | 0.13% | |
| CAD | -0.10% | 0.00% | 0.03% | -0.10% | 0.31% | 0.10% | 0.04% | |
| AUD | -0.43% | -0.35% | -0.28% | -0.41% | -0.31% | -0.22% | -0.29% | |
| NZD | -0.21% | -0.12% | -0.07% | -0.19% | -0.10% | 0.22% | -0.06% | |
| CHF | -0.14% | -0.06% | -0.00% | -0.13% | -0.04% | 0.29% | 0.06% |
The heat map shows percentage changes of major currencies against each other. The base currency is picked from the left column, while the quote currency is picked from the top row. For example, if you pick the US Dollar from the left column and move along the horizontal line to the Japanese Yen, the percentage change displayed in the box will represent USD (base)/JPY (quote).
According to the CME FedWatch tool, there is an almost 70% chance that the Fed will hike interest rates in the October meeting. The tool also shows a 60% probability of the Fed delivering a quarter-to-a-percent interest rate hike in both policy meetings remaining this year.
According to TD Securities, “an October hike is looking more likely,” with economists arguing that the Fed will be “unlikely to regain its confidence in inflation progress before the October meeting.” With “most participants expecting further tightening,” they contend “it does not make sense to wait until December to hike again.”
TD Securities therefore “expect the Fed to hike two more times (October and January),” noting that “inflation remains above target while risks are growing.” At the same time, they judge that “the labor market has stabilized, with some signs of strengthening, and activity data has been robust.” In their view, “the economy can handle more restriction, and the Fed is now providing it,” while “the evolution of inflation data will determine the extent and pace of hikes later in the cycle.”
On the economic data front, investors keenly await the US JOLTS Job Openings data for August, which will be published at 14:00 GMT. The Job Openings report will likely show that US employers posted 7.23 million fresh jobs, marginally lower than 7.271 million in July.
US Dollar Index Technical Analysis
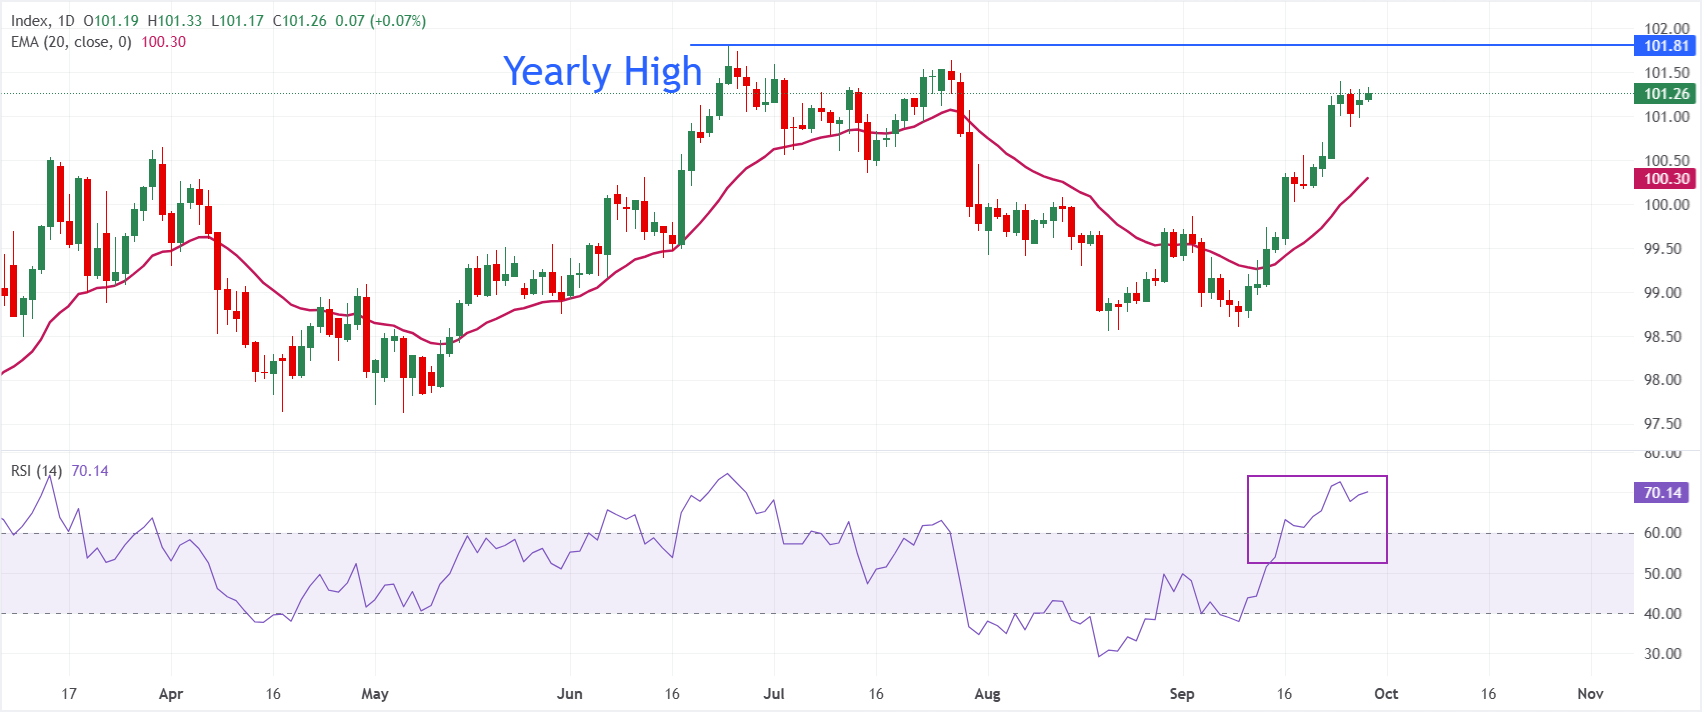
In the daily chart, Dollar Index Spot trades at 101.26, keeping a bullish near-term bias as price holds above the 20-day Exponential Moving Average (EMA) at 100.30. The location of spot over this key trend gauge suggests underlying demand remains in place, although the Relative Strength Index (RSI) at 70.14 signals overbought conditions that could limit immediate upside and encourage consolidation or a corrective pause.
On the downside, initial support is located at the 20-day EMA around 100.30, followed by the psychological level of 100.00. On the upside, the yearly high at 101.80 is the key hurdle.
(The technical analysis of this story was written with the help of an AI tool. Know more.)
US Dollar FAQs
The US Dollar (USD) is the official currency of the United States of America, and the ‘de facto’ currency of a significant number of other countries where it is found in circulation alongside local notes. It is the most heavily traded currency in the world, accounting for over 88% of all global foreign exchange turnover, or an average of $6.6 trillion in transactions per day, according to data from 2022. Following the second world war, the USD took over from the British Pound as the world’s reserve currency. For most of its history, the US Dollar was backed by Gold, until the Bretton Woods Agreement in 1971 when the Gold Standard went away.
The most important single factor impacting on the value of the US Dollar is monetary policy, which is shaped by the Federal Reserve (Fed). The Fed has two mandates: to achieve price stability (control inflation) and foster full employment. Its primary tool to achieve these two goals is by adjusting interest rates. When prices are rising too quickly and inflation is above the Fed’s 2% target, the Fed will raise rates, which helps the USD value. When inflation falls below 2% or the Unemployment Rate is too high, the Fed may lower interest rates, which weighs on the Greenback.
In extreme situations, the Federal Reserve can also print more Dollars and enact quantitative easing (QE). QE is the process by which the Fed substantially increases the flow of credit in a stuck financial system. It is a non-standard policy measure used when credit has dried up because banks will not lend to each other (out of the fear of counterparty default). It is a last resort when simply lowering interest rates is unlikely to achieve the necessary result. It was the Fed’s weapon of choice to combat the credit crunch that occurred during the Great Financial Crisis in 2008. It involves the Fed printing more Dollars and using them to buy US government bonds predominantly from financial institutions. QE usually leads to a weaker US Dollar.
Quantitative tightening (QT) is the reverse process whereby the Federal Reserve stops buying bonds from financial institutions and does not reinvest the principal from the bonds it holds maturing in new purchases. It is usually positive for the US Dollar.
추천 기사


