


August was three good days for the Dow Jones Industrial Average
- DJIA closed just short of 53,300, roughly 250 points lower on the session.
- The whole 1.4% August gain was banked by August 5, four weeks ago.
- September hike odds near 60% into Friday's August employment report.
The Dow Jones Industrial Average closed just short of 53,300, roughly 250 points and about 0.5% lower, after American forces struck two Iranian rocket launchers on Larak Island and Tehran answered with missile and drone attacks on bases in Jordan and the United Arab Emirates. The index opened just below 53,500, reached marginally above that level, then sold into the 53,100 area and recovered around 150 points before the bell.
Crude Oil gained better than 2% on the exchange and Brent held above $90.00, which sorted the index into its usual shape on a war headline. Chevron (CVX), the only energy producer among the thirty, was one of the few names higher, while Goldman Sachs (GS) and Alphabet (GOOGL) supplied most of the damage. That arithmetic is a permanent feature of a price-weighted index carrying a single energy name against roughly a quarter of its weight in financials.
A month made in three sessions
The index finished August 1.4% higher, its fifth consecutive monthly advance, and that streak is doing an enormous amount of work in the sentence. The Dow Jones Industrial Average entered the month just above 52,500 and printed a record high near 54,750 on August 5, a run of better than 4% in three sessions. Every session since has subtracted from it.
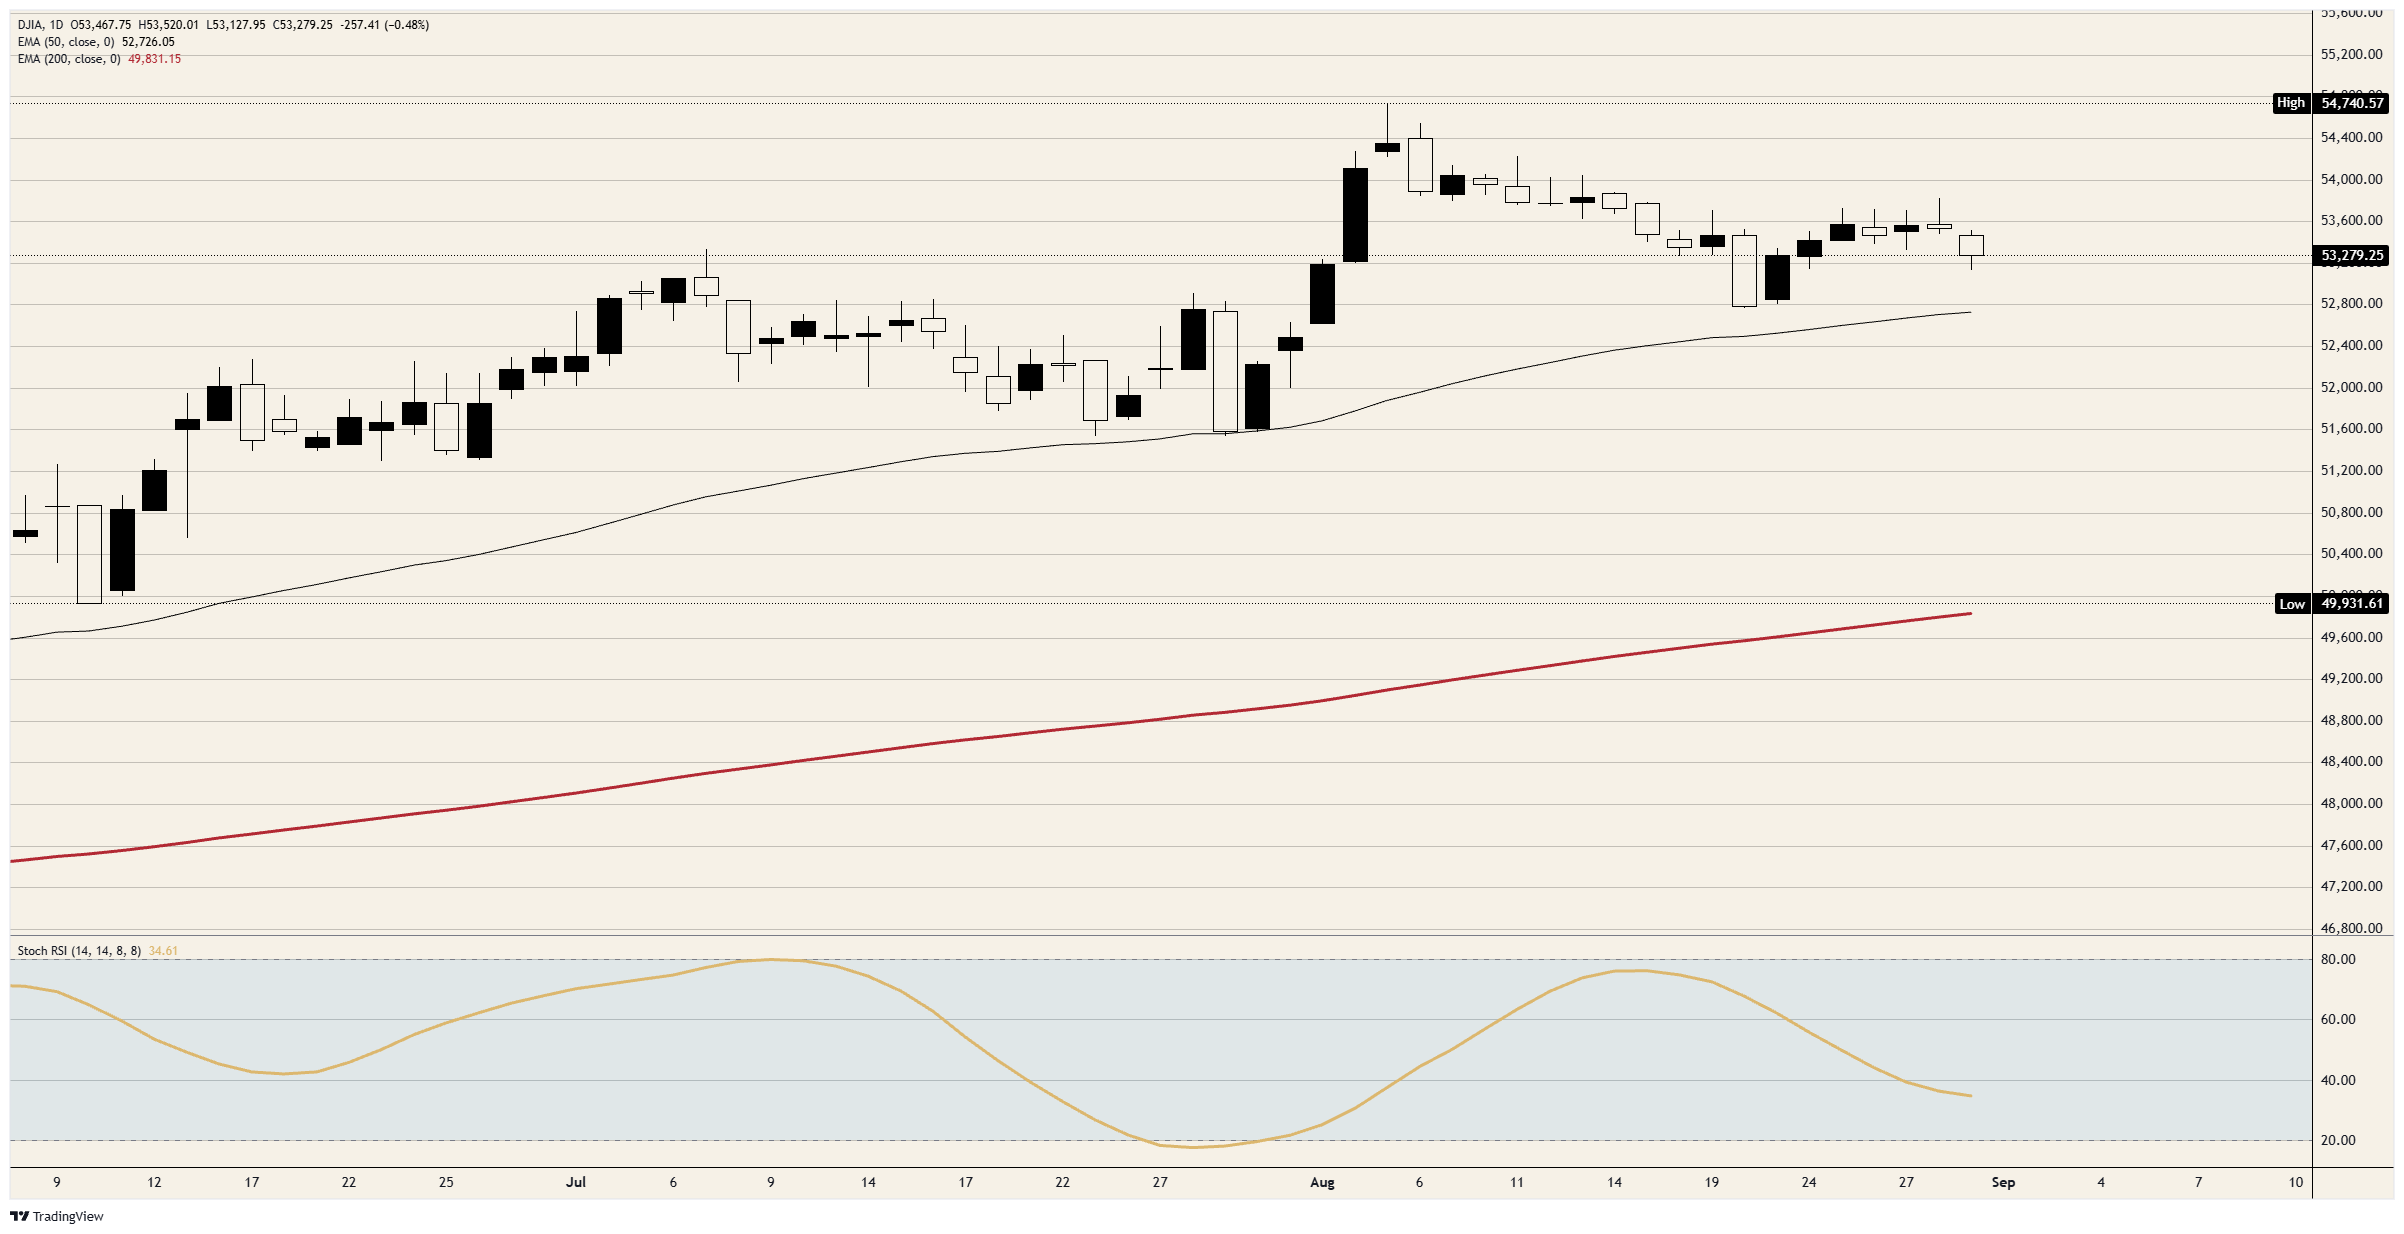
The four weeks that followed produced a sequence of lower highs and no bounce worth the name. Monday's close sits about 2.7% beneath that record and roughly 550 points above the 50-day Exponential Moving Average (EMA) near 52,700, an average that has been rising toward price rather than price pulling away from it. A month-end tally reading as the fifth straight win describes a tape that has been distributing since the first week of it.
The headline that gets bought back
Monday's low in the 53,100 area lasted about as long as it took the wires to describe it, and the index finished roughly 150 points above it. The war is in its sixth month, and the market has had time to work out what a strike on two mobile launchers is worth to American earnings, which is close to nothing. Central Command called the action limited and precise, and the tape agreed with the adjective.
The four-week slide has no headline attached to it at all. It began the session after the record and it has run through an expanded Treasury buyback programme, a long end at levels last seen when the current century was young, and a Jackson Hole keynote the rate market read as a commitment to tighten. Longer-dated yields rose again on Monday, with the 10-year near 4.73% and the 30-year above 5.20%, close to the 19-year high it set earlier in the month.
Federal funds futures now put a quarter-point increase on September 16 at roughly 60%, up from about 35% before Friday. That repricing, rather than Larak Island, is what has been grinding this index lower since August 5. An index weighted toward banks, insurers and capital goods does not enjoy a discount rate that keeps moving in one direction, and it has spent four weeks saying so while the headlines pointed elsewhere.
The chair spent Monday morning at the Group of 20 finance meeting in Asheville, North Carolina, describing the present climate as a global investment surge rather than anything resembling stagnation. That is not the vocabulary of a central bank hunting for a reason to wait, and the front end of the curve has been listening to it since Friday.
The week that decides September
The Institute for Supply Management (ISM) manufacturing Purchasing Managers Index (PMI) arrives Tuesday at 14:00 GMT, and its prices paid subindex is the line that matters, last above 71 and the first place an energy shock ever registers. The services equivalent follows Thursday with its own prices line above 70. Both feed directly into the September argument.
The private payroll count and the Beige Book land Wednesday, and the August employment report arrives Friday at 12:30 GMT with consensus near 60K after a 23K contraction in July. A second consecutive negative print is the one outcome that would take a September increase off the table, and the labour half of the mandate has been the weaker half all summer. August Consumer Price Index (CPI) inflation on September 11 is the last input before the decision.
Levels to watch
Resistance: The session high marginally above 53,500 is the first line, reinforced by Friday's close in the same area. Above there the mid-August shelf near 53,800 has turned back every attempt since the second week of the month, and the record near 54,750 is the only reference beyond it.
Support: The session low in the 53,100 area is the first floor, with the 53,000 handle immediately beneath it. Below that the late-August trough near 52,800 and the rising 50-day EMA near 52,700 sit within about 100 points of each other, which makes that band the first genuine test of the four-week slide.
Bias: Bearish while 53,500 caps, with objectives at 53,000 and then the 52,700 area. The daily Stochastic Relative Strength Index (Stoch RSI) near 35 is falling toward the oversold band with room beneath it, and the sequence of lower highs since August 5 is intact. Invalidation on a daily close above 53,800.
Dow Jones daily chart
Futures FAQs
The futures market is an exchange-based auction in which participants buy and sell contracts of an underlying asset at a predetermined future date and price. The set price is agreed upon today and is derived from the underlying asset. Futures contracts can be based on a wide range of assets, with commodities among the most popular, although currencies and indices are other common underlying assets. Futures prices depend on their underlying asset and act as a mechanism for firms, institutions, and large-position traders to manage risks through hedging.
Futures can be traded in different ways. The most common ways are via a regulated exchange or via Contracts For Difference (CFDs). In the former, liquidity is high and pricing is more transparent, with the broker serving only as an intermediary between you and the market. Still, it generally requires more capital. The largest futures exchanges are the Chicago Mercantile Exchange (CME) and the New York Mercantile Exchange (NYME). As for CFDs, these require less capital and thus trading is more flexible, but at the cost of less transparency.
The E-mini S&P 500 index, Crude Oil (Brent, WTI), Natural Gas, Gold, Silver, Copper, and soft commodities such as grains are among the most actively traded contracts. These offer strong liquidity and are closely followed by traders worldwide. Futures market volume consistently exceeds spot market volume, often significantly. This dominance is driven by leverage, hedging, and higher liquidity on exchanges.
Yes. Future gauges, particularly equity index futures such as those of the S&P 500 or the Nasdaq, are widely considered key gauges of market sentiment because they reflect investors’ expectations for the next session’s opening price. When equity futures drop, it is a sign of risk-aversion, signaling bearish market sentiment. On the contrary, rising equity futures suggest markets are risk on.
As a futures contract approaches its maturity date, the futures price converges upon the spot price, becoming almost identical at expiration. However, prices can diverge significantly before the contract ends. A market is in contango when future prices are higher than spot prices, while the mirror image is called backwardation (when current prices are higher than future prices). For commodities, the normal state of the market is contango because holding the asset over time incurs costs such as storage or insurance fees. When markets turn from contango to backwardation – or vice versa – it signals a shift in the trend: a change from contango to backwardation is taken as a bullish sign, while going from backwardation to contango is generally considered bearish.
추천 기사


