


The Dow Jones Industrial Average has a term premium problem
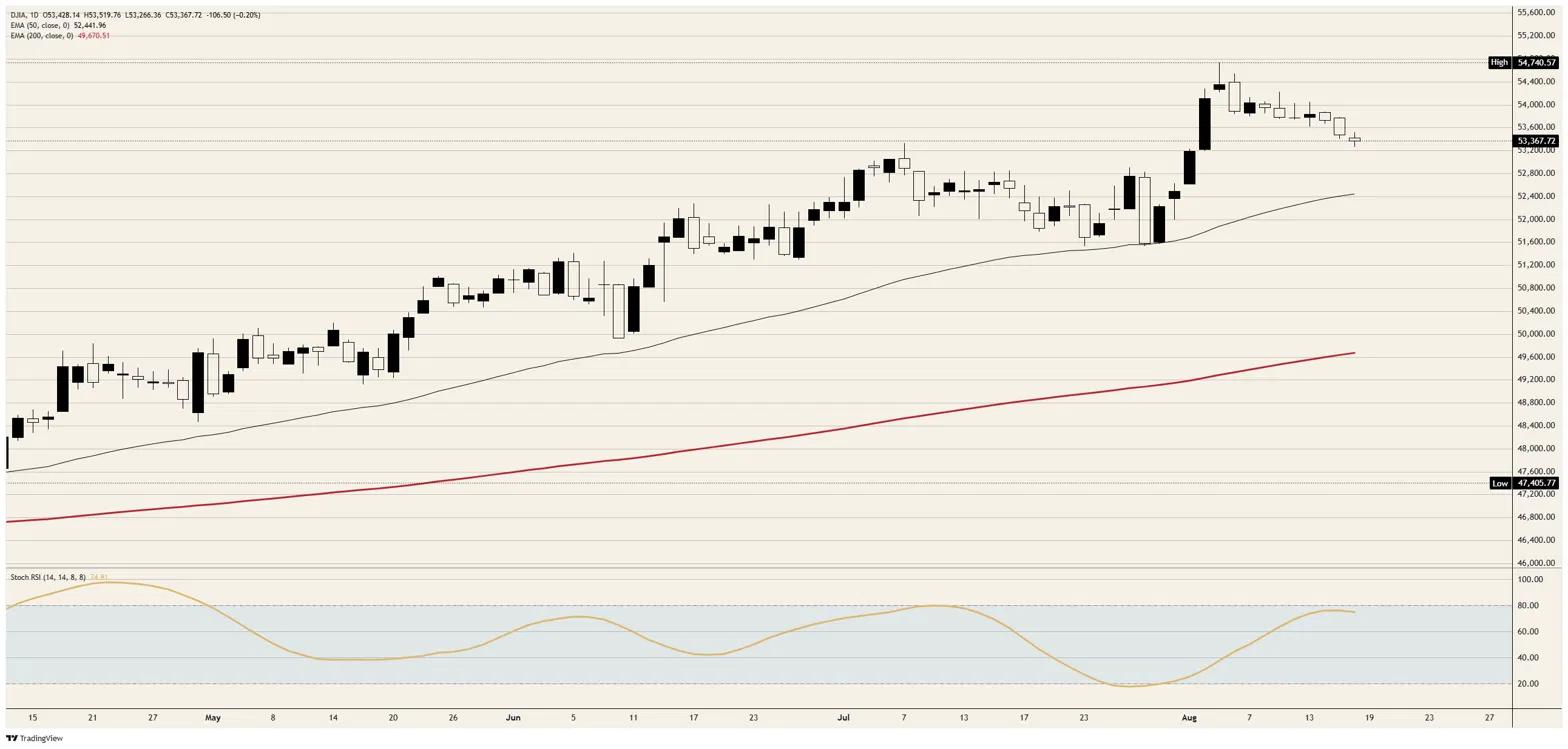
- DJIA trades near 53,400, about 2.5% beneath the August 5 record.
- December Fed hike odds down to 67%, from fully priced on August 10.
- Thirty-year Treasury yield near 5.3%, the highest since June 2007.
A quarter-point Federal Reserve increase by December stopped being a certainty over the past eight days, and the Dow Jones Industrial Average is lower for it. Spot trades near 53,400, down roughly 105 points on the session and about 2.5% beneath the record just short of 54,750 set on August 5. Nine sessions have now passed without a new high.
Relief the tape could not use
Conditional meeting probabilities put a hold at 65.4% for September 16 and 52.4% for October 28, with the December 9 hold cell at 33.0%. On August 10 that same December meeting priced an increase as a certainty, so roughly a third of the terminal tightening has come out of the curve in a week and a half.
An equity market that spent the summer complaining about a chair installed to cut and delivering holds has been handed the outcome it asked for. It has answered by grinding lower across the nine sessions since the record, which is the tape saying the front end is no longer the price that sets the discount rate.
What the long end is actually pricing
The thirty-year Treasury yield trades around 5.3%, its highest since June 2007, and it reached that level while the market was removing Fed tightening rather than adding it. Those two facts cannot both be a policy story. What is widening is the term premium, the compensation demanded for owning duration, and that is a price rather than a forecast.
The distinction is the whole argument for an index valued on long-dated cash flows. An increase that never arrives lowers the front of the curve and does nothing to the rate applied to earnings a decade out. Japan's 10-year at a three-decade high, Germany's 30-year at its firmest since 2011 and France's 30-year at levels unseen since 2008 confirm this is not an American accident.
Housing prices off the wrong end of the curve
July building permits ran at 1.443 million against a 1.37 million consensus, while housing starts printed 1.239 million against 1.35 million expected and 1.415 million prior. Permits are paperwork and starts are concrete, so a beat on one and a miss of more than 8% on the other reads as builders buying optionality they do not intend to exercise.
Pending home sales fell 2.3% in July where a 0.3% gain was expected, a second consecutive decline. A thirty-year mortgage prices off the long end and not off the funds rate, so the most rate-sensitive corner of the economy gets nothing at all from a Fed the market has just talked out of an increase.
Home Depot (HD) is up around 1% on a second-quarter earnings beat, and under price weighting that single advance is holding the session loss to a fifth of a percent. The index is being propped up by a housing retailer on the same afternoon the housing data broke.
The channel Washington threatened to bomb
Crude Oil trades above the $85.00 handle after a near 1% gain on Tuesday and a rise on Monday before it, and the diplomatic track meant to cap it is now formally shut. Trump said Tuesday that no talks with Iran are underway and none are scheduled, and that the naval blockade stands in full.
A day earlier he threatened to strike Oman if it obstructed American efforts, aimed squarely at the only channel still open between Washington and Tehran. An energy price nobody can forecast sitting on top of a shipping lane nobody can insure is exactly what a long-bond holder charges term premium to carry.
What is left this week
The Federal Open Market Committee (FOMC) minutes from the July 28-29 meeting land Wednesday at 18:00 GMT and carry the week's first red band. Three reserve bank presidents dissented for a quarter point at that meeting, and the market has spent the three weeks since deleting the increase they voted for.
Thursday brings initial jobless claims against a 210K consensus and 209K prior, alongside a Philadelphia Fed manufacturing survey forecast to halve to 25 from 41.4. Friday's preliminary August Purchasing Managers Index (PMI) readings close the week, with manufacturing seen at 53.8 from 53.9 and services at 54 from 54.6.
Dow Jones Industrial Average levels
Resistance: The 53,500 area caps first, with the 53,800 shelf that framed all of last week above it, then 54,000 and the record just short of 54,750.
Support: The 53,250 area is the immediate line, and losing it opens 53,000, with the rising 50-day Exponential Moving Average (EMA) just above 52,400 beneath that.
Bias: Bearish. Nine sessions without a new high, a daily Stochastic Relative Strength Index (Stoch RSI) near 75 that ran to the top of its band while price refused to confirm, and a long end still selling all point lower. Invalidation comes on a daily close back above 53,800.
Dow Jones daily chart
Dow Jones FAQs
The Dow Jones Industrial Average, one of the oldest stock market indices in the world, is compiled of the 30 most traded stocks in the US. The index is price-weighted rather than weighted by capitalization. It is calculated by summing the prices of the constituent stocks and dividing them by a factor, currently 0.152. The index was founded by Charles Dow, who also founded the Wall Street Journal. In later years it has been criticized for not being broadly representative enough because it only tracks 30 conglomerates, unlike broader indices such as the S&P 500.
Many different factors drive the Dow Jones Industrial Average (DJIA). The aggregate performance of the component companies revealed in quarterly company earnings reports is the main one. US and global macroeconomic data also contributes as it impacts on investor sentiment. The level of interest rates, set by the Federal Reserve (Fed), also influences the DJIA as it affects the cost of credit, on which many corporations are heavily reliant. Therefore, inflation can be a major driver as well as other metrics which impact the Fed decisions.
Dow Theory is a method for identifying the primary trend of the stock market developed by Charles Dow. A key step is to compare the direction of the Dow Jones Industrial Average (DJIA) and the Dow Jones Transportation Average (DJTA) and only follow trends where both are moving in the same direction. Volume is a confirmatory criteria. The theory uses elements of peak and trough analysis. Dow’s theory posits three trend phases: accumulation, when smart money starts buying or selling; public participation, when the wider public joins in; and distribution, when the smart money exits.
There are a number of ways to trade the DJIA. One is to use ETFs which allow investors to trade the DJIA as a single security, rather than having to buy shares in all 30 constituent companies. A leading example is the SPDR Dow Jones Industrial Average ETF (DIA). DJIA futures contracts enable traders to speculate on the future value of the index and Options provide the right, but not the obligation, to buy or sell the index at a predetermined price in the future. Mutual funds enable investors to buy a share of a diversified portfolio of DJIA stocks thus providing exposure to the overall index.
추천 기사


