
Dogecoin, Shiba Inu face profit-taking risk as Bitcoin's rally takes a breather
- Dogecoin bears regain control as the price slides below $0.2000 amid a sudden surge in the meme coin's supply in profit.
- Shiba Inu is at risk of extending the pullback from Monday's peak of $0.00001416 toward the 50-day EMA.
- Investors shift attention to the US CPI data, which is expected to rise by 2.7% on an annual basis.
Dogecoin (DOGE) and Shiba Inu (SHIB) are frontlining meme coins losses on Tuesday, following a strong uptrend the previous day. The surge in the prices of DOGE, SHIB and other crypto assets followed in the footsteps of Bitcoin (BTC), which hit a new record high of $123,218 on Monday.
However, volatility is striking in the broader crypto market during the late European session, as evidenced by the Dogecoin price's 3% drop on the day, trading at around $0.1912. Shiba Inu also faces rising selling pressure, signaling profit-taking and short-term risk-off sentiment among retail investors.
Market overview: Dogecoin, Shiba Inu wobble ahead of US CPI data release
Interest in crypto assets is shaky on Tuesday ahead of the release of the United States (US) Consumer Price Index (CPI) data for June. CPI is the measure of the average change in prices of goods and services paid by consumers over time. It is a key indicator of inflation and influences several pivotal economic policies.
Market participants expect June's CPI to rise at a yearly rate of 2.7%, with the core CPI expected to increase by 3%, reflecting the potential for higher inflation in the US.
In May, the CPI rose 2.4% on an annual basis, up from 2.3% in April but below market expectations of 2.5%. The core CPI, which excludes the volatile prices of food and energy, increased 2.8% in May, matching a similar increase in April.
A favorable US CPI could protect investor risk appetite, thereby buoying prices to extend the uptrend. However, if the outcome exceeds expectations, interest in riskier assets like Bitcoin, Dogecoin, and Shiba Inu could falter, depriving these digital assets of the tailwind that sustains their bullish outlook.
Technical outlook: Dogecoin, Shiba Inu offer bearish signals
Dogecoin, the largest meme coin by market capitalization of nearly $29 billion, is struggling to defend against increasing sell-side pressure.
The 200-day Exponential Moving Average (EMA) currently caps price movement at $0.2025, while the 100-day EMA indicator, which sits at $ 0.1900, provides initial support.
If the traders reduce their exposure, the 50-day EMA at $0.1819 could prove to be a crucial tentative support level. The Relative Strength Index (RSI) downward movement at 57 signals a decrease in buying pressure.
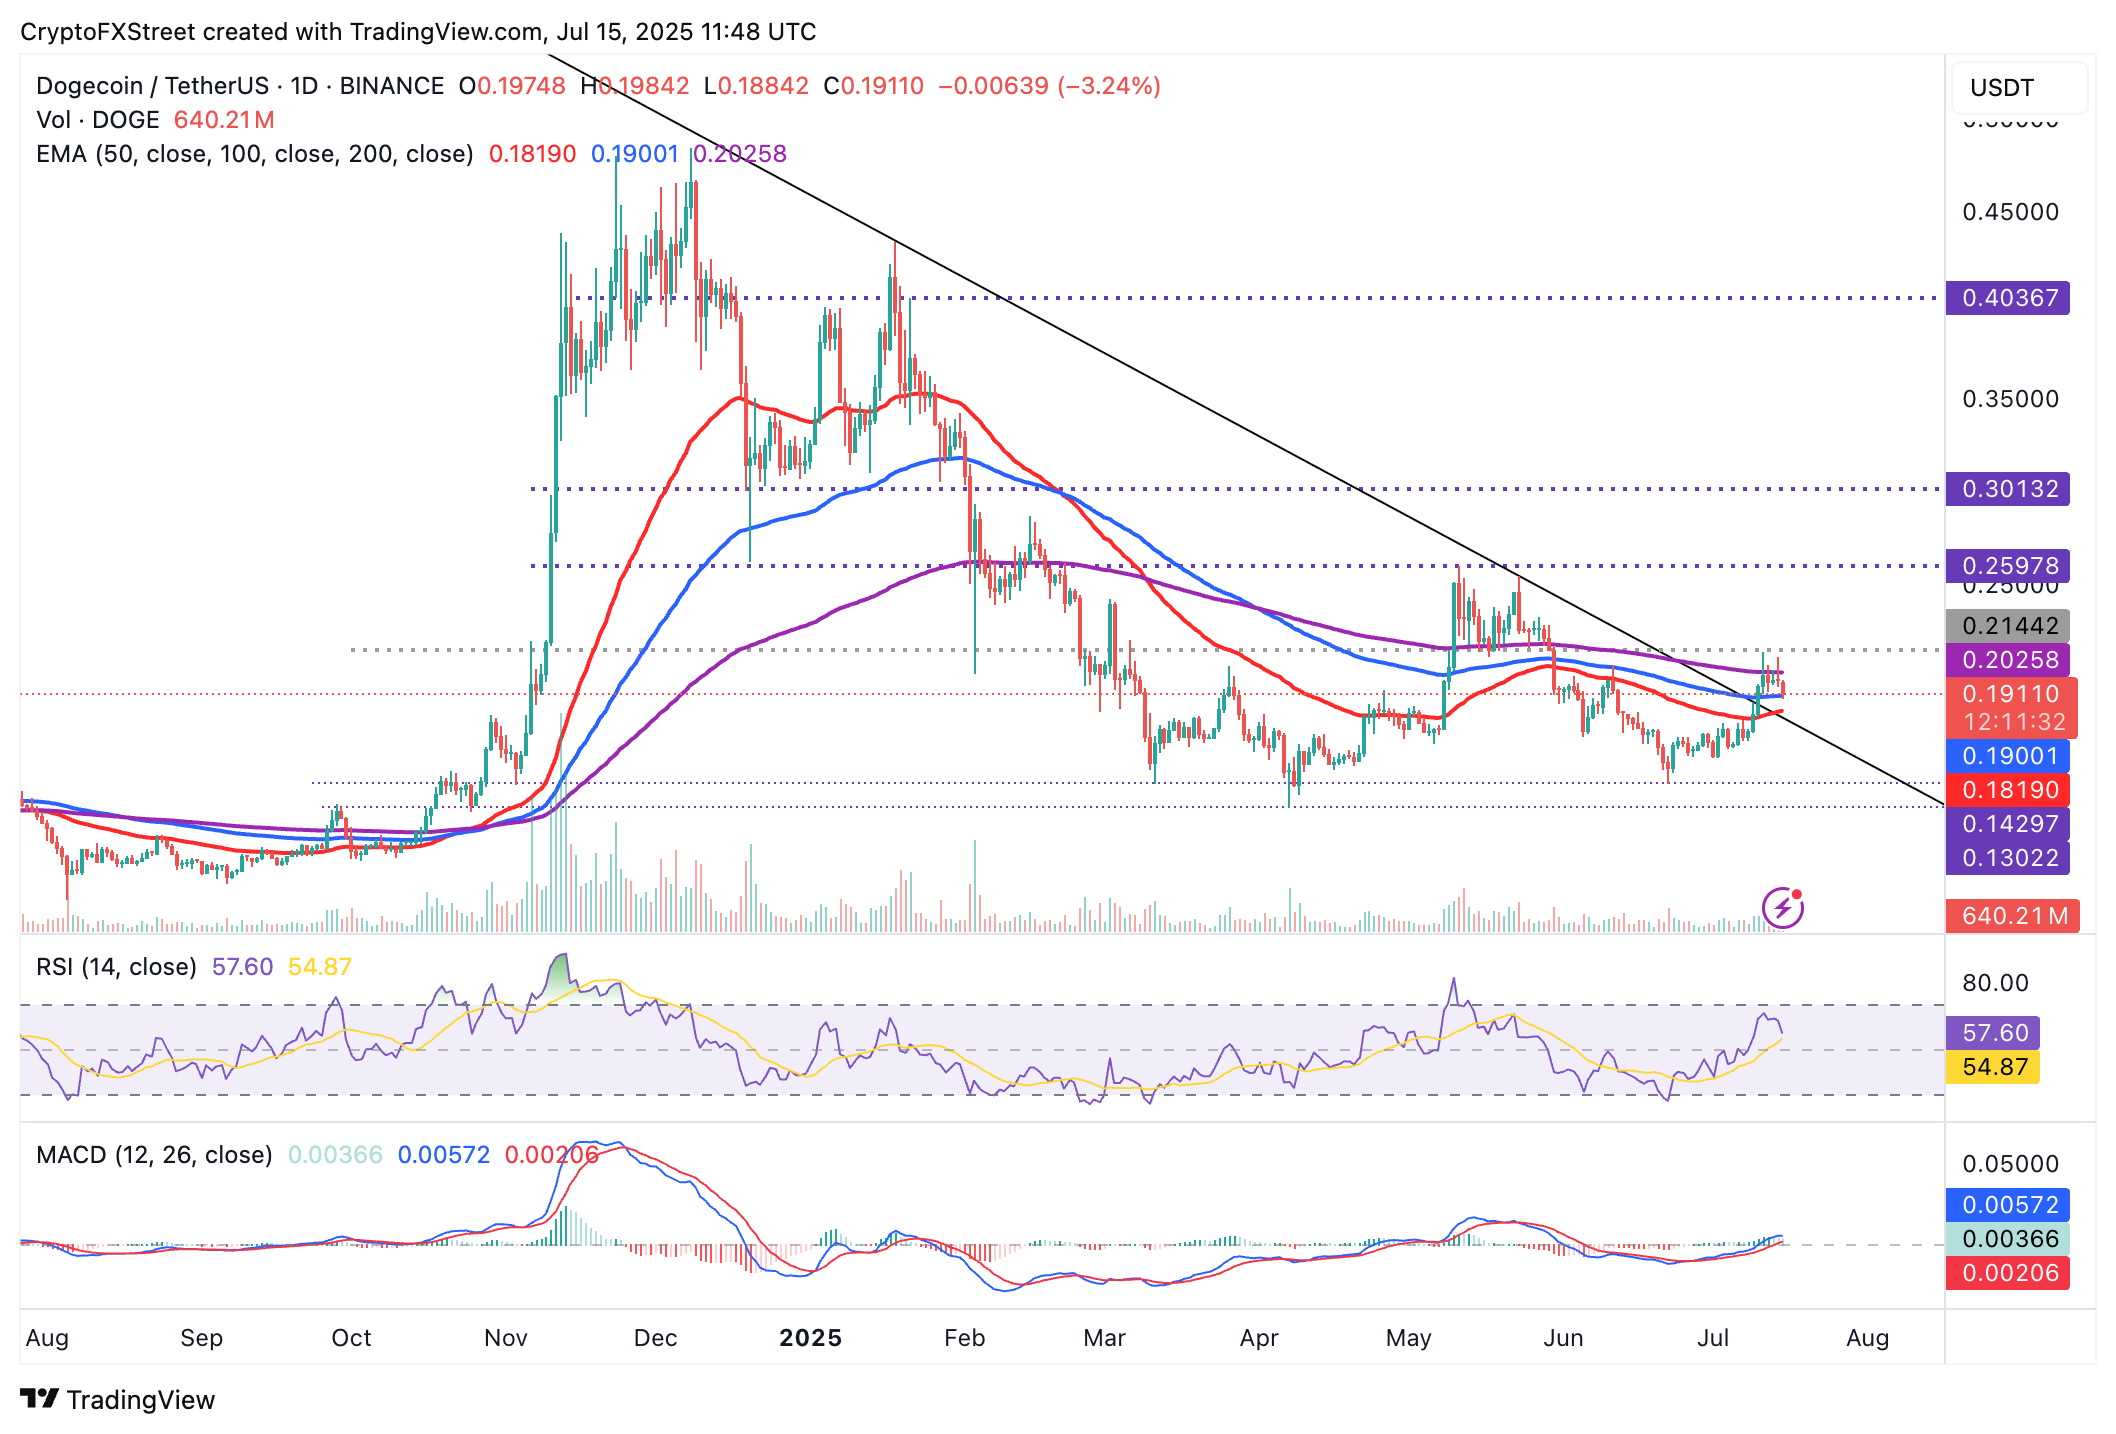
DOGE/USDT daily chart
The steady price increase, reaching a Monday peak of $0.2109, has seen the meme coin's supply in profit expand, reaching approximately 104.5 billion DOGE, according to Glassnode.
As the Supply in Profit metric rises, more holders become profitable, and, in turn, this increases the probability of a pullback. Investors prefer to sell their holdings when in profit, as opposed to periods of unrealized loss.
Dogecoin's supply in profit peaked at around 121 billion DOGE in May. This coincided with the increase in price from April's tariff-triggered crash at around $0.1302 to $0.2597, the highest top in May.
The trend reversal that followed this upswing found support at around $0.1427 in June before bulls tightened their grip, propelling the Dogecoin price to $0.2109. In other words, traders should tread cautiously, considering the potential risk that the current pullback could extend toward the support level in June at around $0.1427.
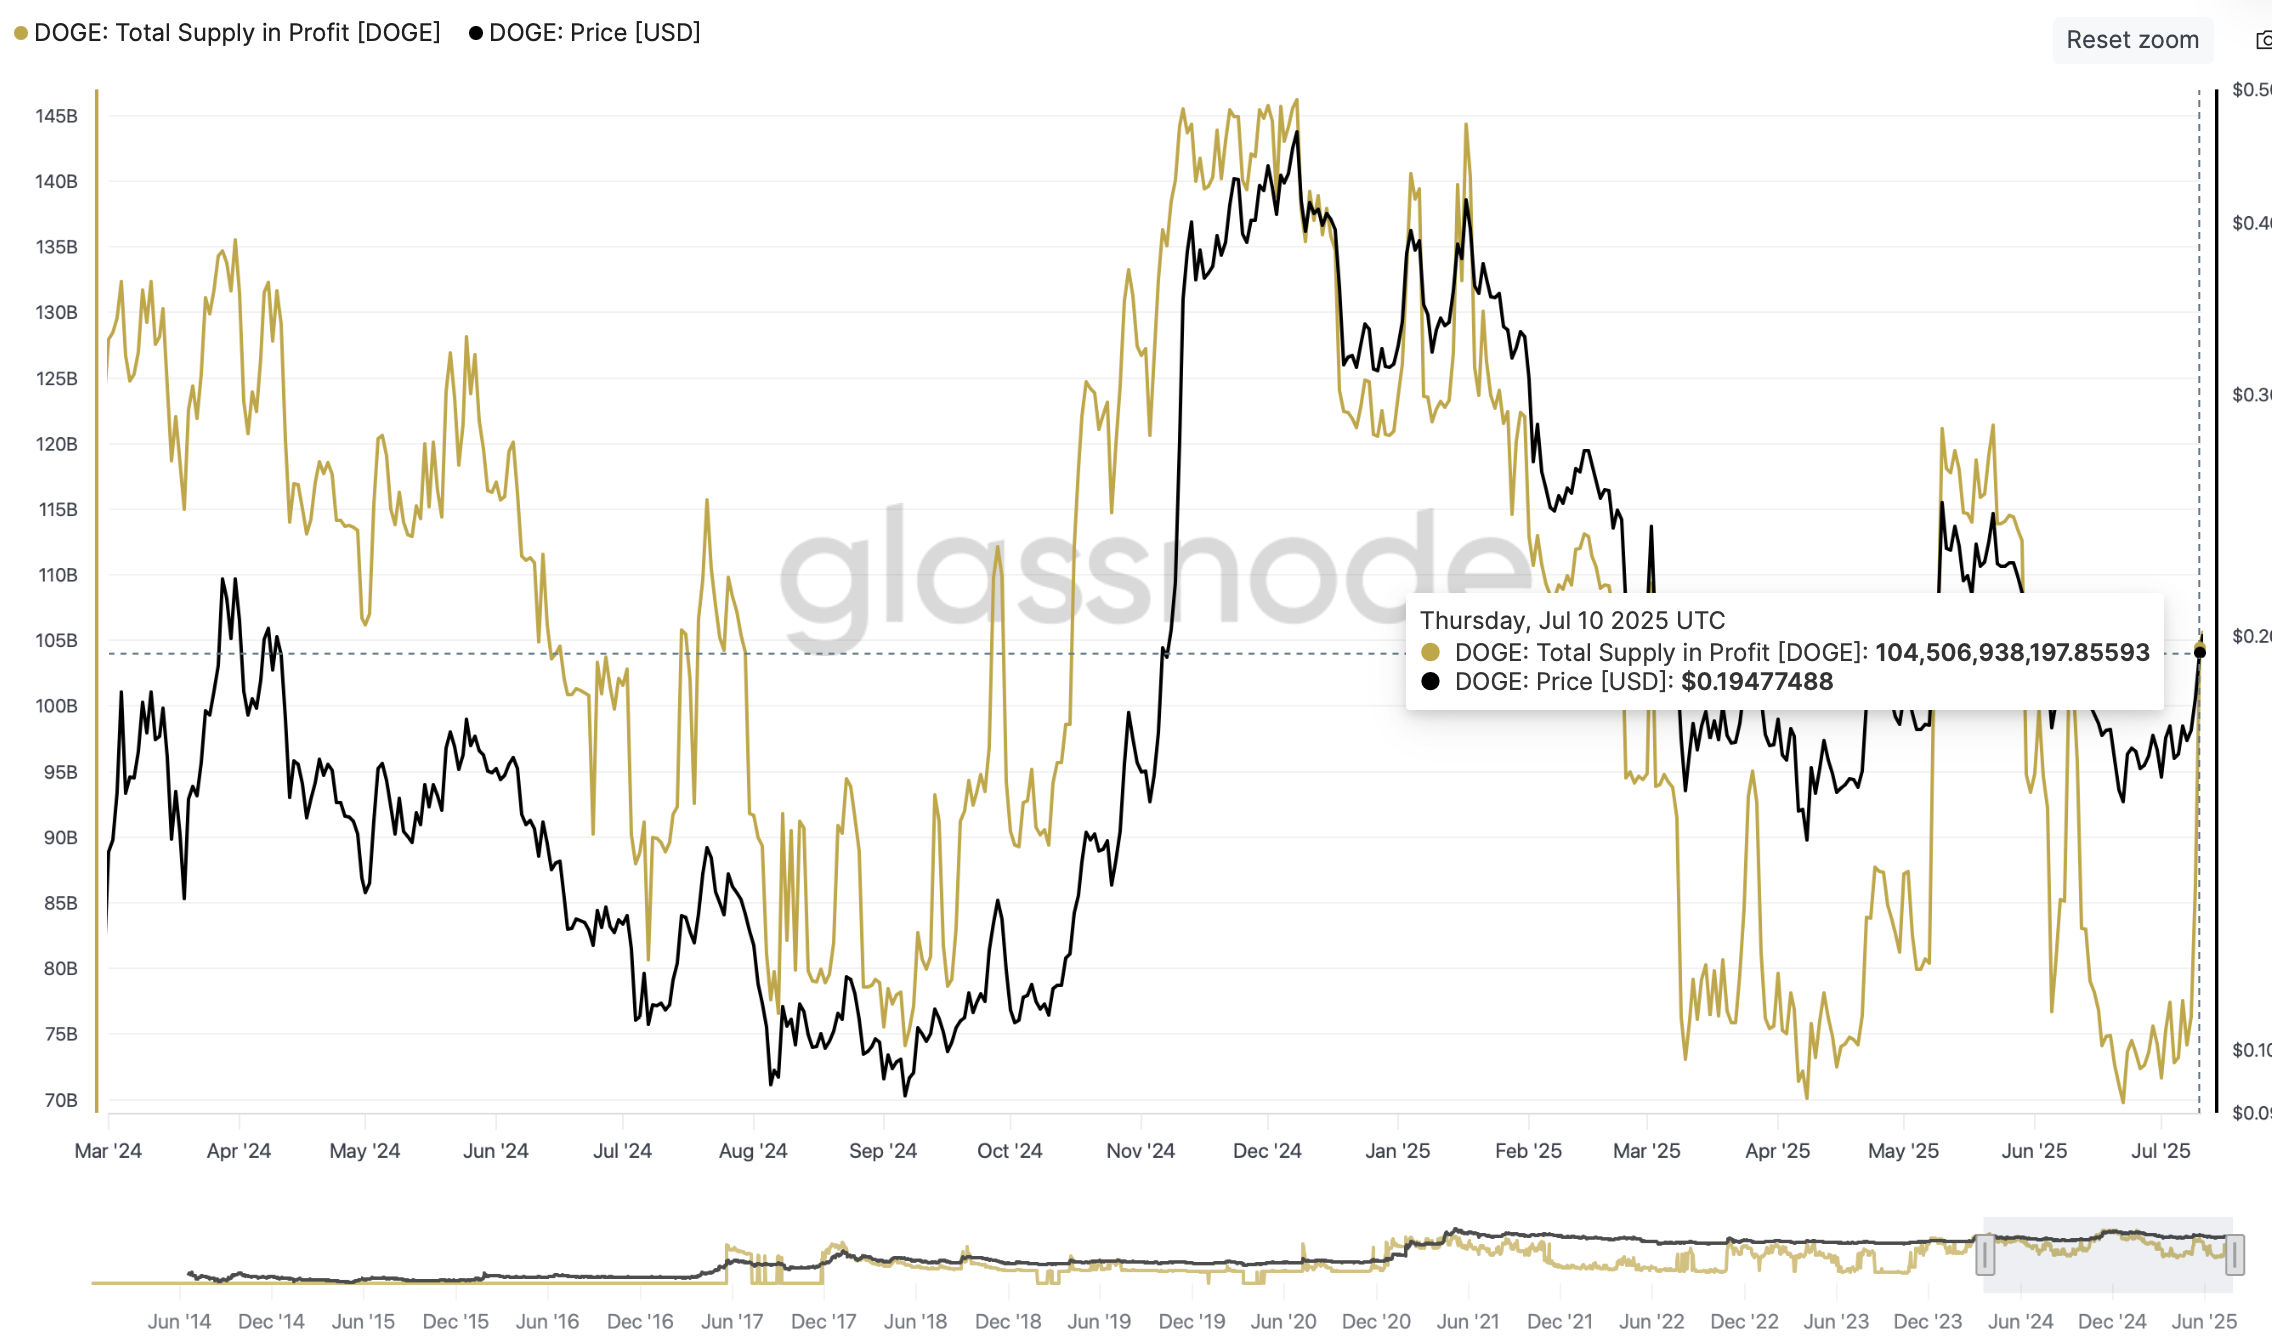
Dogecoin Supply in Profit metric | Source: Glassnode
Still, with the Moving Average Convergence Divergence (MACD) maintaining a bullish outlook above the zero line on the daily chart, the path of least resistance could shift upward, potentially boosting the Dogecoin price to extend the uptrend above the pivotal $0.2000.
As for Shiba Inu, the decline on Tuesday resulted in a price drop of over 2.5% to $0.00001292. The downward trend in the RSI at 57 hints at bearish momentum building.
The loss of the 100-day EMA support at around $0.00001310 could predispose SHIB to an extended drop, targeting the next tentative support level provided by the 50-day EMA at around $0.00001248.
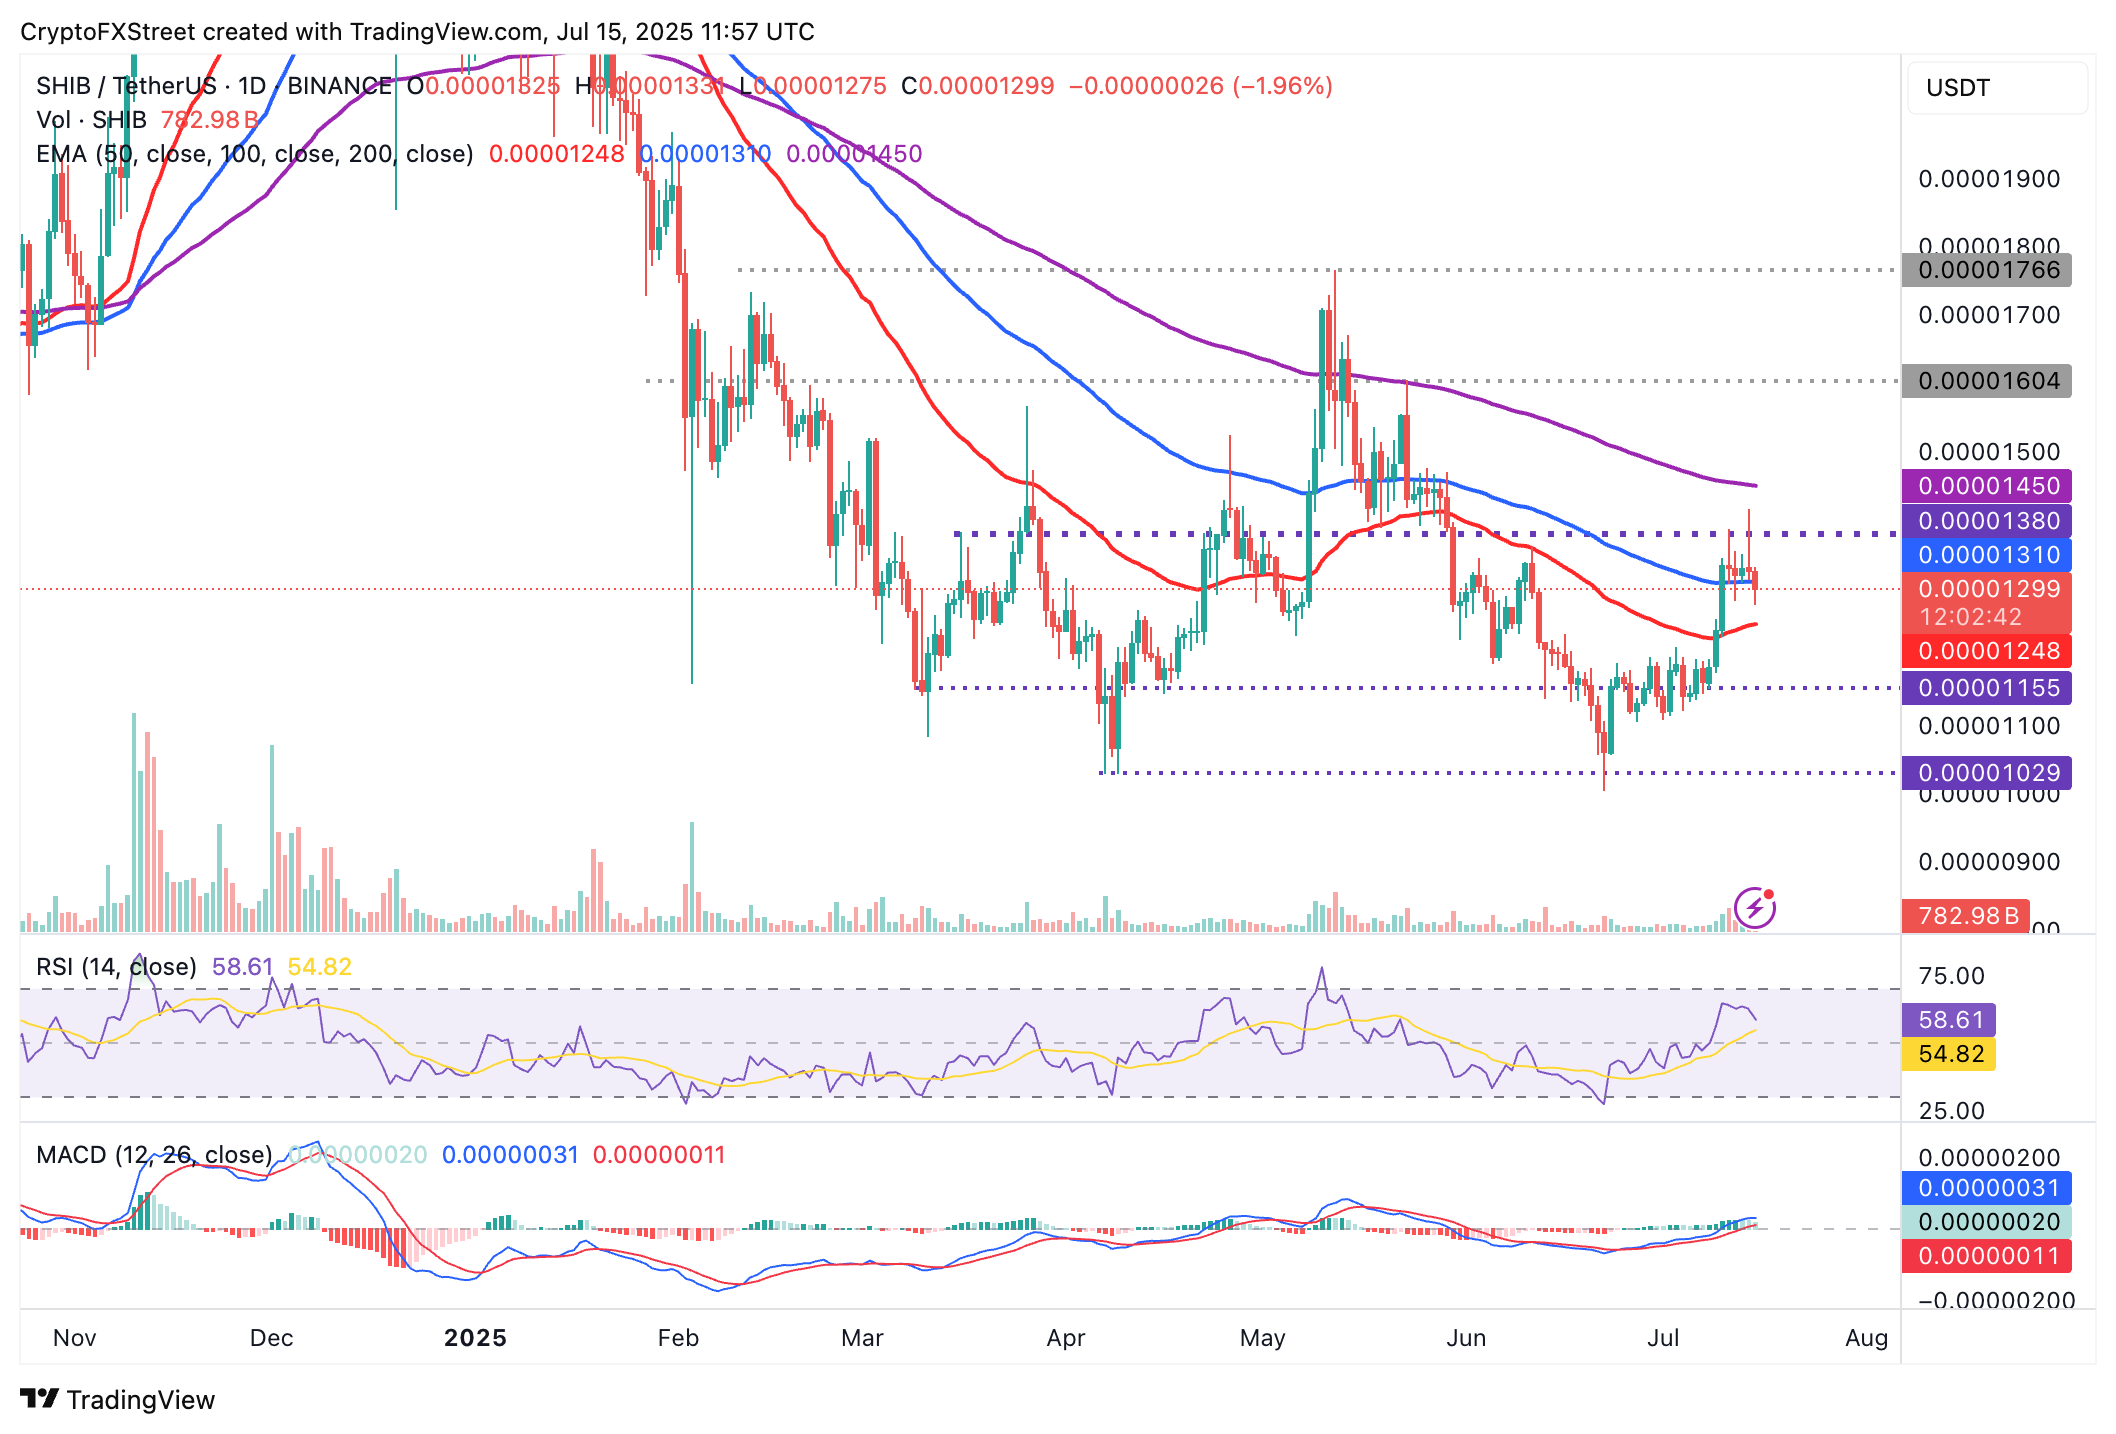
SHIB/USDT daily chart
Still, the MACD indicator upholds a buy signal triggered on June 27. If the blue MACD line holds above the red signal line, the path of least resistance could stay upward as traders increase exposure. Key milestones that could help steady Shiba Inu's uptrend include the potential break above the 200-day EMA at $ 0.00001450 and the peak in May, around $0.00001766.
Cryptocurrency metrics FAQs
The developer or creator of each cryptocurrency decides on the total number of tokens that can be minted or issued. Only a certain number of these assets can be minted by mining, staking or other mechanisms. This is defined by the algorithm of the underlying blockchain technology. On the other hand, circulating supply can also be decreased via actions such as burning tokens, or mistakenly sending assets to addresses of other incompatible blockchains.
Market capitalization is the result of multiplying the circulating supply of a certain asset by the asset’s current market value.
Trading volume refers to the total number of tokens for a specific asset that has been transacted or exchanged between buyers and sellers within set trading hours, for example, 24 hours. It is used to gauge market sentiment, this metric combines all volumes on centralized exchanges and decentralized exchanges. Increasing trading volume often denotes the demand for a certain asset as more people are buying and selling the cryptocurrency.
Funding rates are a concept designed to encourage traders to take positions and ensure perpetual contract prices match spot markets. It defines a mechanism by exchanges to ensure that future prices and index prices periodic payments regularly converge. When the funding rate is positive, the price of the perpetual contract is higher than the mark price. This means traders who are bullish and have opened long positions pay traders who are in short positions. On the other hand, a negative funding rate means perpetual prices are below the mark price, and hence traders with short positions pay traders who have opened long positions.
추천 기사


