

Solana Price Forecast: SOL corrects even as on-chain metric hits record high
Solana Price Today: $170.37
- Solana price slips to $170 at the time of writing, down nearly 4% on the day.
- Solana economic activity hit its fourth consecutive all-time high, according to Blockworks data.
- SOL could correct over 5% if it extends its losses further.
Solana (SOL) corrects to the $170 level early on Friday. The native token of the Solana blockchain is in a state of decline even as on-chain metrics suggest rising activity on the chain.
Data from Blockworks shows that Solana has noted a spike in its activity, likely in response to meme coins and demand for these tokens. However, this has failed to catalyze gains in the altcoin.
Solana on-chain metrics fail to push price higher
Blockworks data shows that economic activity on the Solana blockchain has hit an all-time high for the fourth time. Analyst behind the X handle, @0xMert_ notes that Solana’s blockchain has noted a breakout in response to tips on the liquid staking protocol, Jito.
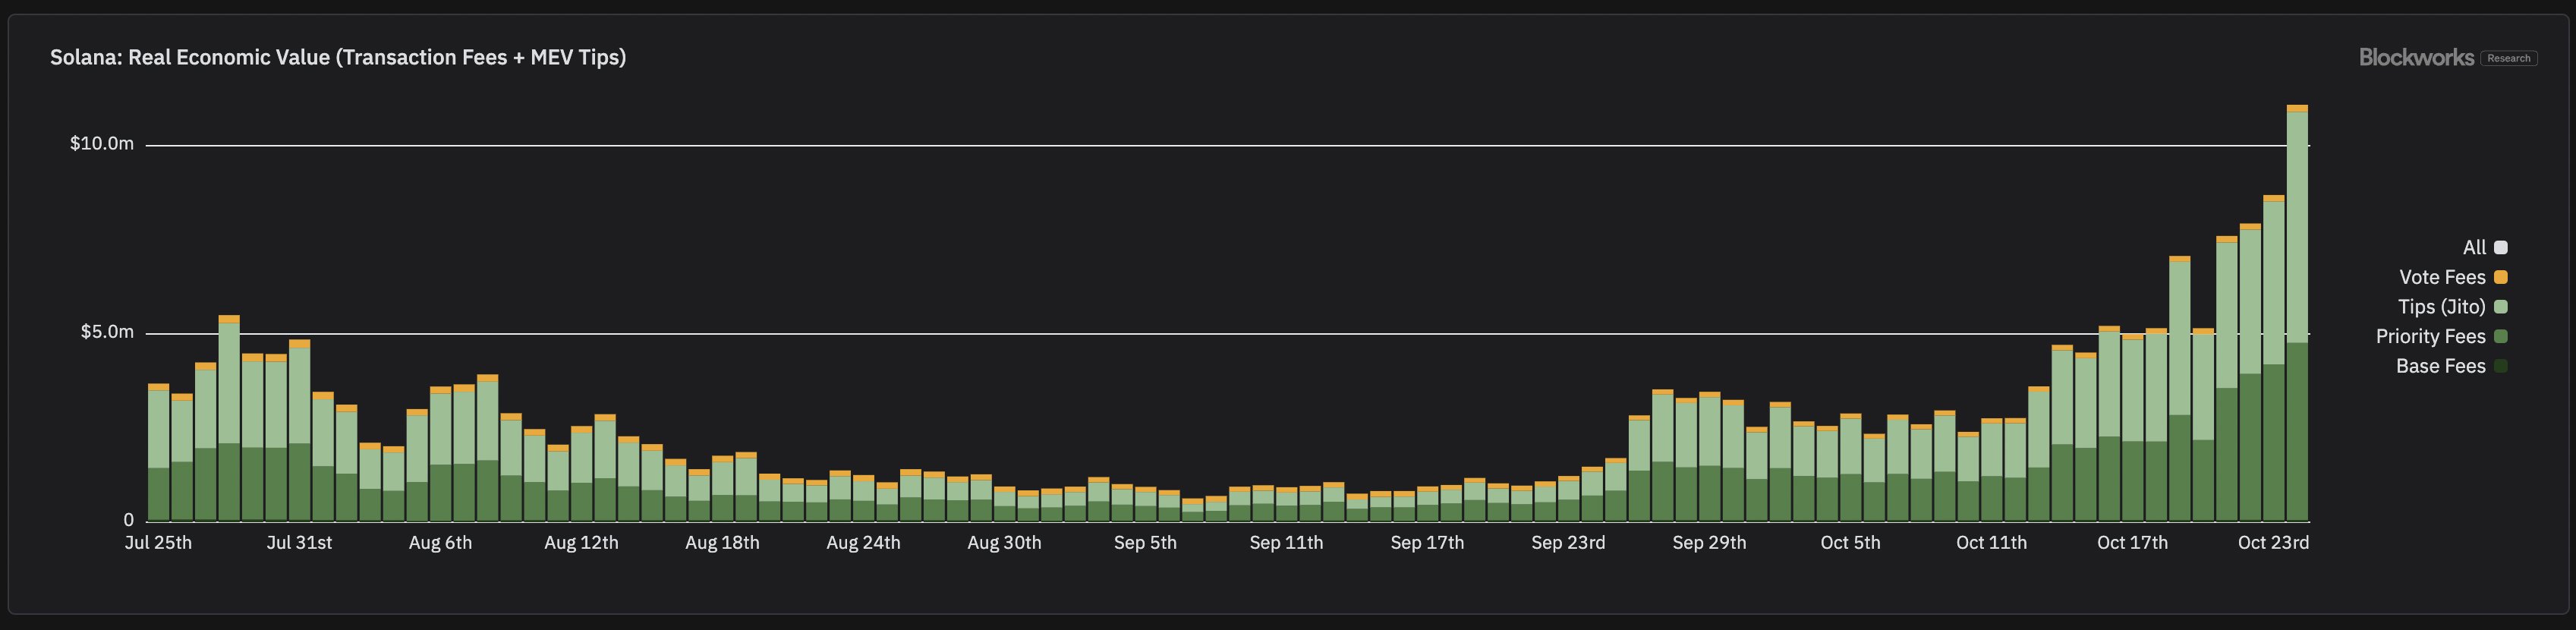
Real Economic Value of Solana
SOL price remains unaffected by the growth in on-chain activity and rising economic activity.
Solana could slip 5% lower
Solana has been in an upward trend. SOL corrected to the $170 level on Friday. If the altcoin corrects further, it could drop nearly 5% and sweep liquidity at $160.99. This level marks the October 21 low that coincides with the lower boundary of the Fair Value Gap (FVG).
SOL could find support in the imbalance zone between $156.65 and $157.58.
The Relative Strength Index (RSI) reads 61.45, and is sloping downward. This implies that there is underlying negative momentum in Solana price, it supports the bearish thesis for SOL.
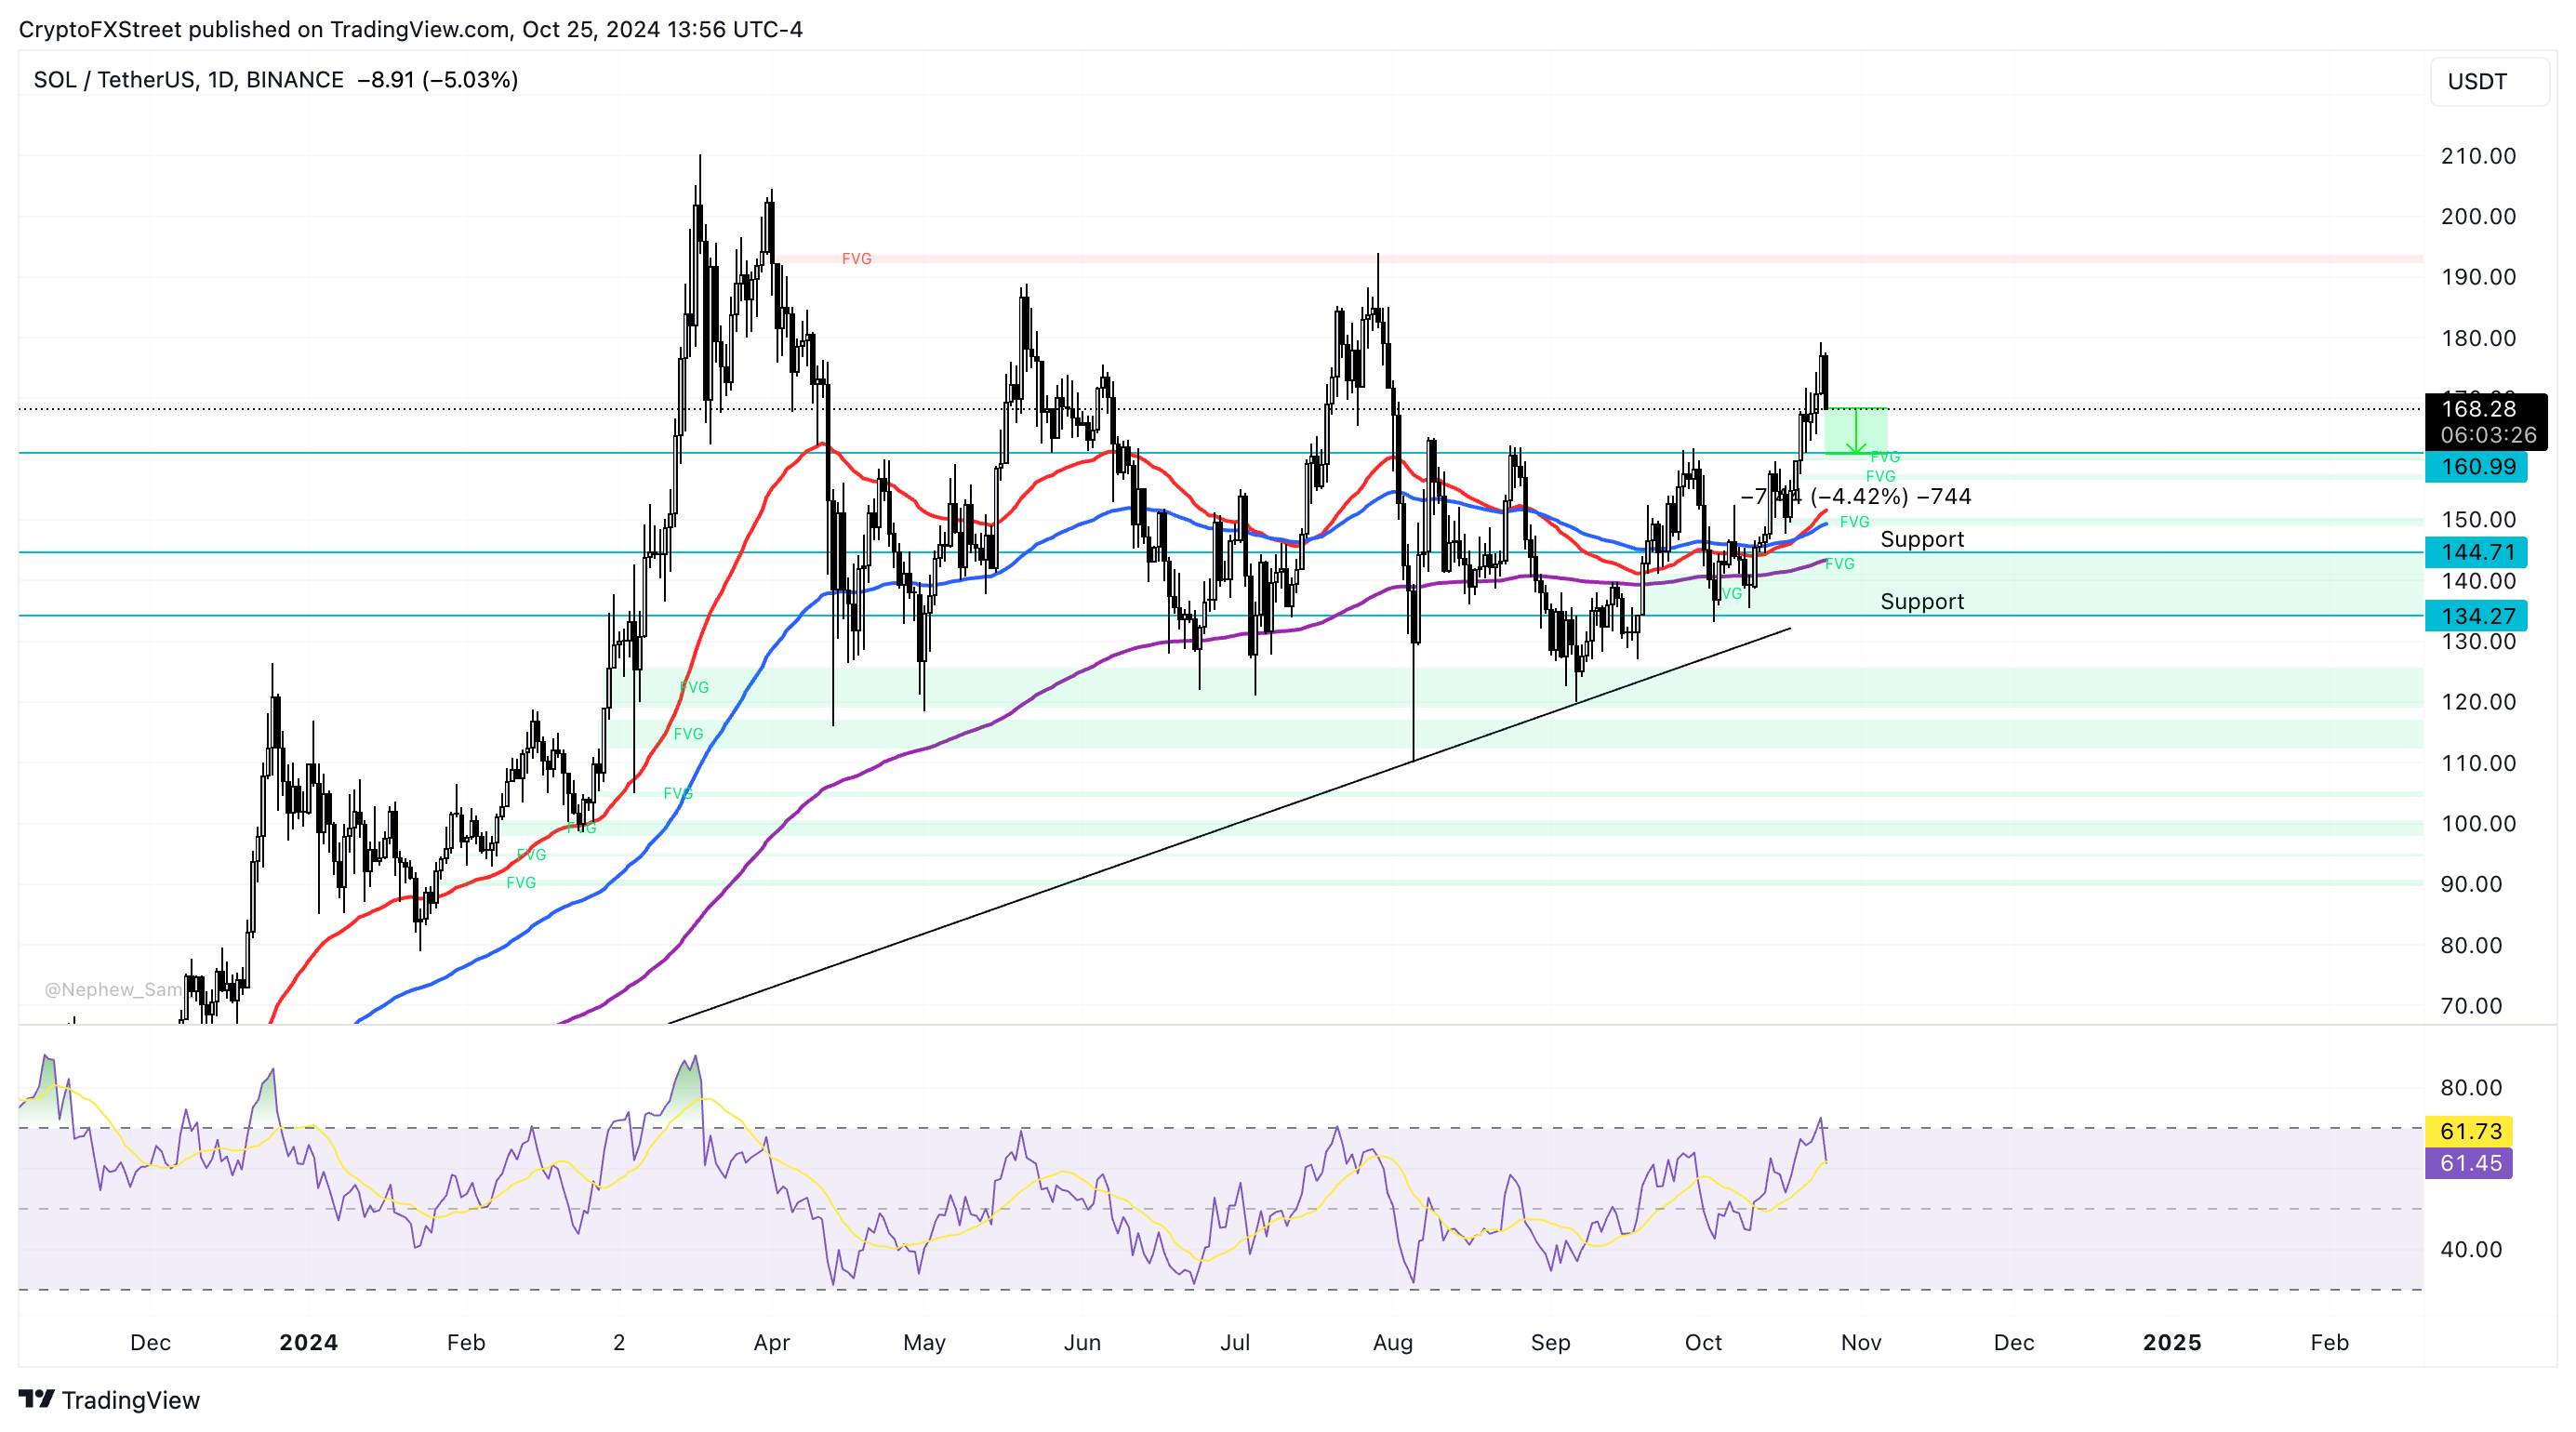
SOL/USDT daily chart
A daily candlestick close above the $179 level, the Thursday high for the altcoin, could invalidate the bearish thesis for SOL. Solana could test the August 2024 peak of $185.10.
추천 기사


