


Crypto Today: Bitcoin, Ethereum, XRP trade under pressure as bottom signals remain elusive
- Bitcoin slips and tests lower support range near $73,000 on Thursday amid persistent ETF outflows.
- Ethereum sellers tighten their grip with spot hovering above $2,000 amid institutional capital outflows.
- XRP is at risk of extending its decline below $1.00, exacerbated by deteriorating momentum indicators.
Bitcoin (BTC) corrects near a key support range near $73,000 on Thursday, trading alongside altcoin majors Ethereum (ETH) and Ripple (XRP). The smart contract token, ETH, holds above its $2,000 demand area, while the remittance token XRP upholds technical weakness, raising correction odds below $1.00.
Demand for crypto and related assets has significantly faded over the last few weeks, weighed down by macro uncertainties and risk-off sentiment following the Binance hack that impacted roughly $6.3 billion.
The Fear & Greed Index stands at 28 in the Fear territory on Thursday, down only marginally from 29 the day before, aligning with the broader risk-averse market sentiment.
Capital outflows persist in crypto ETFs
Bitcoin spot Exchange Traded Funds (ETFs) recorded approximately $300 million in outflows on Wednesday, extending a five-day bearish streak, according to SoSoValue. As a result, cumulative inflows have shrunk slightly to $55.1 billion, while net assets under management average $93.7 billion. Persistent outflows will likely continue to weigh on price action, allowing bearish dominance.
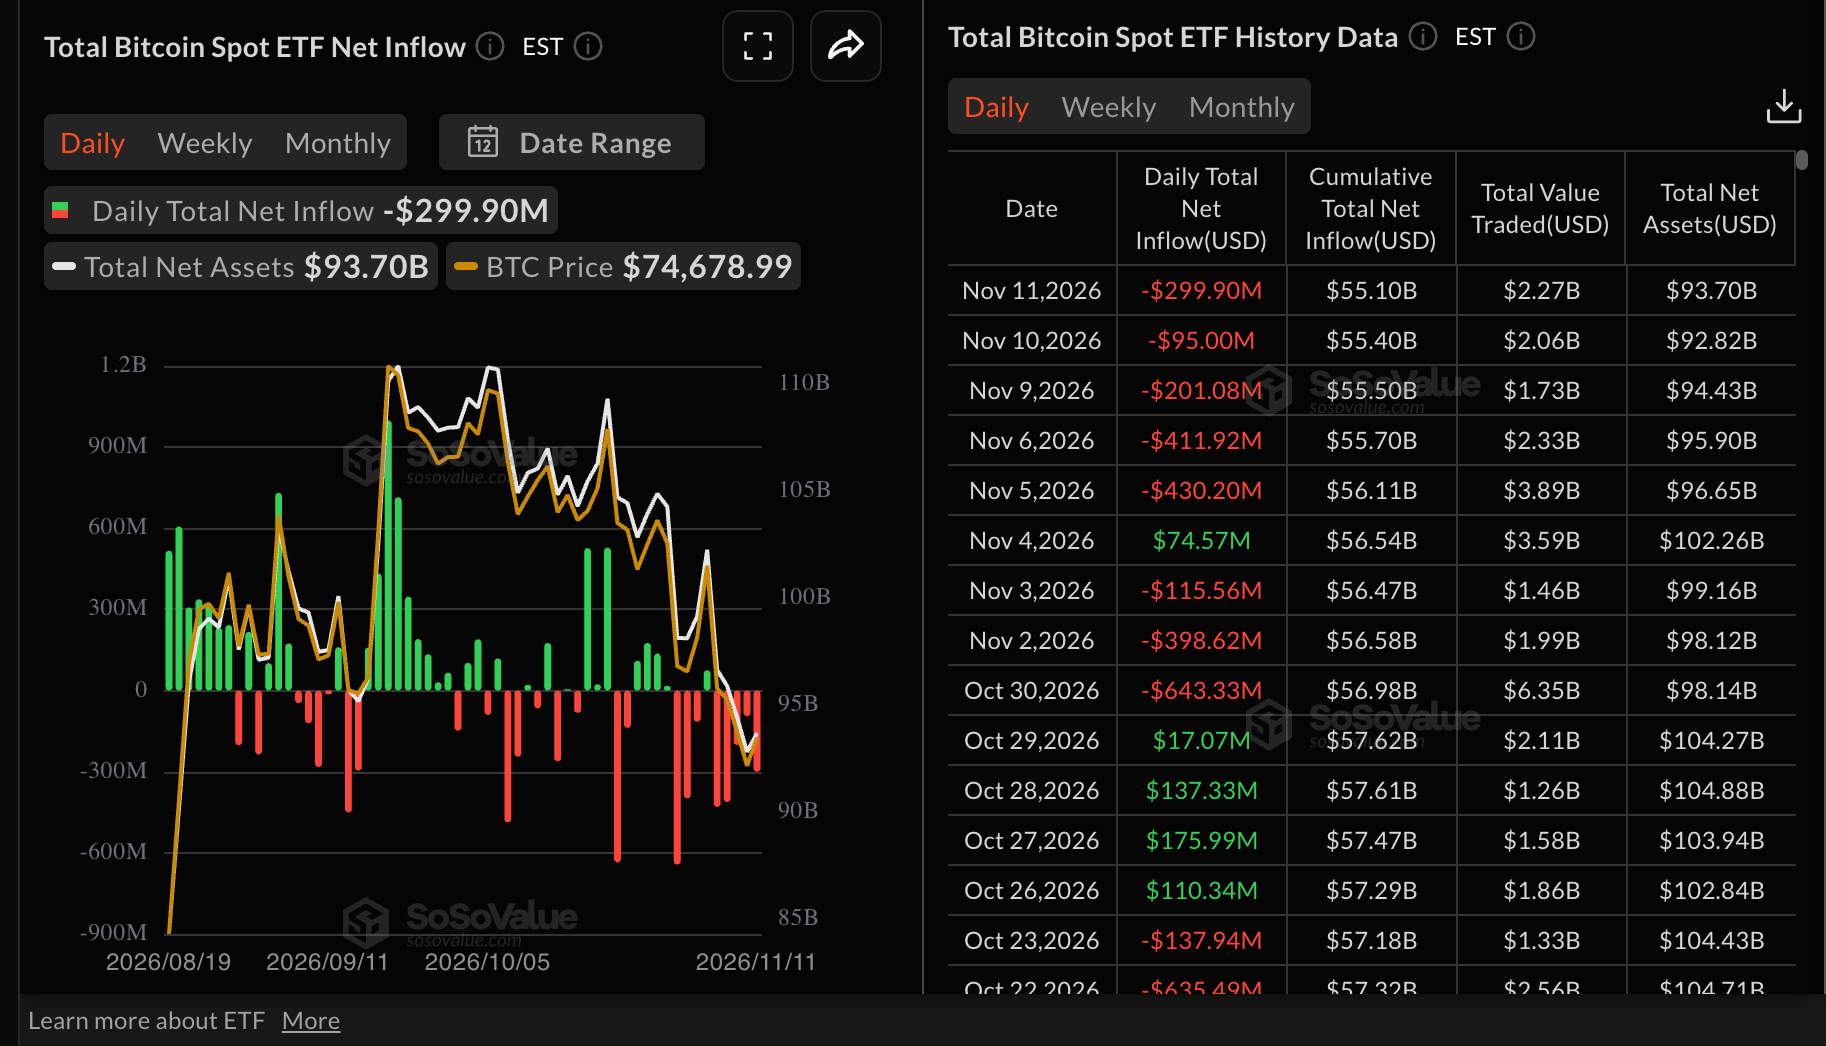
“Volumes remain below levels observed during previous price expansions and market bottoms, suggesting limited buying interest as BTC trades near two-month lows,” K33 Research said in the ‘Ahead of the Curve’ report on Tuesday.
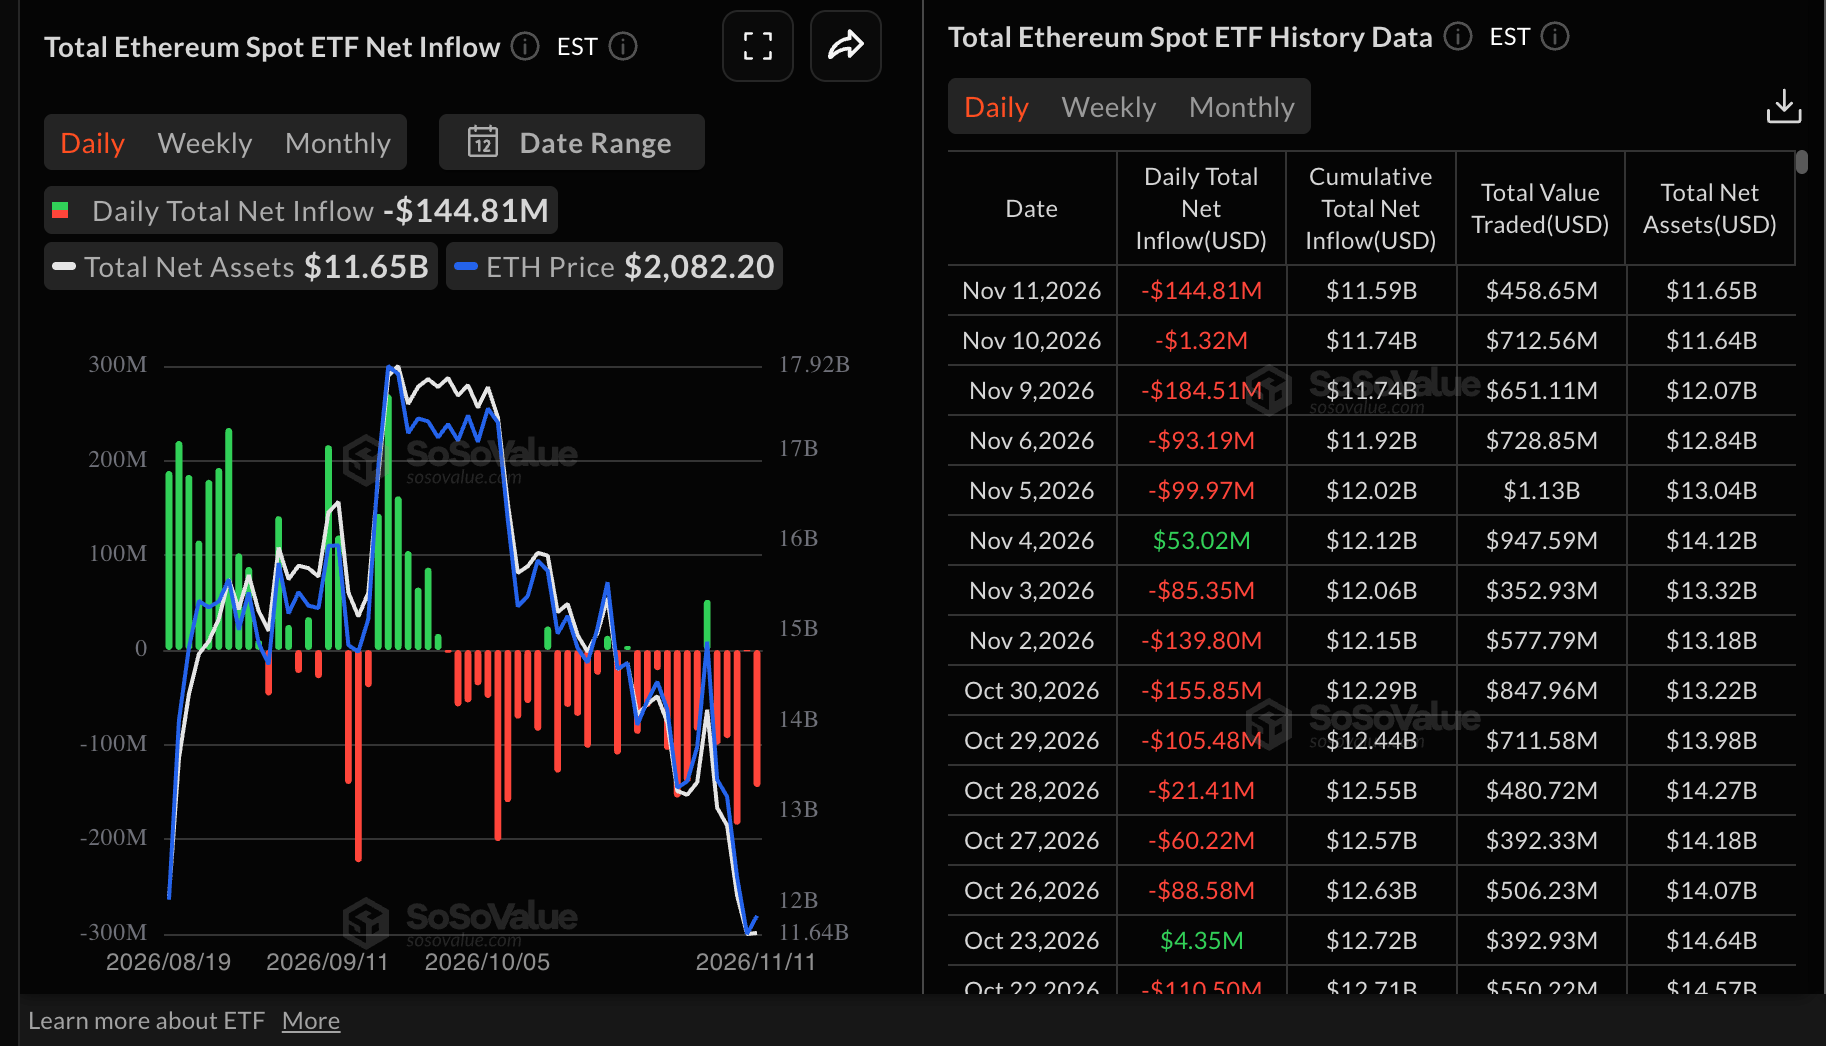
Ethereum spot ETFs saw $145 million in outflows on Wednesday, up from a very mild $1.3 million in withdrawals the previous day. This also marks the fifth straight day of outflows, bringing cumulative inflows to $11.6 billion and net assets to $11.7 billion.
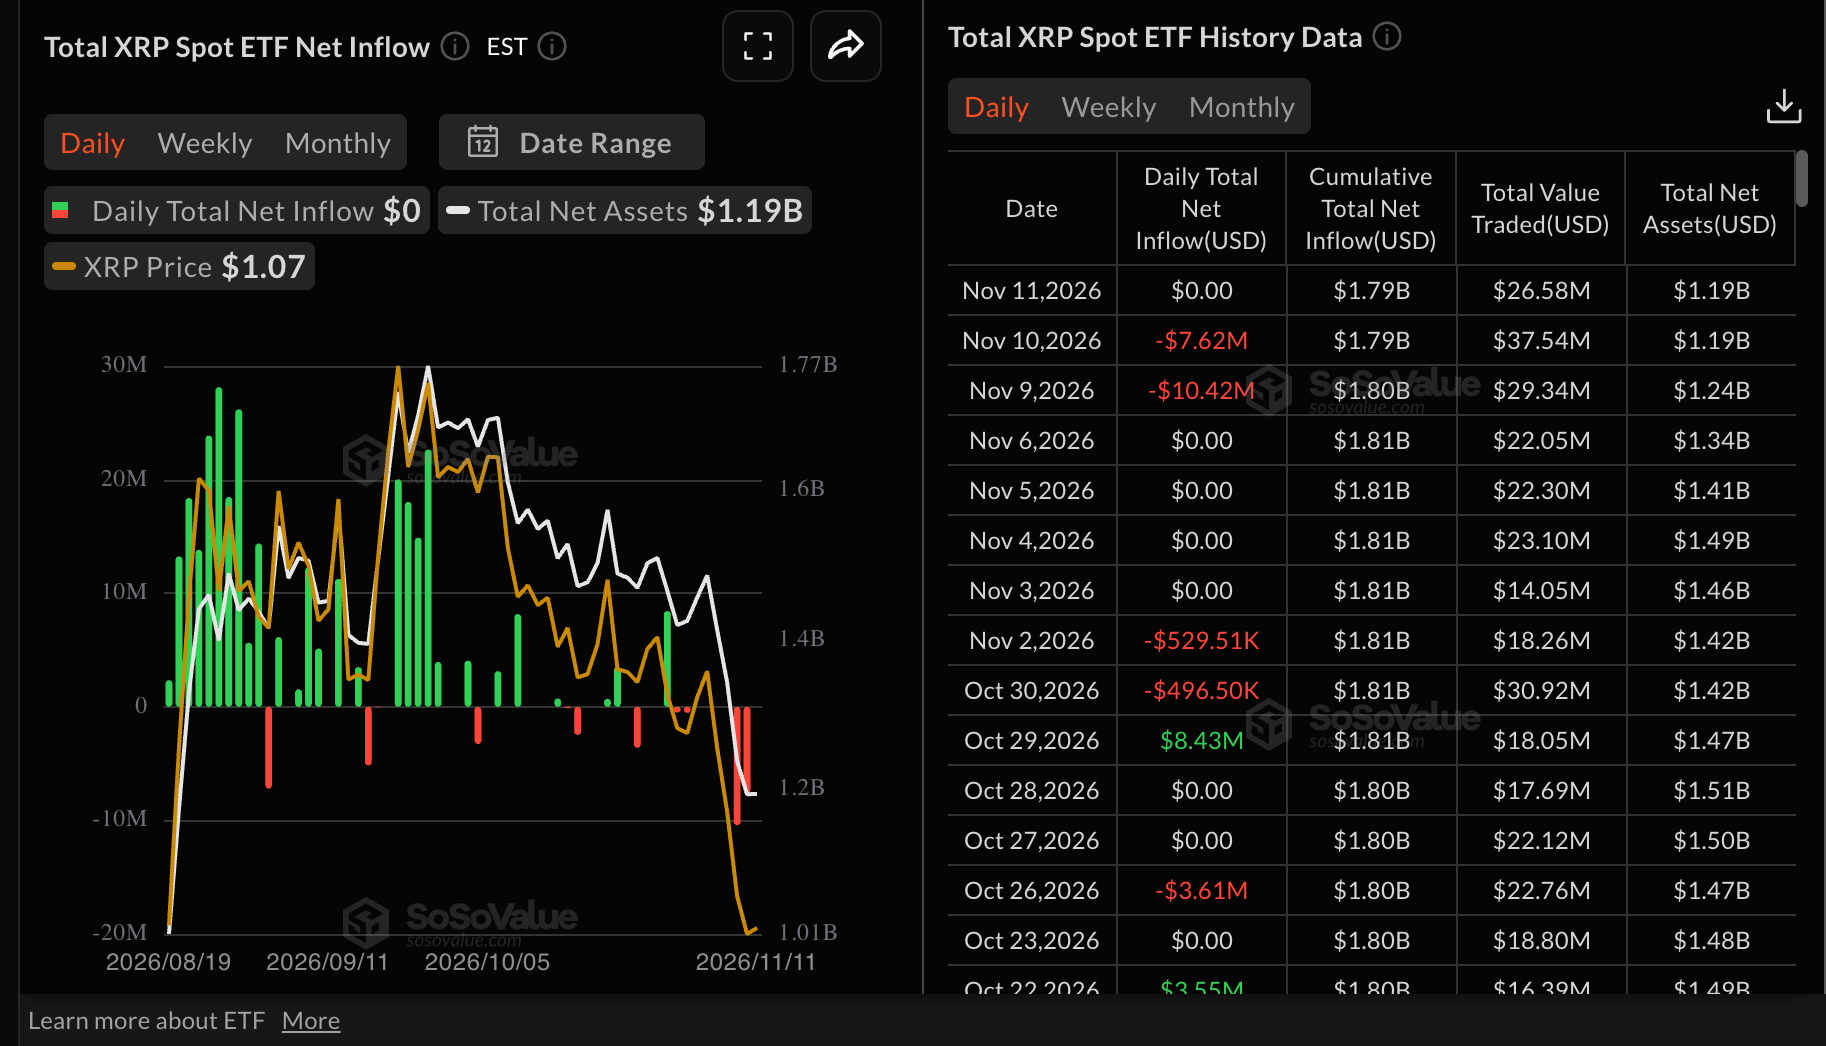
As for XRP spot ETFs, activity remained muted on Wednesday after posting two consecutive days of outflows totaling $7.6 million on Tuesday and $10.4 million on Monday. Cumulative inflows average $1.8 billion, with net assets at $1.2 billion.
Technical analysis: Bitcoin faces growing selling pressure
Bitcoin trades at $73,561, keeping a bearish near-term bias as price holds below the 50-day, 100-day and 200-day Exponential Moving Averages (EMAs) at $78,695, $77,411 and 7$6,736, respectively. The SuperTrend line at $80,128 also sits well above spot, reinforcing the notion that layered trend resistance caps the market.
Momentum remains weak, with the Relative Strength Index (RSI) at 34 hovering just above oversold territory, while the Moving Average Convergence Divergence (MACD) stays negative, hinting that downside pressure is still dominant despite the possibility of short-term relief bounces.
Initial resistance lies at the 200-day EMA near $76,736, followed by the 100-day EMA at $77,411 and then the 50-day EMA around $78,695, forming a dense technical ceiling that bulls would need to reclaim to ease the prevailing bearish tone. Higher, the SuperTrend barrier at $80,128 marks a broader structural hurdle. Only a sustained break above this level would suggest BTC is transitioning out of its current corrective phase.
Ethereum technical analysis: ETH holds above critical support
Ethereum trades at $2,047, extending its slide below all major moving averages as the near-term bias remains bearish. Price holds under the 200-day EMA near $2,296 and the 100-day EMA around $2,321, while the SuperTrend line at roughly $2,322 and the 50-day EMA close to $2,335 reinforce a dense overhead supply zone.
Momentum is weak, with the MACD indicator standing below zero and its latest reading negative, while the RSI hovers around 29, hinting at oversold conditions that could slow, but not yet reverse, the ongoing downside.
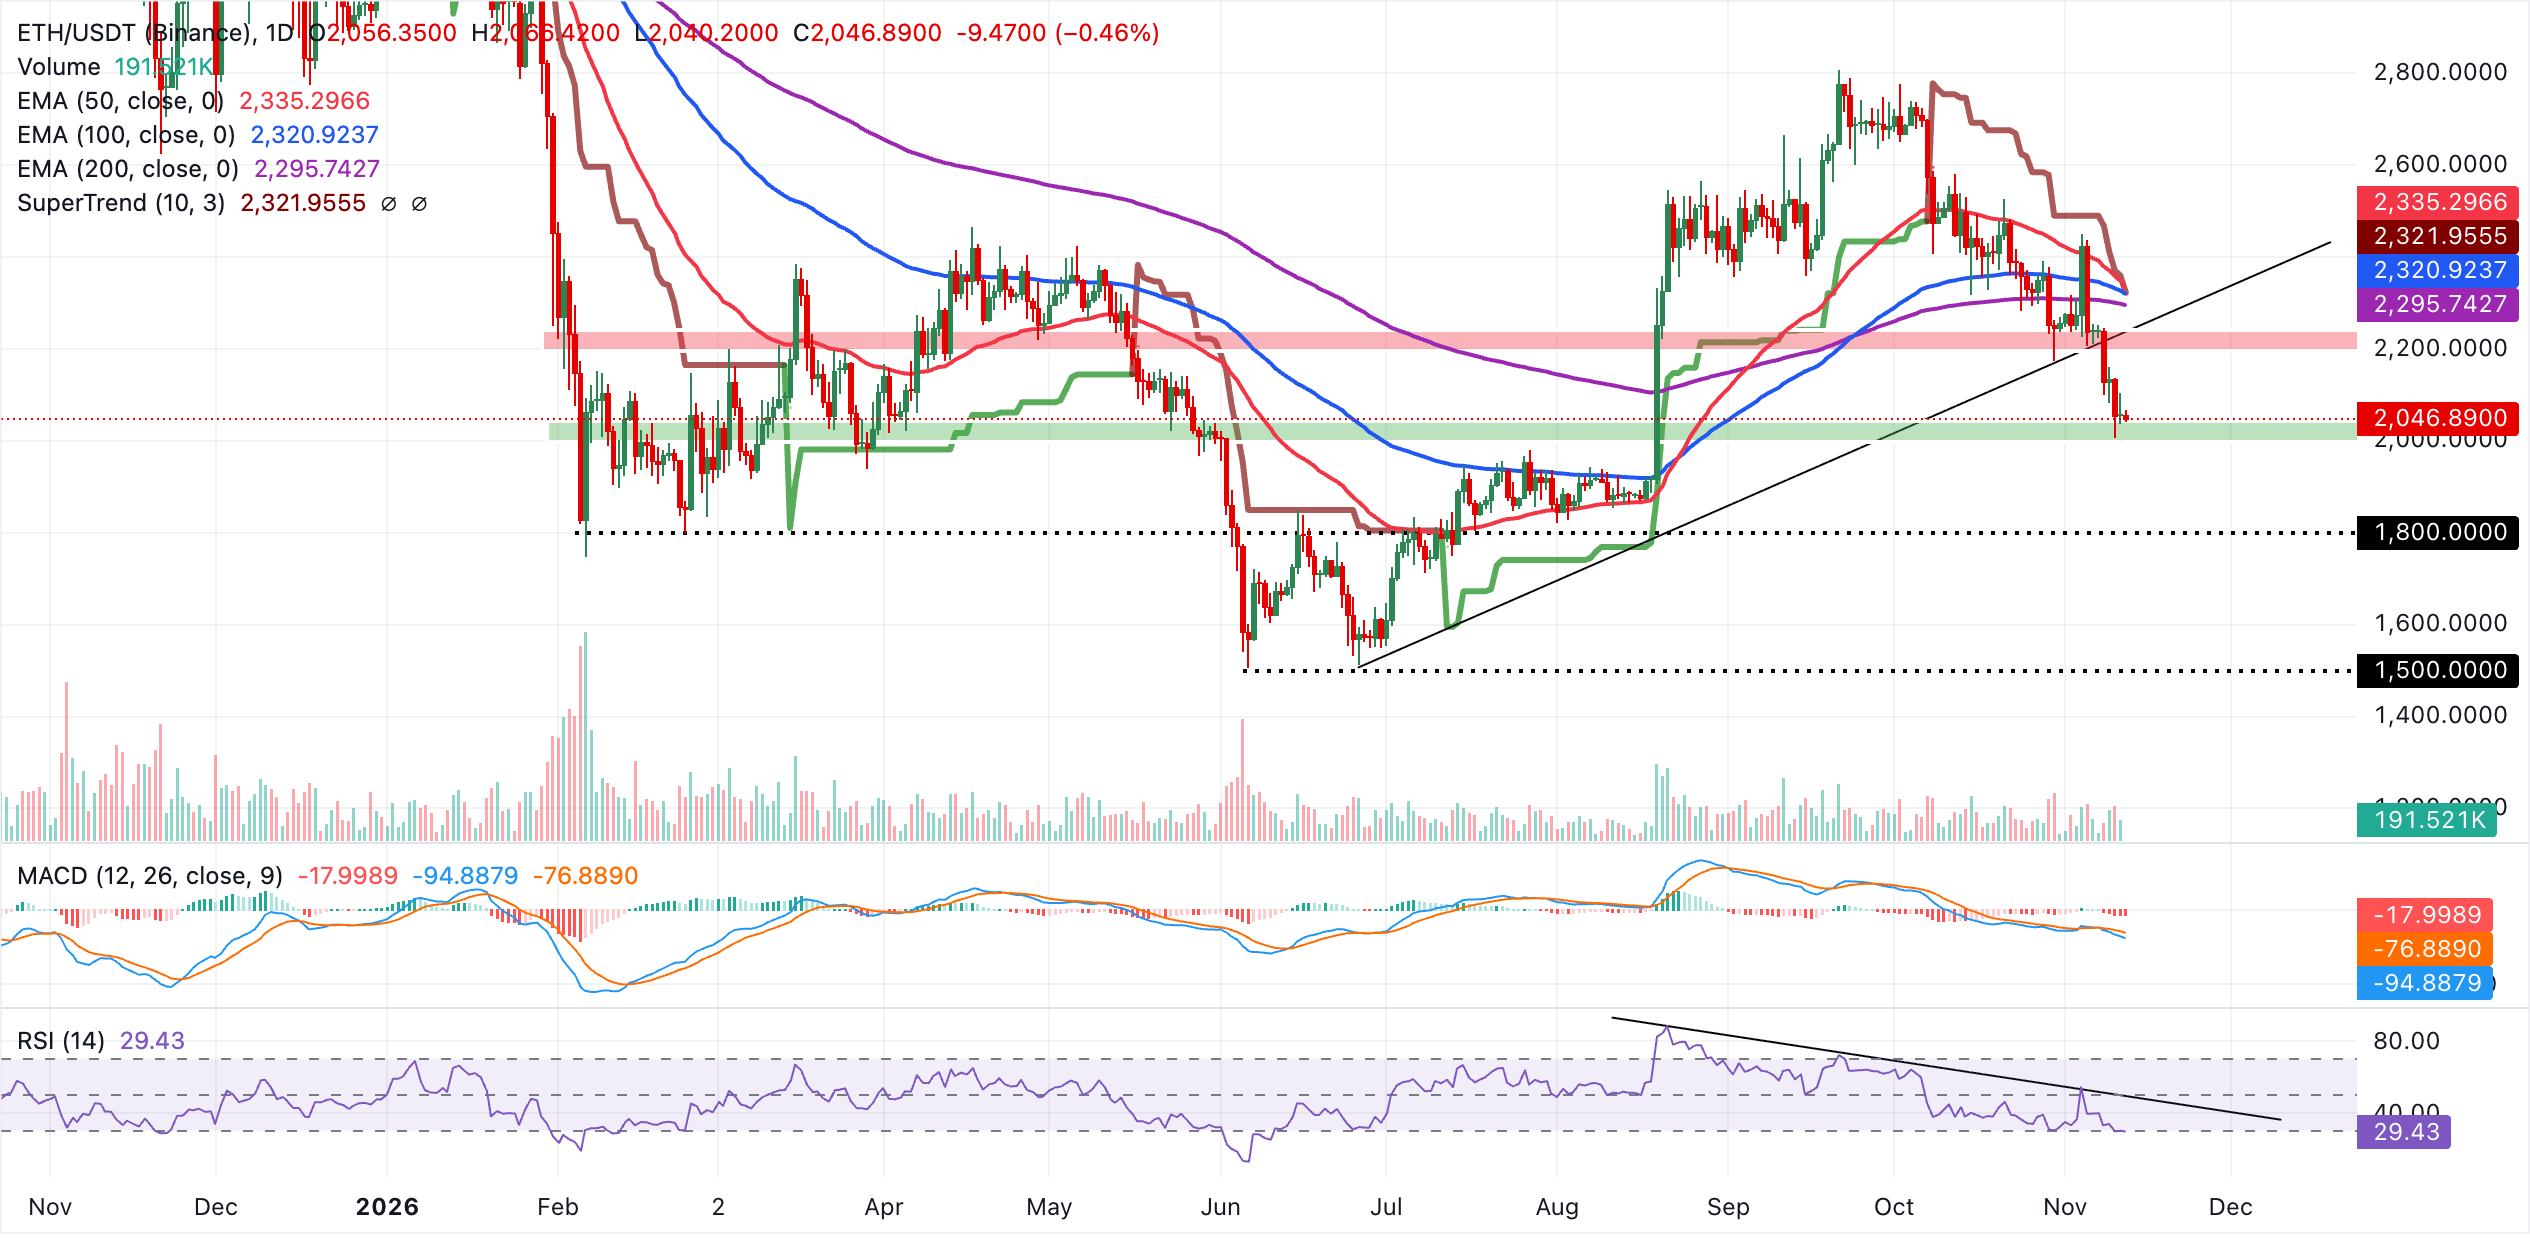
Initial resistance emerges at the former rising trendline break near $2,240, ahead of the 200-day EMA at $2,296. Higher, the 100-day EMA at $2,321 aligns with the SuperTrend at $2,322, forming a tighter barrier before the 50-day EMA at $2,335, which caps medium-term recovery prospects as long as price remains below it.
With no clear structural support levels defined on the daily chart, ETH would need to reclaim the $2,240-$2,296 area first to ease immediate bearish pressure and open the way for a more sustained rebound towards the clustered daily averages.
Technical analysis: XRP slides targeting $1.00
XRP trades at $1.04, extending a bearish phase with price entrenched well below the 50-day, 100-day and 200-day EMAs at $1.27, $1.29 and $1.34, respectively. The downtrend remains intact as the recent break under the descending trendline’s key level near $1.27 keeps the pair capped, while the SuperTrend at $1.21 adds another layer of overhead supply.
Momentum is weak, with the MACD below zero and its signal line and histogram stuck in negative territory, and the RSI sliding into oversold territory around 23, hinting at heavy selling pressure even if a short-lived bounce cannot be ruled out.
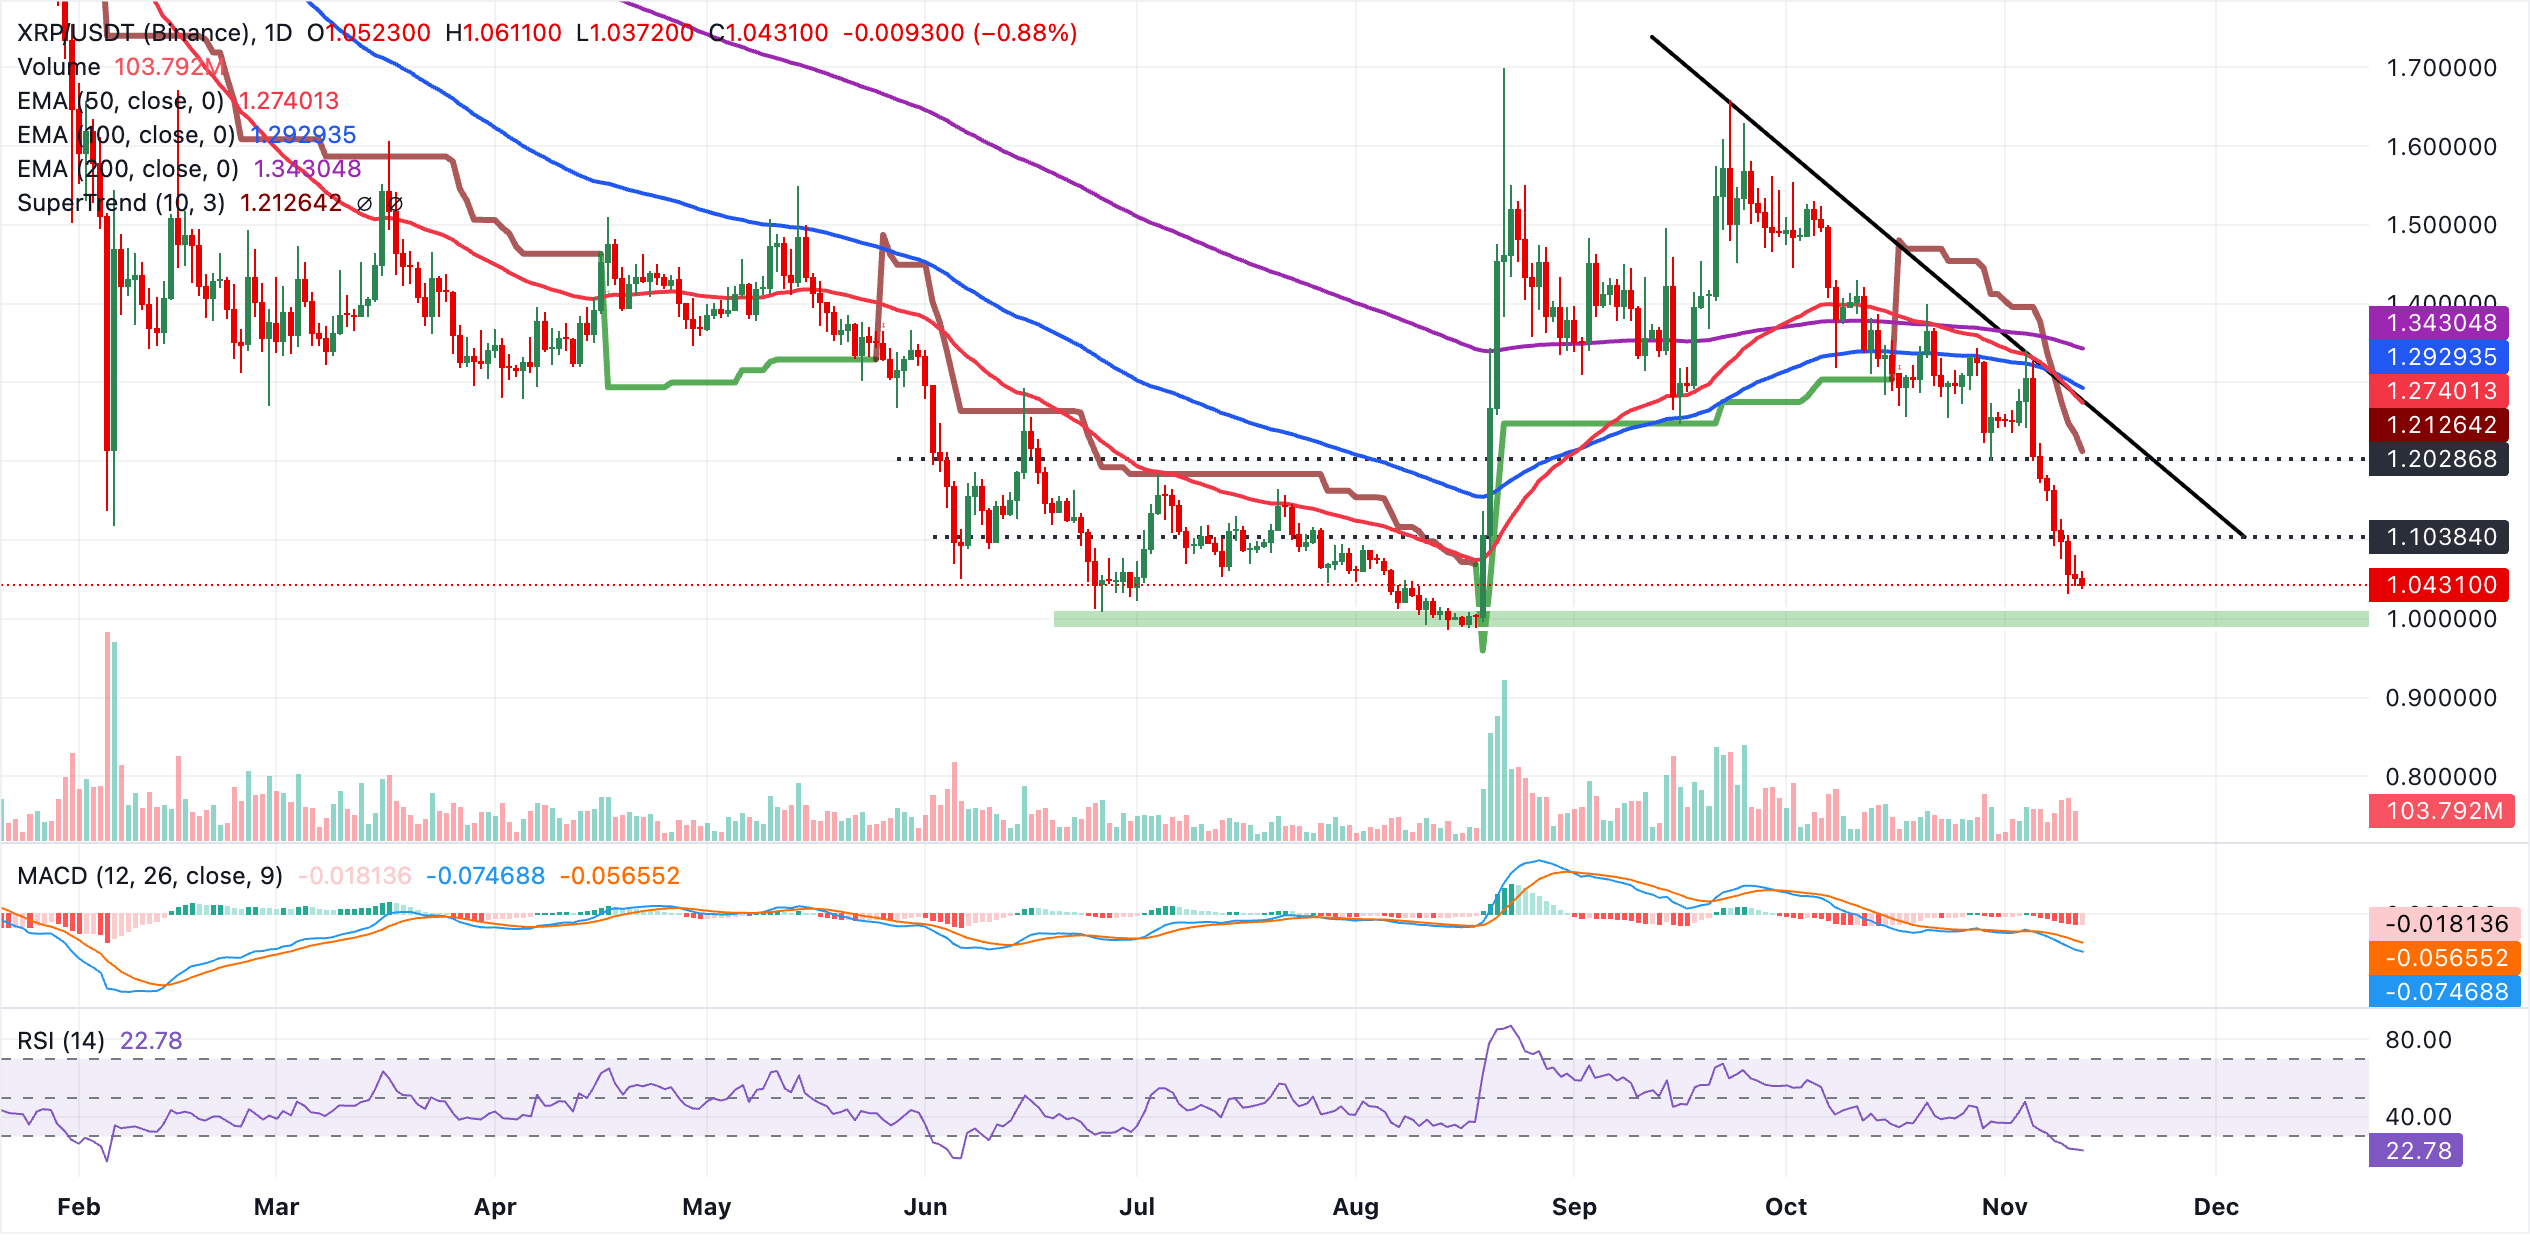
Initial resistance lies at the SuperTrend barrier around $1.21, followed by a dense cluster of technical hurdles in the $1.27-$1.27 area where the 50-day EMA meets the broken descending trendline. Above that zone, the 100-day EMA at $1.29 and the 200-day EMA near $1.34 stand as broader bearish milestones that would need to be reclaimed to ease the prevailing downside bias.
With no meaningful support levels indicated near the current price on the daily chart, the pair remains vulnerable to further declines unless oversold RSI conditions trigger a corrective recovery toward the mentioned resistance band.
(The technical analysis of this story was written with the help of an AI tool. Know more.)
Crypto ETF FAQs
An Exchange-Traded Fund (ETF) is an investment vehicle or an index that tracks the price of an underlying asset. ETFs can not only track a single asset, but a group of assets and sectors. For example, a Bitcoin ETF tracks Bitcoin’s price. ETF is a tool used by investors to gain exposure to a certain asset.
Yes. The first Bitcoin futures ETF in the US was approved by the US Securities & Exchange Commission in October 2021. A total of seven Bitcoin futures ETFs have been approved, with more than 20 still waiting for the regulator’s permission. The SEC says that the cryptocurrency industry is new and subject to manipulation, which is why it has been delaying crypto-related futures ETFs for the last few years.
Yes. The SEC approved in January 2024 the listing and trading of several Bitcoin spot Exchange-Traded Funds, opening the door to institutional capital and mainstream investors to trade the main crypto currency. The decision was hailed by the industry as a game changer.
The main advantage of crypto ETFs is the possibility of gaining exposure to a cryptocurrency without ownership, reducing the risk and cost of holding the asset. Other pros are a lower learning curve and higher security for investors since ETFs take charge of securing the underlying asset holdings. As for the main drawbacks, the main one is that as an investor you can’t have direct ownership of the asset, or, as they say in crypto, “not your keys, not your coins.” Other disadvantages are higher costs associated with holding crypto since ETFs charge fees for active management. Finally, even though investing in ETFs reduces the risk of holding an asset, price swings in the underlying cryptocurrency are likely to be reflected in the investment vehicle too.
추천 기사


