


Crypto Today: Bitcoin, Ethereum, XRP recovery cools amid returning capital inflows
- Bitcoin’s recovery takes a breather below $81,000 as inflows into spot ETFs cushion against selling pressure.
- Ethereum bulls eye short-term support from the 50-day EMA, backed by $53 million in ETF capital inflows.
- XRP marks three consecutive days of gains, trading above $1.32 despite muted ETF activity.
Cryptocurrency prices are broadly consolidating on Thursday, with Bitcoin (BTC) trading around $80,600 after its recent recovery stalled below $81,000. Ethereum (ETH) remains neutral-bullish, hovering above $2,400 as recovery momentum cools. Ripple (XRP), meanwhile, shows signs of the uptrend extending for the third consecutive day, trading above $1.32.
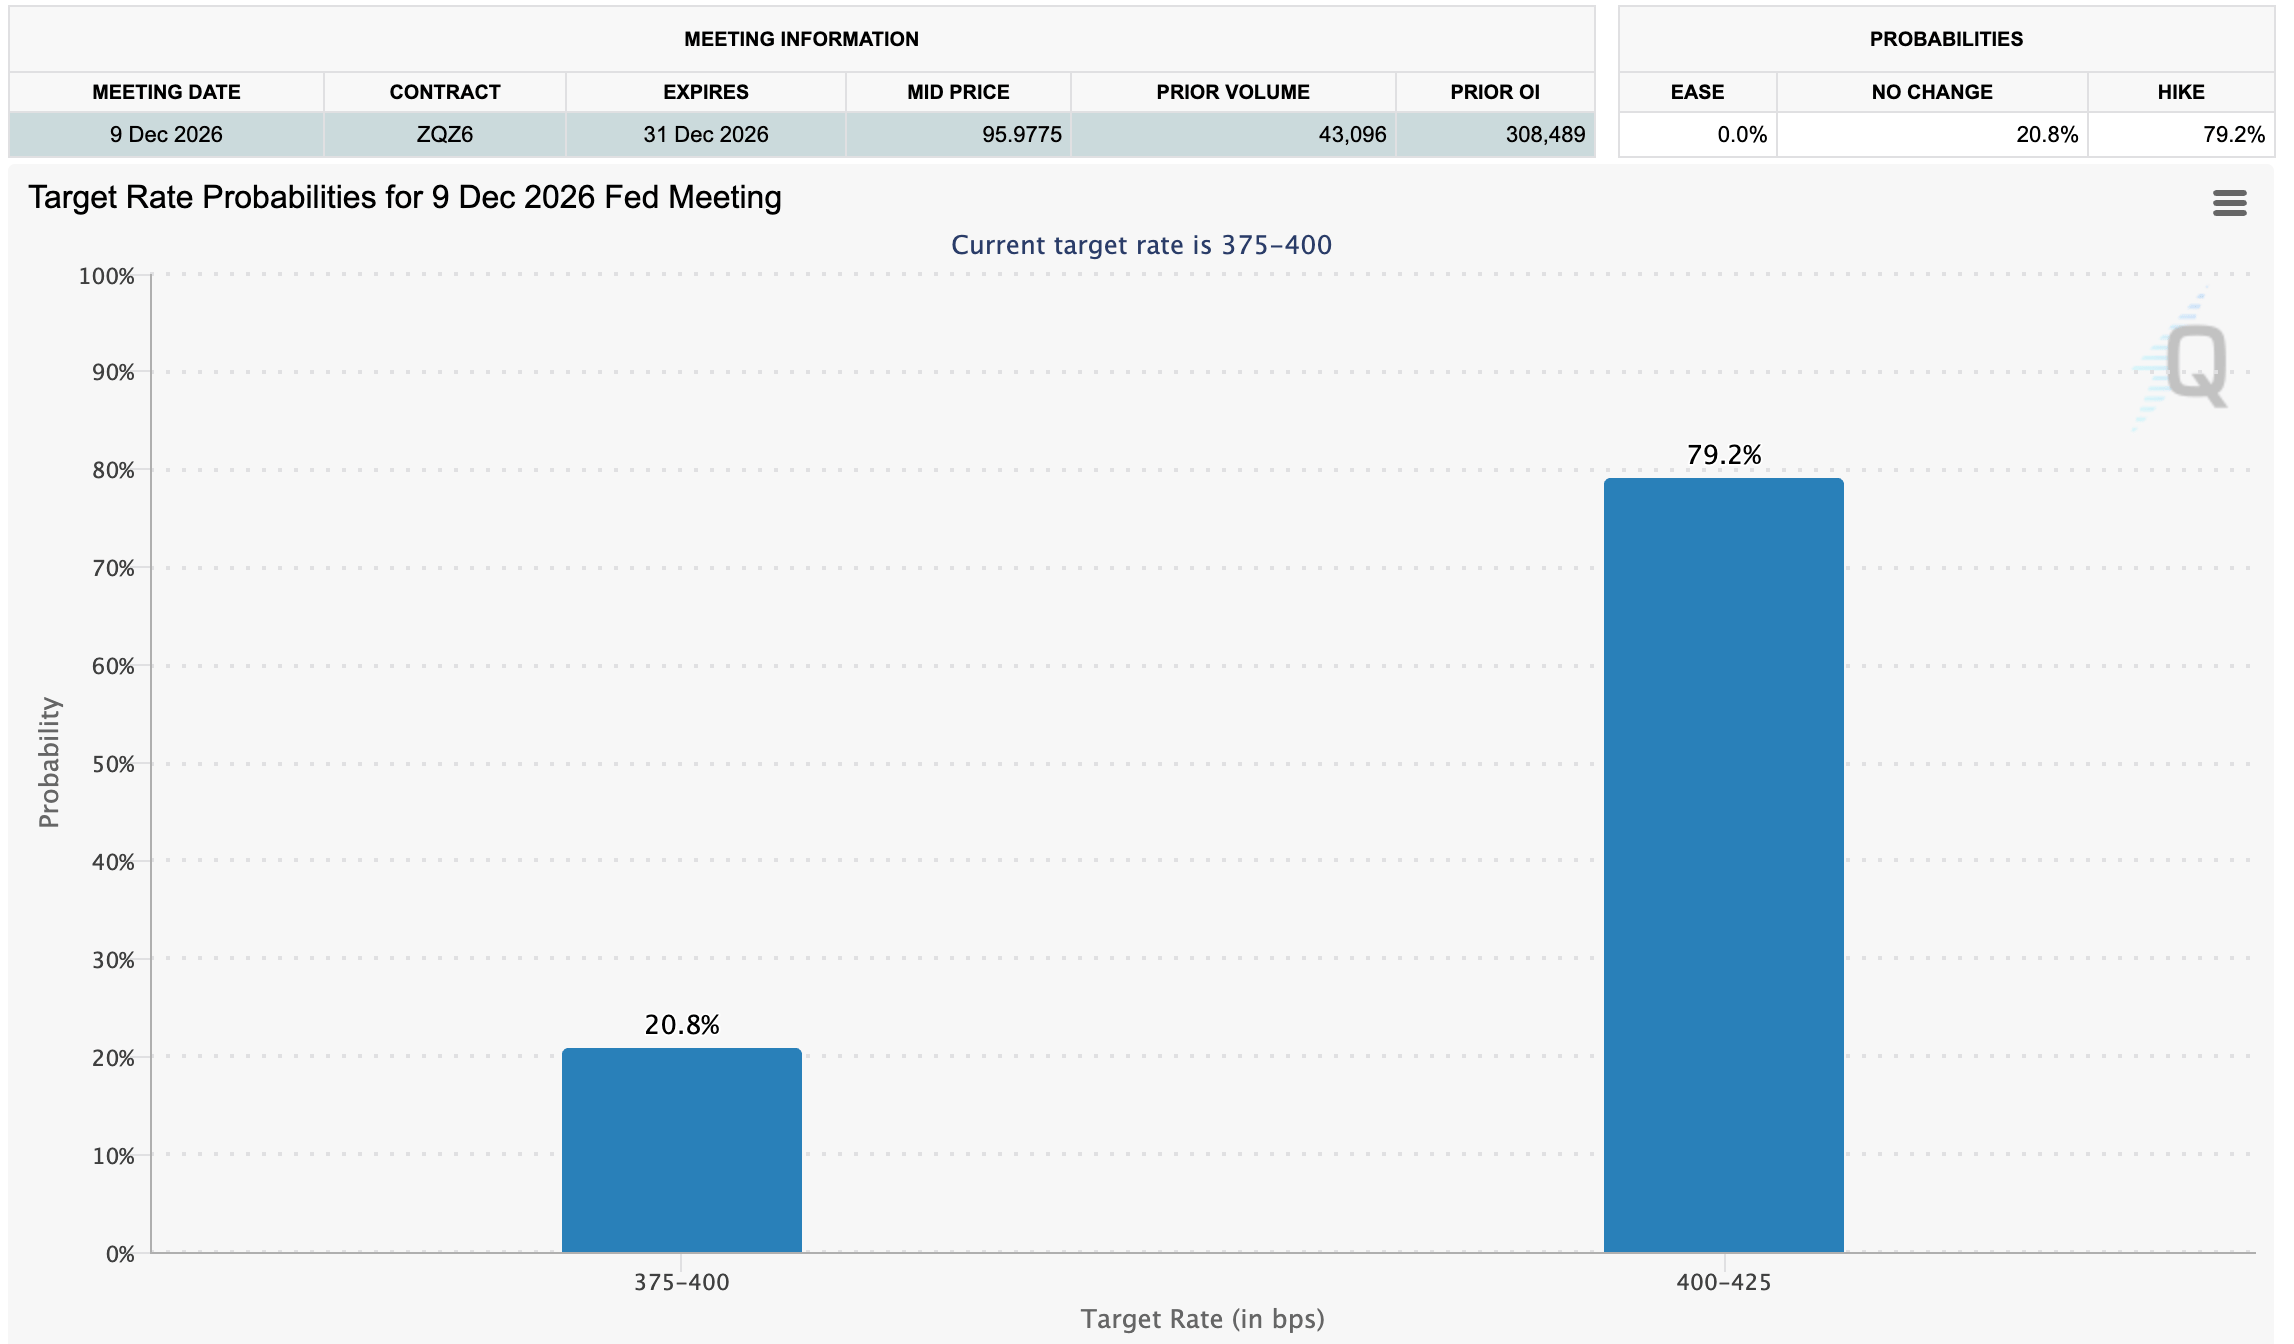
The crypto market gained momentum amid the United States (US) midterm elections, in which the Democrats emerged with a majority in Congress. Despite the recovery outlook, macro uncertainty remains, with market participants pricing in 79% odds that the Federal Reserve (Fed) will hike interest rates by 25 basis points in December. Only 21% of traders expect the central bank to keep rates unchanged in the 3.75-4.00% range.
Crypto ETFs see fresh ETF inflows
Interest in digital investment products, including spot Exchange-Traded Funds (ETFs), began improving after the market weathered the Binance hack, which impacted roughly $6.3 billion in assets and raised concerns about the safety of investors' funds on centralized exchanges (CEXs).
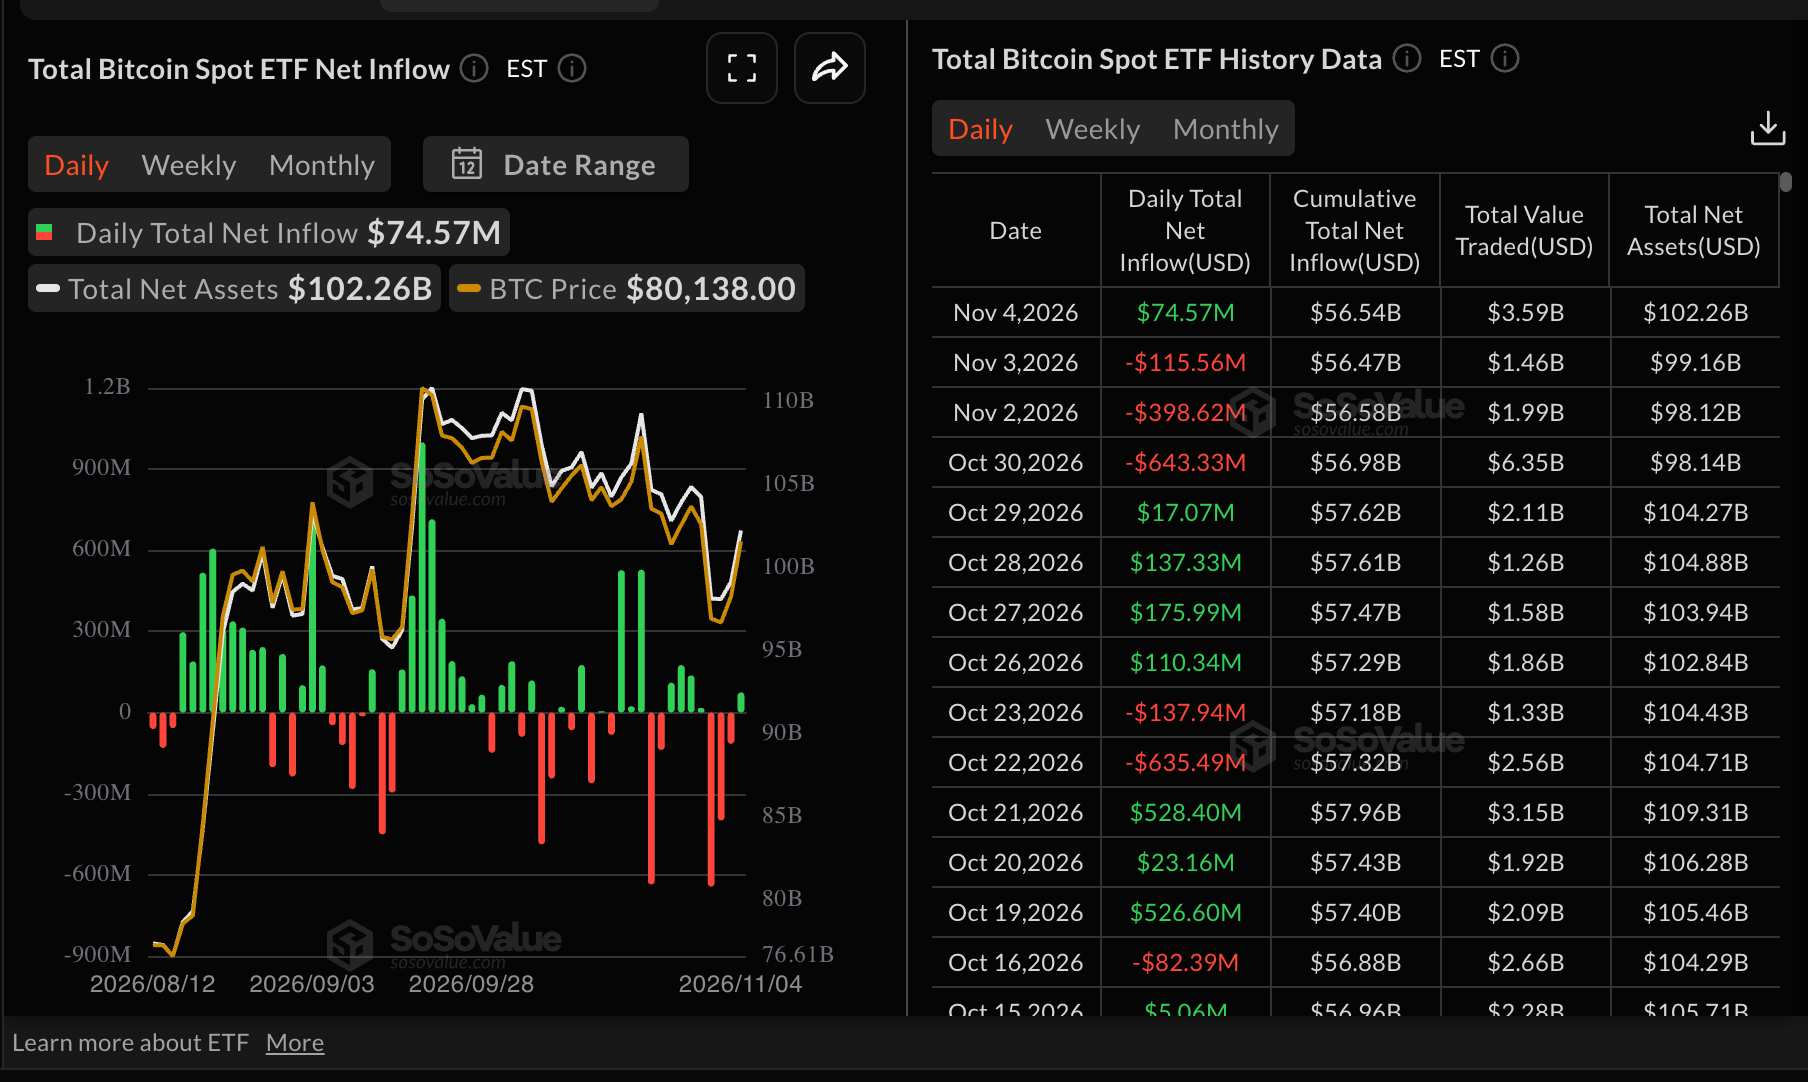
Bitcoin spot ETFs recorded approximately $75 million in inflows on Wednesday, breaking a three-day bearish streak. Still, this turnaround is not enough to gauge institutional investor interest. Flows in the coming days and weeks will play a key role in either defending the prevailing bullish outlook or invalidating it.
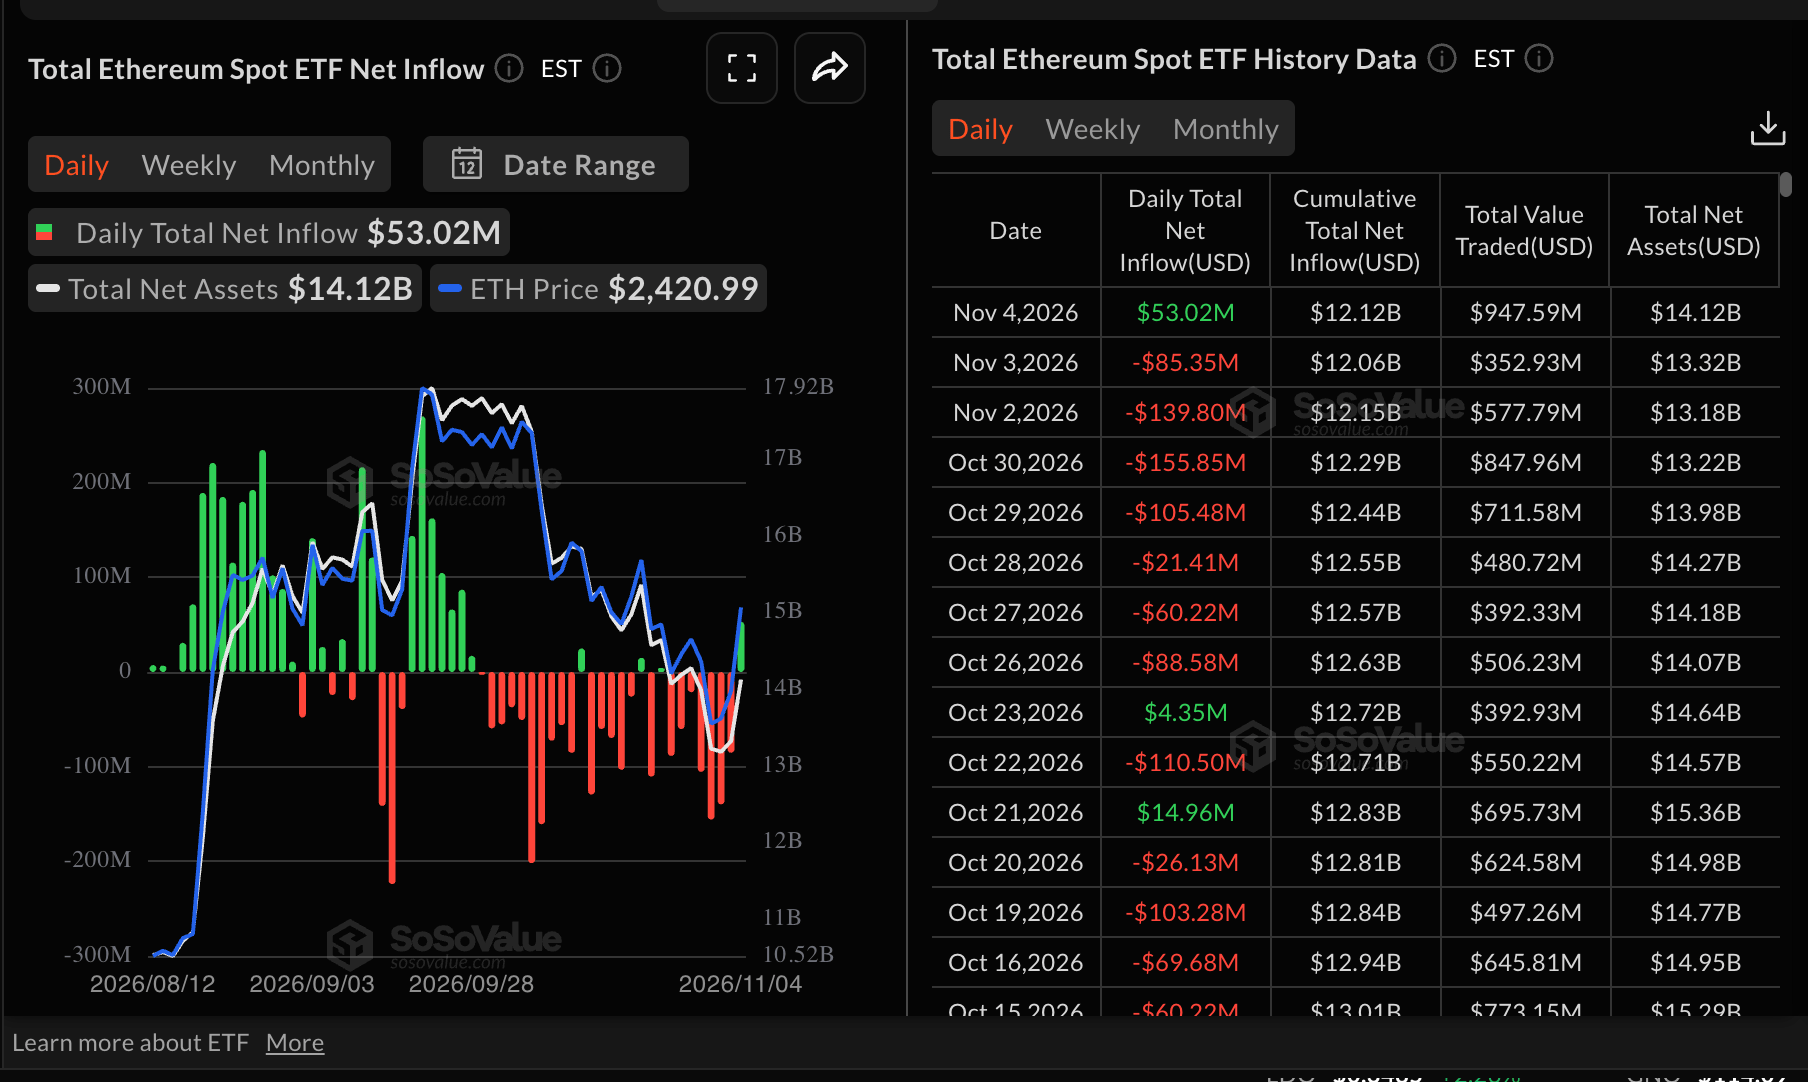
Ethereum spot ETFs recorded roughly $53 million in inflows on Wednesday, a move that broke seven consecutive days of outflows. The inflows suggest investors may be willing to increase risk exposure, anticipating a steady price increase toward short-term resistance at $2,600 and the medium-term hurdle at $2,800.
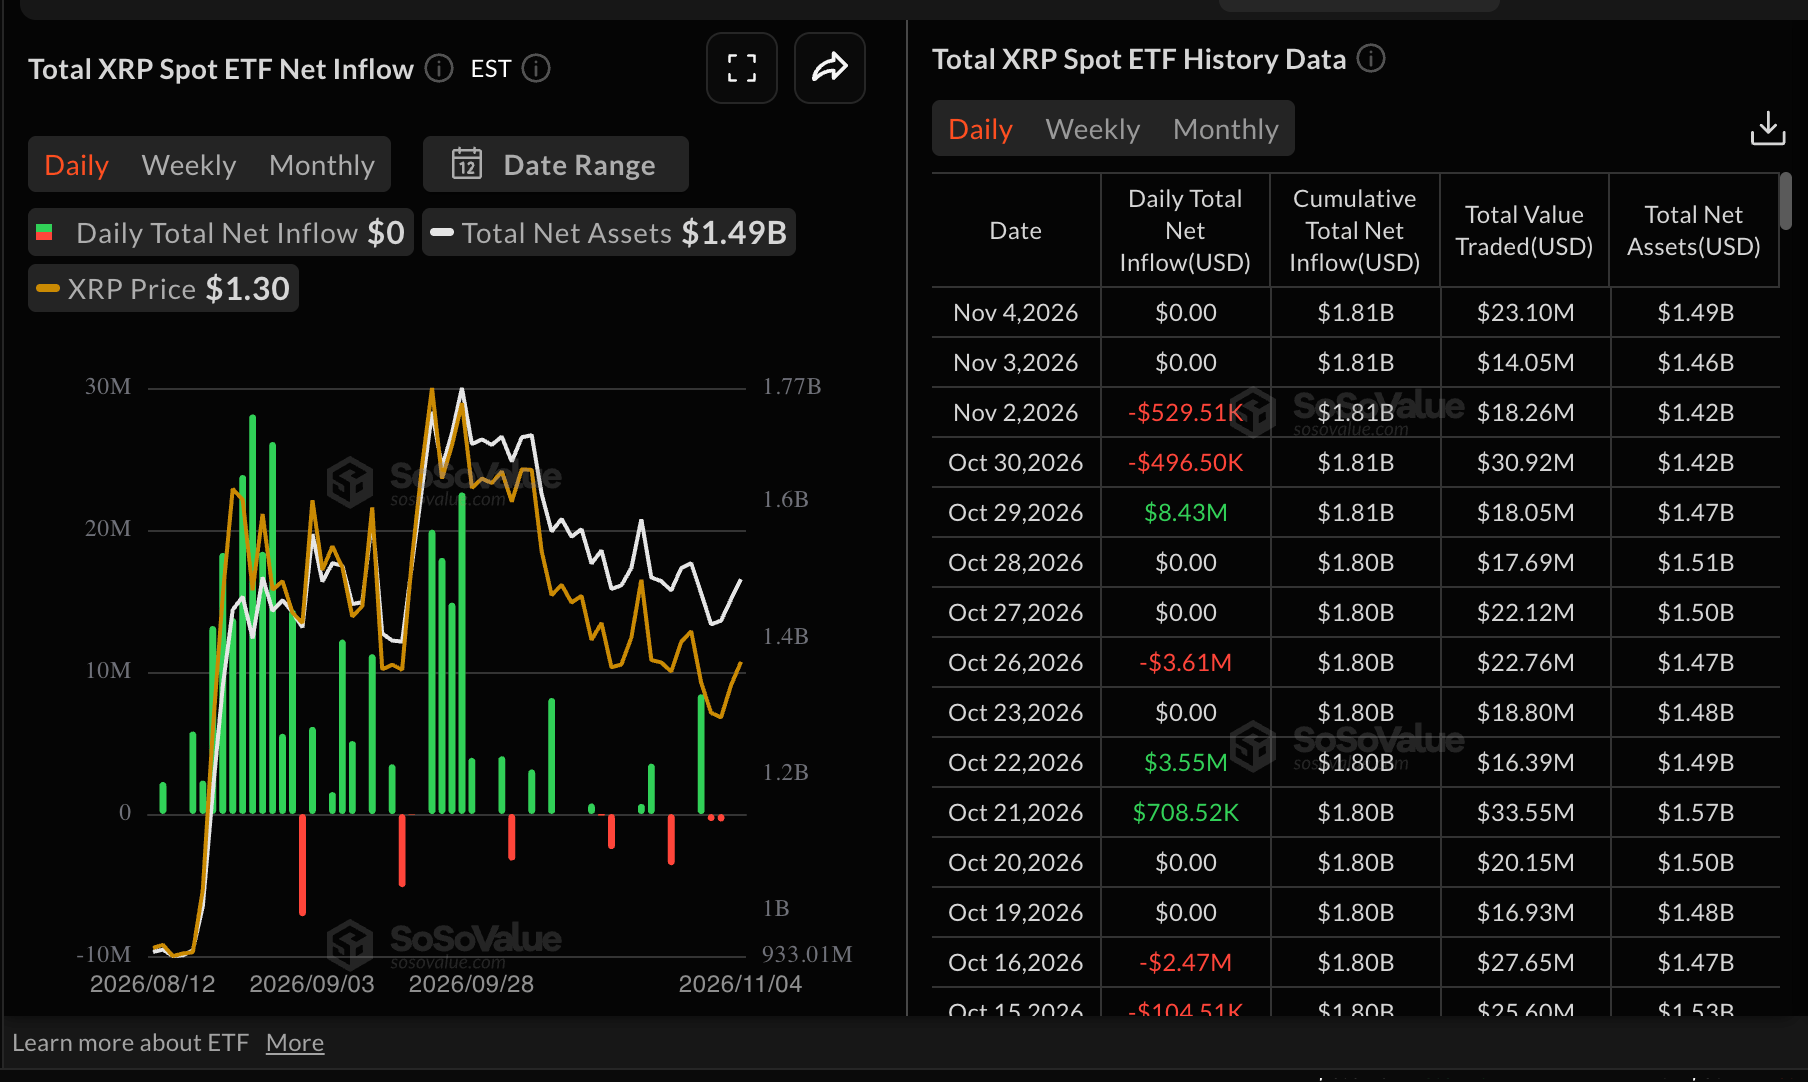
As for XRP spot ETFs, the picture remains dull, as activity has stayed muted for two days against the backdrop of mild outflows totaling $530,000 on Monday and $497,000 last Friday. Still, cumulative inflows remain positive at $1.8 billion, with net assets under management at $1.5 billion, suggesting investors maintain a long-term bullish outlook on the underlying XRP token.
Technical analysis: Bitcoin regains bullish strength
Bitcoin trades at $80,615, holding a mildly bullish bias as price sits above the 50-day, 100-day and 200-day Exponential Moving Averages (EMAs). The pair is consolidating after reclaiming the short-term EMA cluster, with the 50-day EMA at $80,166 now underpinning the advance, while the SuperTrend line at $82,920 caps the topside.
Momentum is improving as the Moving Average Convergence Divergence (MACD) has turned positive and the Relative Strength Index (RSI) hovers just above 50, suggesting buyers retain near-term initiative but lack clear breakout conviction.
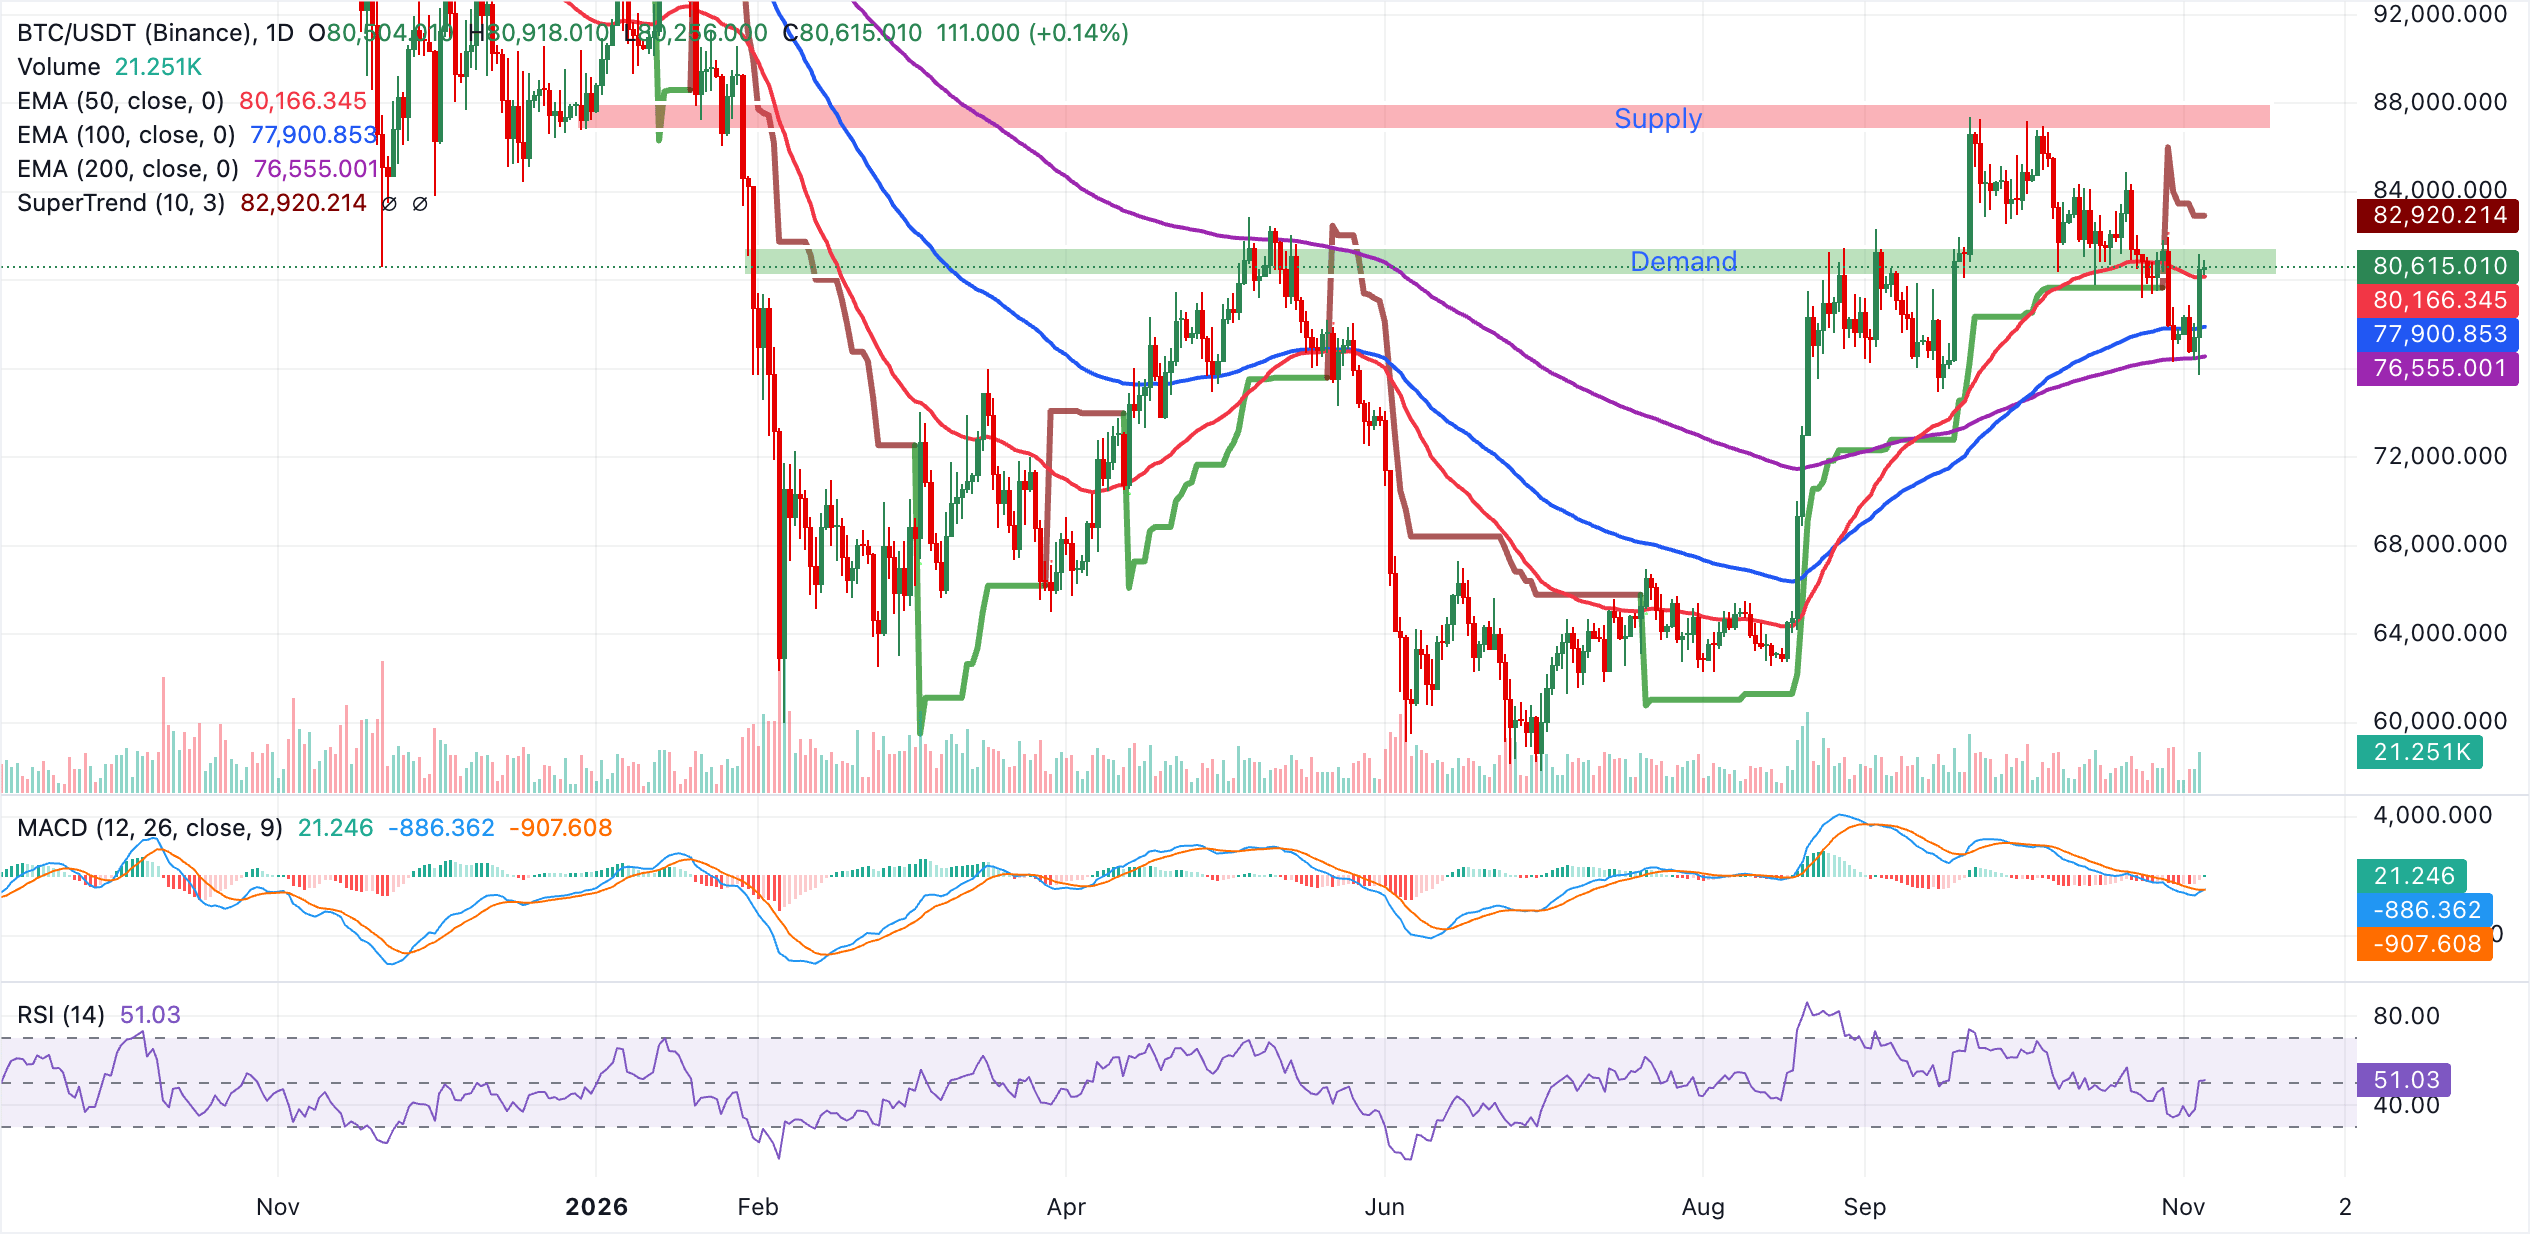
Immediate resistance lies at the SuperTrend barrier around $82,920, and a daily close above this level would open the way for a stronger continuation of the uptrend. On the downside, initial support emerges at the 50-day EMA near $80,166, followed by the 100-day EMA at $77,901 and the 200-day EMA around $76,555. A break back below the 50-day EMA would weaken the constructive tone and expose a deeper pullback toward the longer-term averages.
Ethereum technical analysis: ETH recovery stalls as bulls eye further gains
Ethereum trades at $2,423, holding a constructive bias as it stays above the 50-day, 100-day and 200-day EMAs clustered between roughly $2,400 and $2,310. This positioning suggests the broader uptrend remains intact, while the recent pullback from the highs looks more like consolidation above the long-term base around the 200-day EMA at $2,316.
Momentum supports the bullish tilt, with the MACD turning positive and moving above the zero line, and the RSI hovering around 54, indicating mild buying pressure rather than overbought conditions.
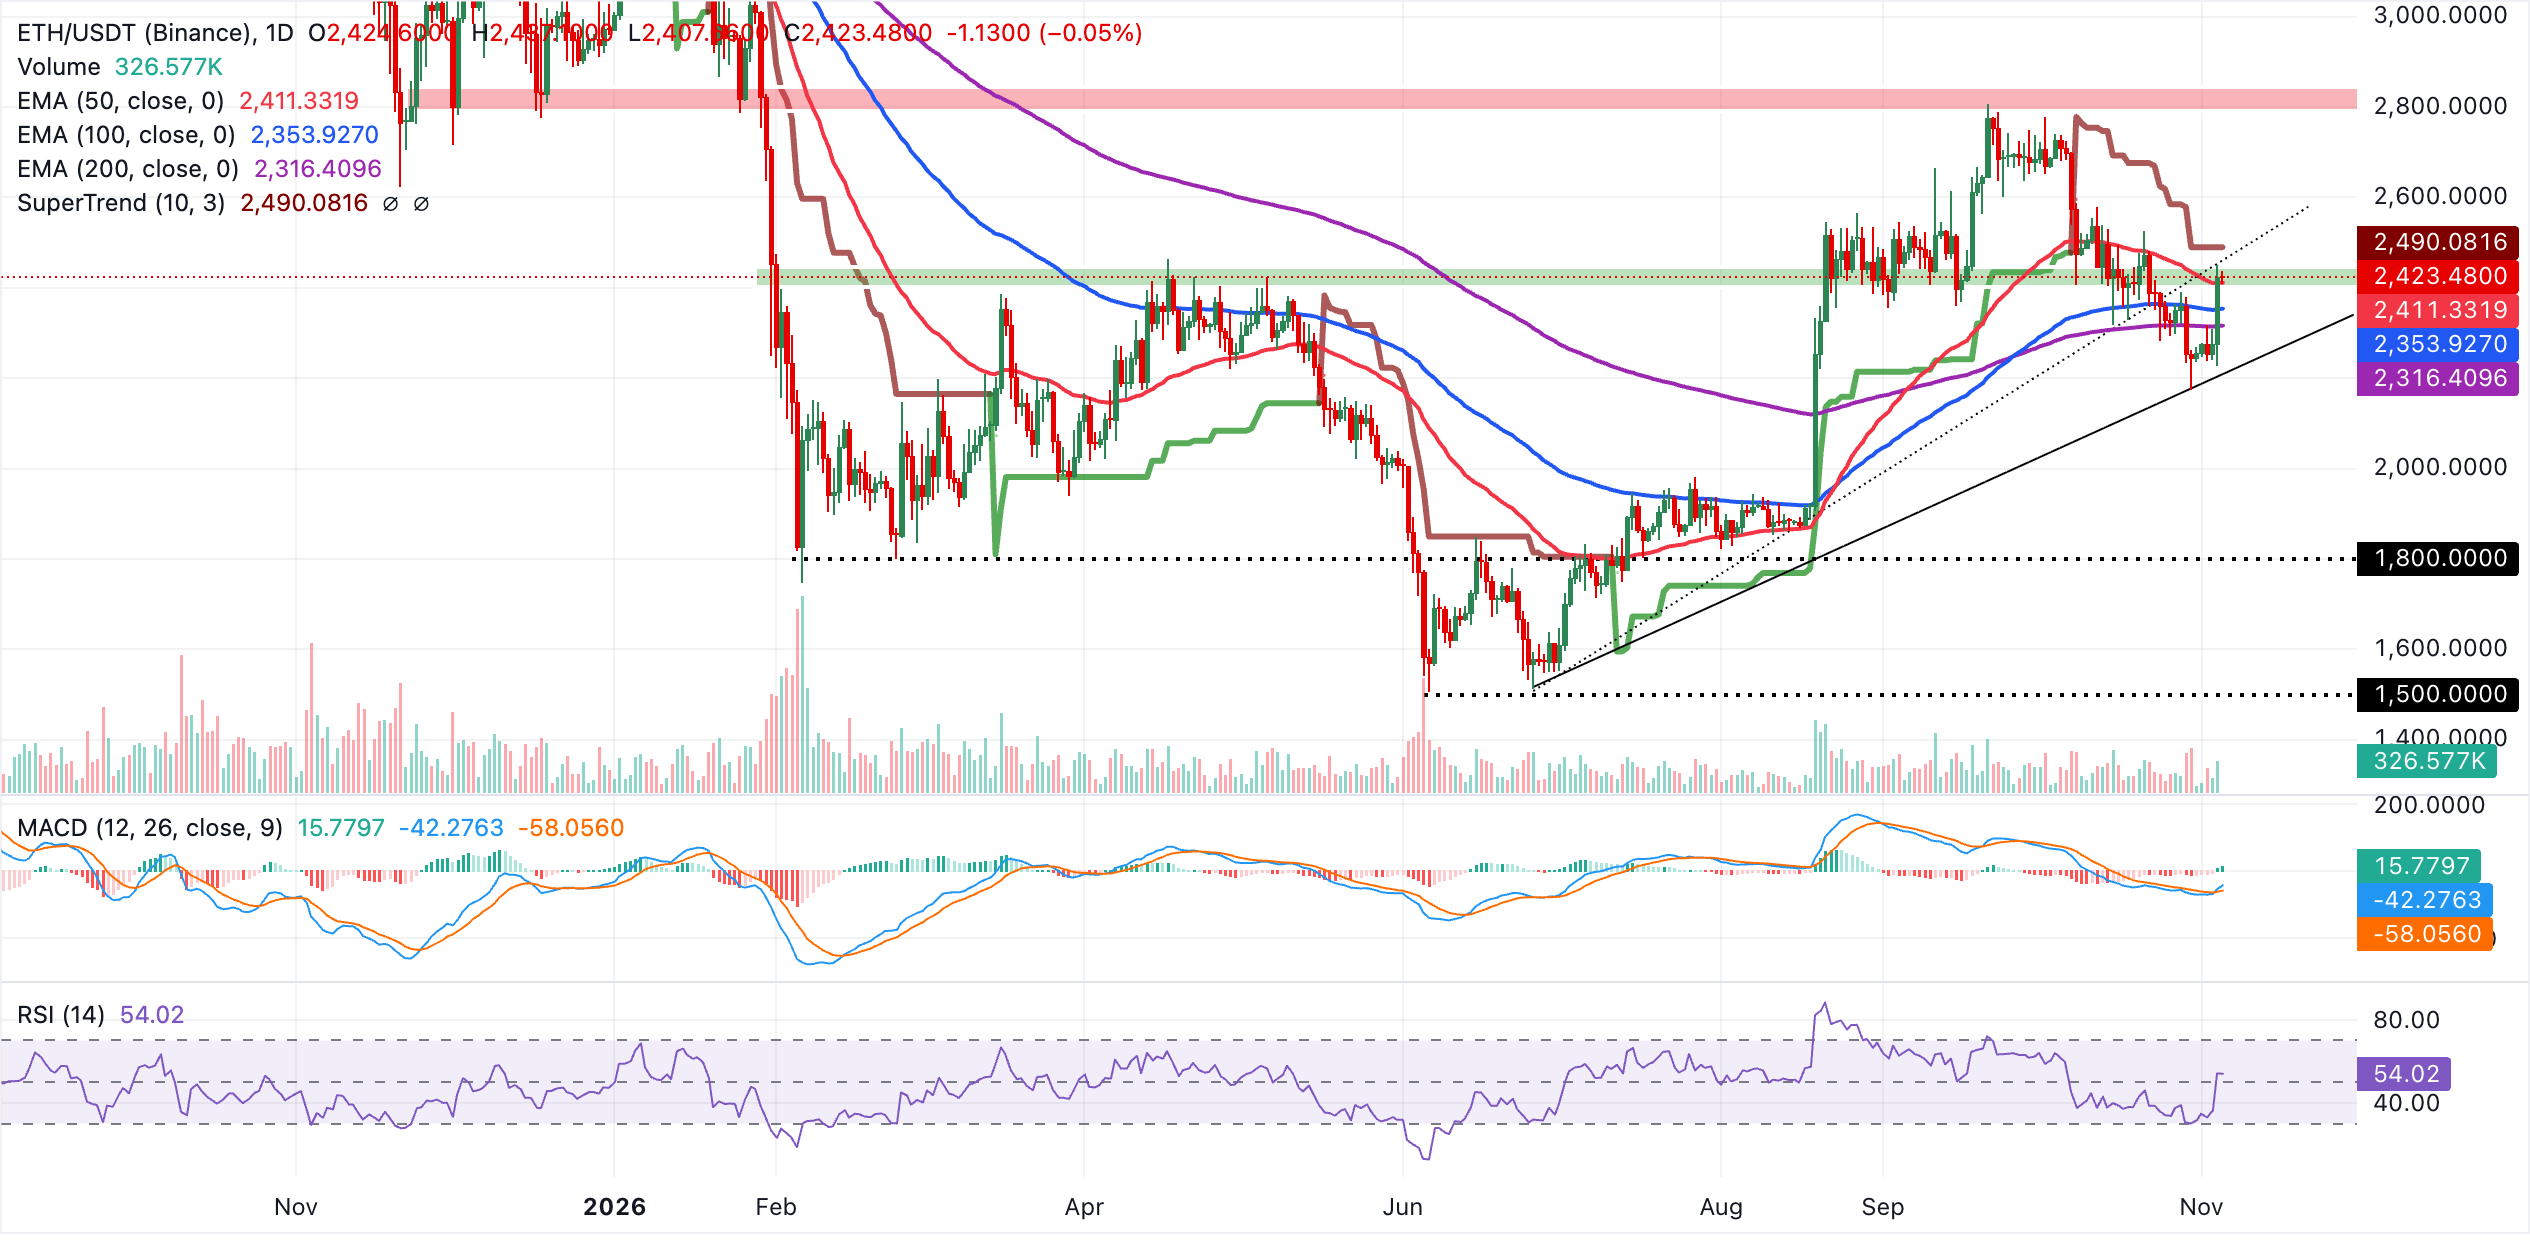
Immediate resistance lies at the broken rising trend support now acting as a barrier near $2,463, followed by the SuperTrend line at $2,490, where sellers could attempt to cap further gains. On the downside, the first layer of demand is aligned with the 50-day EMA at $2,411, with additional support at the 100-day EMA at $2,354 and the 200-day EMA at $2,316. A deeper setback towards the second, lower uptrend line around $2,211 would only come into focus if price decisively loses the entire EMA stack.
Technical analysis: XRP extends recovery
XRP trades at $1.32 as the token edges higher for the third straight day. Nonetheless, price remains capped as it sits beneath the 50-day and 200-day EMAs, despite reclaiming the 100-day EMA as nearby support. The MACD has turned marginally positive, and the RSI at about 51 has nudged into neutral-to-bullish territory, suggesting improving momentum. Still, prevailing structure points to upside attempts facing supply at the overhead averages and the active SuperTrend line.
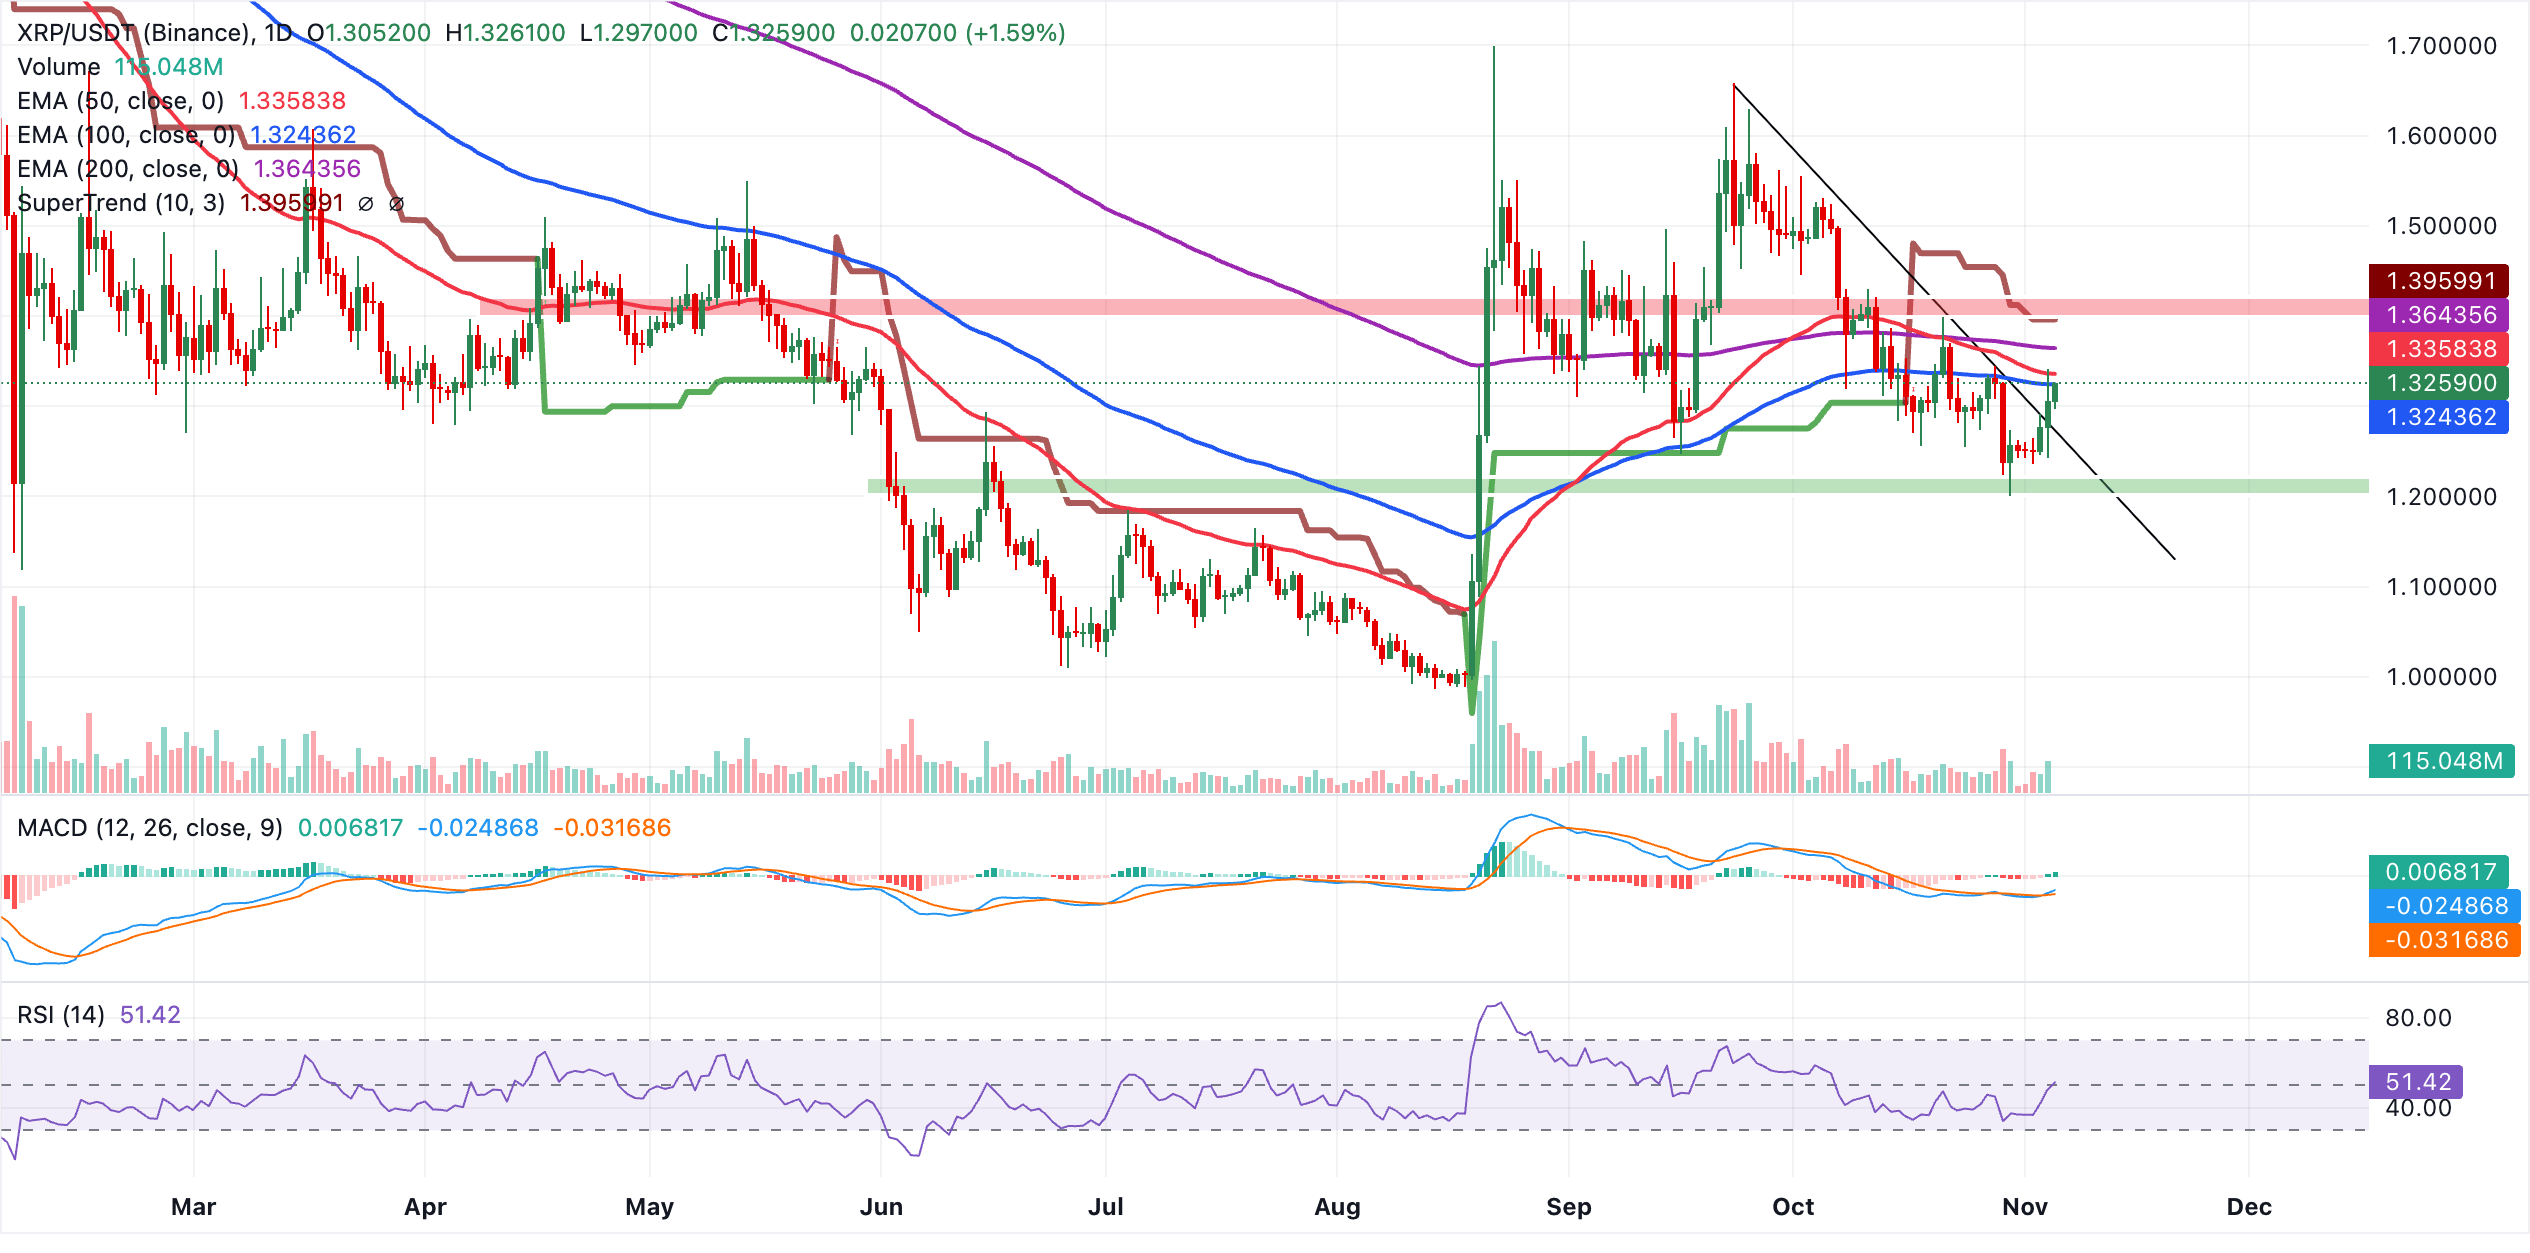
Initial resistance emerges at the 50-day EMA around $1.34, with the 200-day EMA near $1.36 reinforcing a broader supply band, while the SuperTrend line at roughly $1.40 marks a stronger bullish validation barrier. On the downside, the 100-day EMA at $1.32 provides immediate support, and any sustained break lower exposes the prior trendline break area near $1.27 as the next notable demand zone.
(The technical analysis of this story was written with the help of an AI tool. Know more.)
Cryptocurrency prices FAQs
Token launches influence demand and adoption among market participants. Listings on crypto exchanges deepen the liquidity for an asset and add new participants to an asset’s network. This is typically bullish for a digital asset.
A hack is an event in which an attacker captures a large volume of the asset from a DeFi bridge or hot wallet of an exchange or any other crypto platform via exploits, bugs or other methods. The exploiter then transfers these tokens out of the exchange platforms to ultimately sell or swap the assets for other cryptocurrencies or stablecoins. Such events often involve an en masse panic triggering a sell-off in the affected assets.
Macroeconomic events like the US Federal Reserve’s decision on interest rates influence crypto assets mainly through the direct impact they have on the US Dollar. An increase in interest rate typically negatively influences Bitcoin and altcoin prices, and vice versa. If the US Dollar index declines, risk assets and associated leverage for trading gets cheaper, in turn driving crypto prices higher.
Halvings are typically considered bullish events as they slash the block reward in half for miners, constricting the supply of the asset. At consistent demand if the supply reduces, the asset’s price climbs.
추천 기사


