


Top Altcoins Price Forecast: Ripple, Cardano, and Solana brace for further downside move
- Ripple hovers around $1.25 on Tuesday, stabilizing after a nearly 7% decline on Thursday.
- Cardano extends losses, trading below $0.19 after four consecutive negative weeks and a roughly 21% decline in October.
- Solana extends its decline toward a rising support trendline as selling pressure mounts, following a roughly 20% drop in October.
Top altcoins, including Ripple (XRP), Cardano (ADA), and Solana (SOL), remain weak ahead of the US midterm elections on Tuesday, as last week's $6.3 billion Binance hack has dampened social sentiment. Ripple and Solana spot Exchange-Traded Funds (ETFs) face selling pressure, while a rise in Cardano futures Open Interest suggests a bearish buildup in positions. The technical outlook for XRP, ADA, and SOL suggests a downside bias as selling pressure mounts.
Altcoins face bearish pressure
XRP ETFs are facing selling pressure this week, with $529,510 in outflows on Monday, while SOL ETFs recorded total outflows of $71.47 million last week, marking their fourth consecutive week of heavy redemptions from institutional investors.
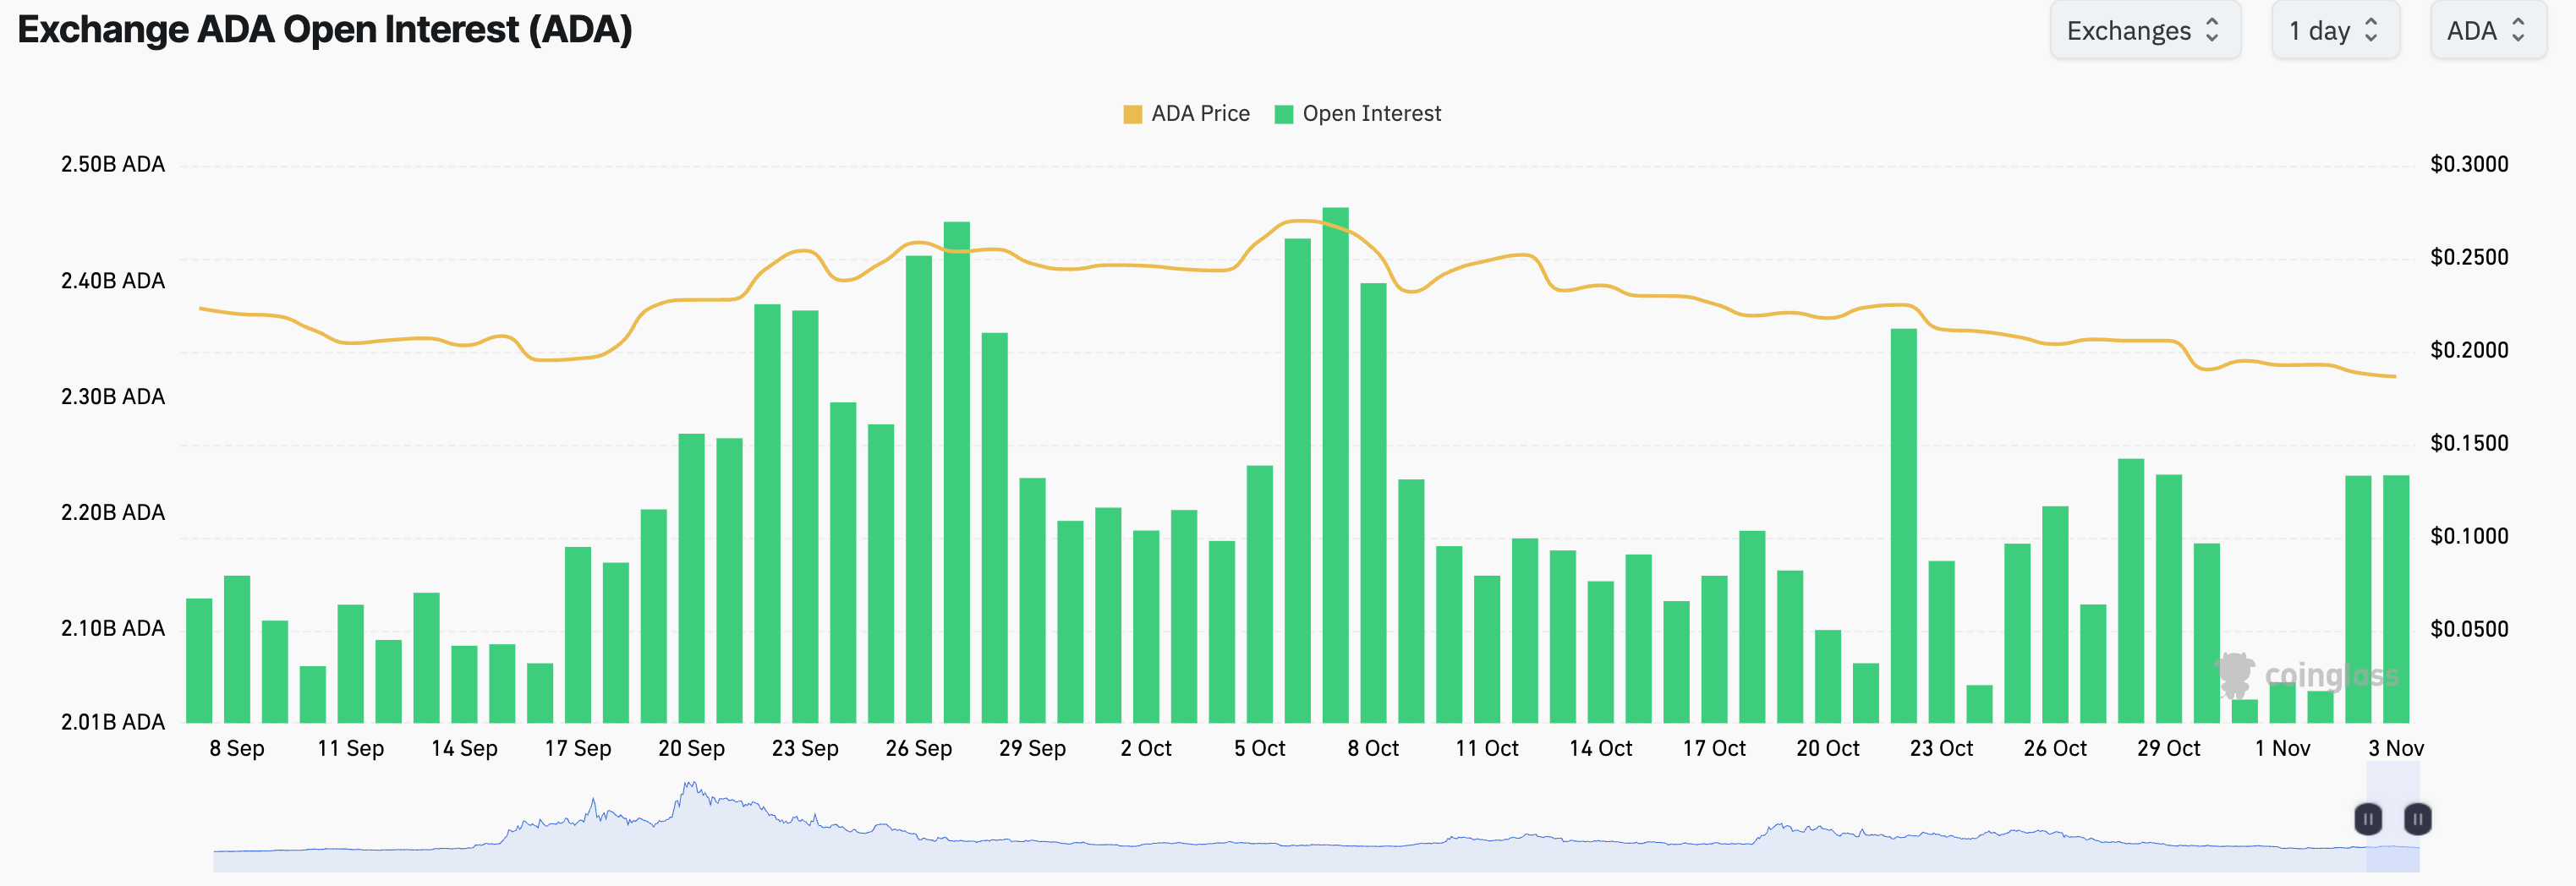
On the other hand, Cardano derivatives show a strong buildup. CoinGlass data shows the ADA futures Open Interest (OI) rises to 2.23 billion ADA from 2.05 billion ADA on Sunday, suggesting fresh positional buildup this week. However, the OI surge aligns with a declining spot price, which typically signals a bearish buildup anticipating further downside.

Ripple risks revisiting the $1 mark
Ripple trades at $1.2517 on Tuesday, showing a near-term consolidation after a 6% decline on Thursday. Still, XRP maintains a broadly corrective tone as the price extends a declining trend capped below an overhead trendline connecting the September 23 and October 28 highs, at $1.2881.
XRP also trades beneath both the 50-day Exponential Moving Average (EMA) at $1.3365 and the 200-day EMA at $1.3657. From a technical perspective, a trendline connecting the August 21 and September 16 lows near $1.2239 acts as the immediate support and forms a descending triangle pattern with the overhead trendline.
A sustained breakout below this $1.2239 could extend the decline toward the 1.0692 horizontal level marked by the June 5 low.
The Relative Strength Index (RSI) at around 37 points to soft but not extreme bearish momentum, while the Moving Average Convergence Divergence (MACD) remains slightly negative, suggesting that downside pressure is still present.
On the flip side, initial resistance appears at the trendline barrier near $1.2881, followed by the 50-day EMA at $1.3365 and then the 200-day EMA at $1.3657, where a denser supply zone could emerge if price attempts a larger rebound.
Cardano's downtrend reaches oversold conditions
Cardano trades at $0.1877 at press time on Tuesday, holding in a bearish near-term bias. ADA price extends its decline below the 50-day and 200-day EMAs at roughly $0.2165 and $0.2352, respectively, and also the former ascending support trendline around $0.2024.
The RSI near 30 maintains a declining slope on the daily chart, hinting at lingering downside pressure despite approaching oversold conditions. At the same time, the MACD line remains negative, suggesting that bearish momentum persists.
From a technical perspective, ADA risks a bearish close below the $0.1894 support level, which could extend its decline toward the $August 18 low at $0.1712.
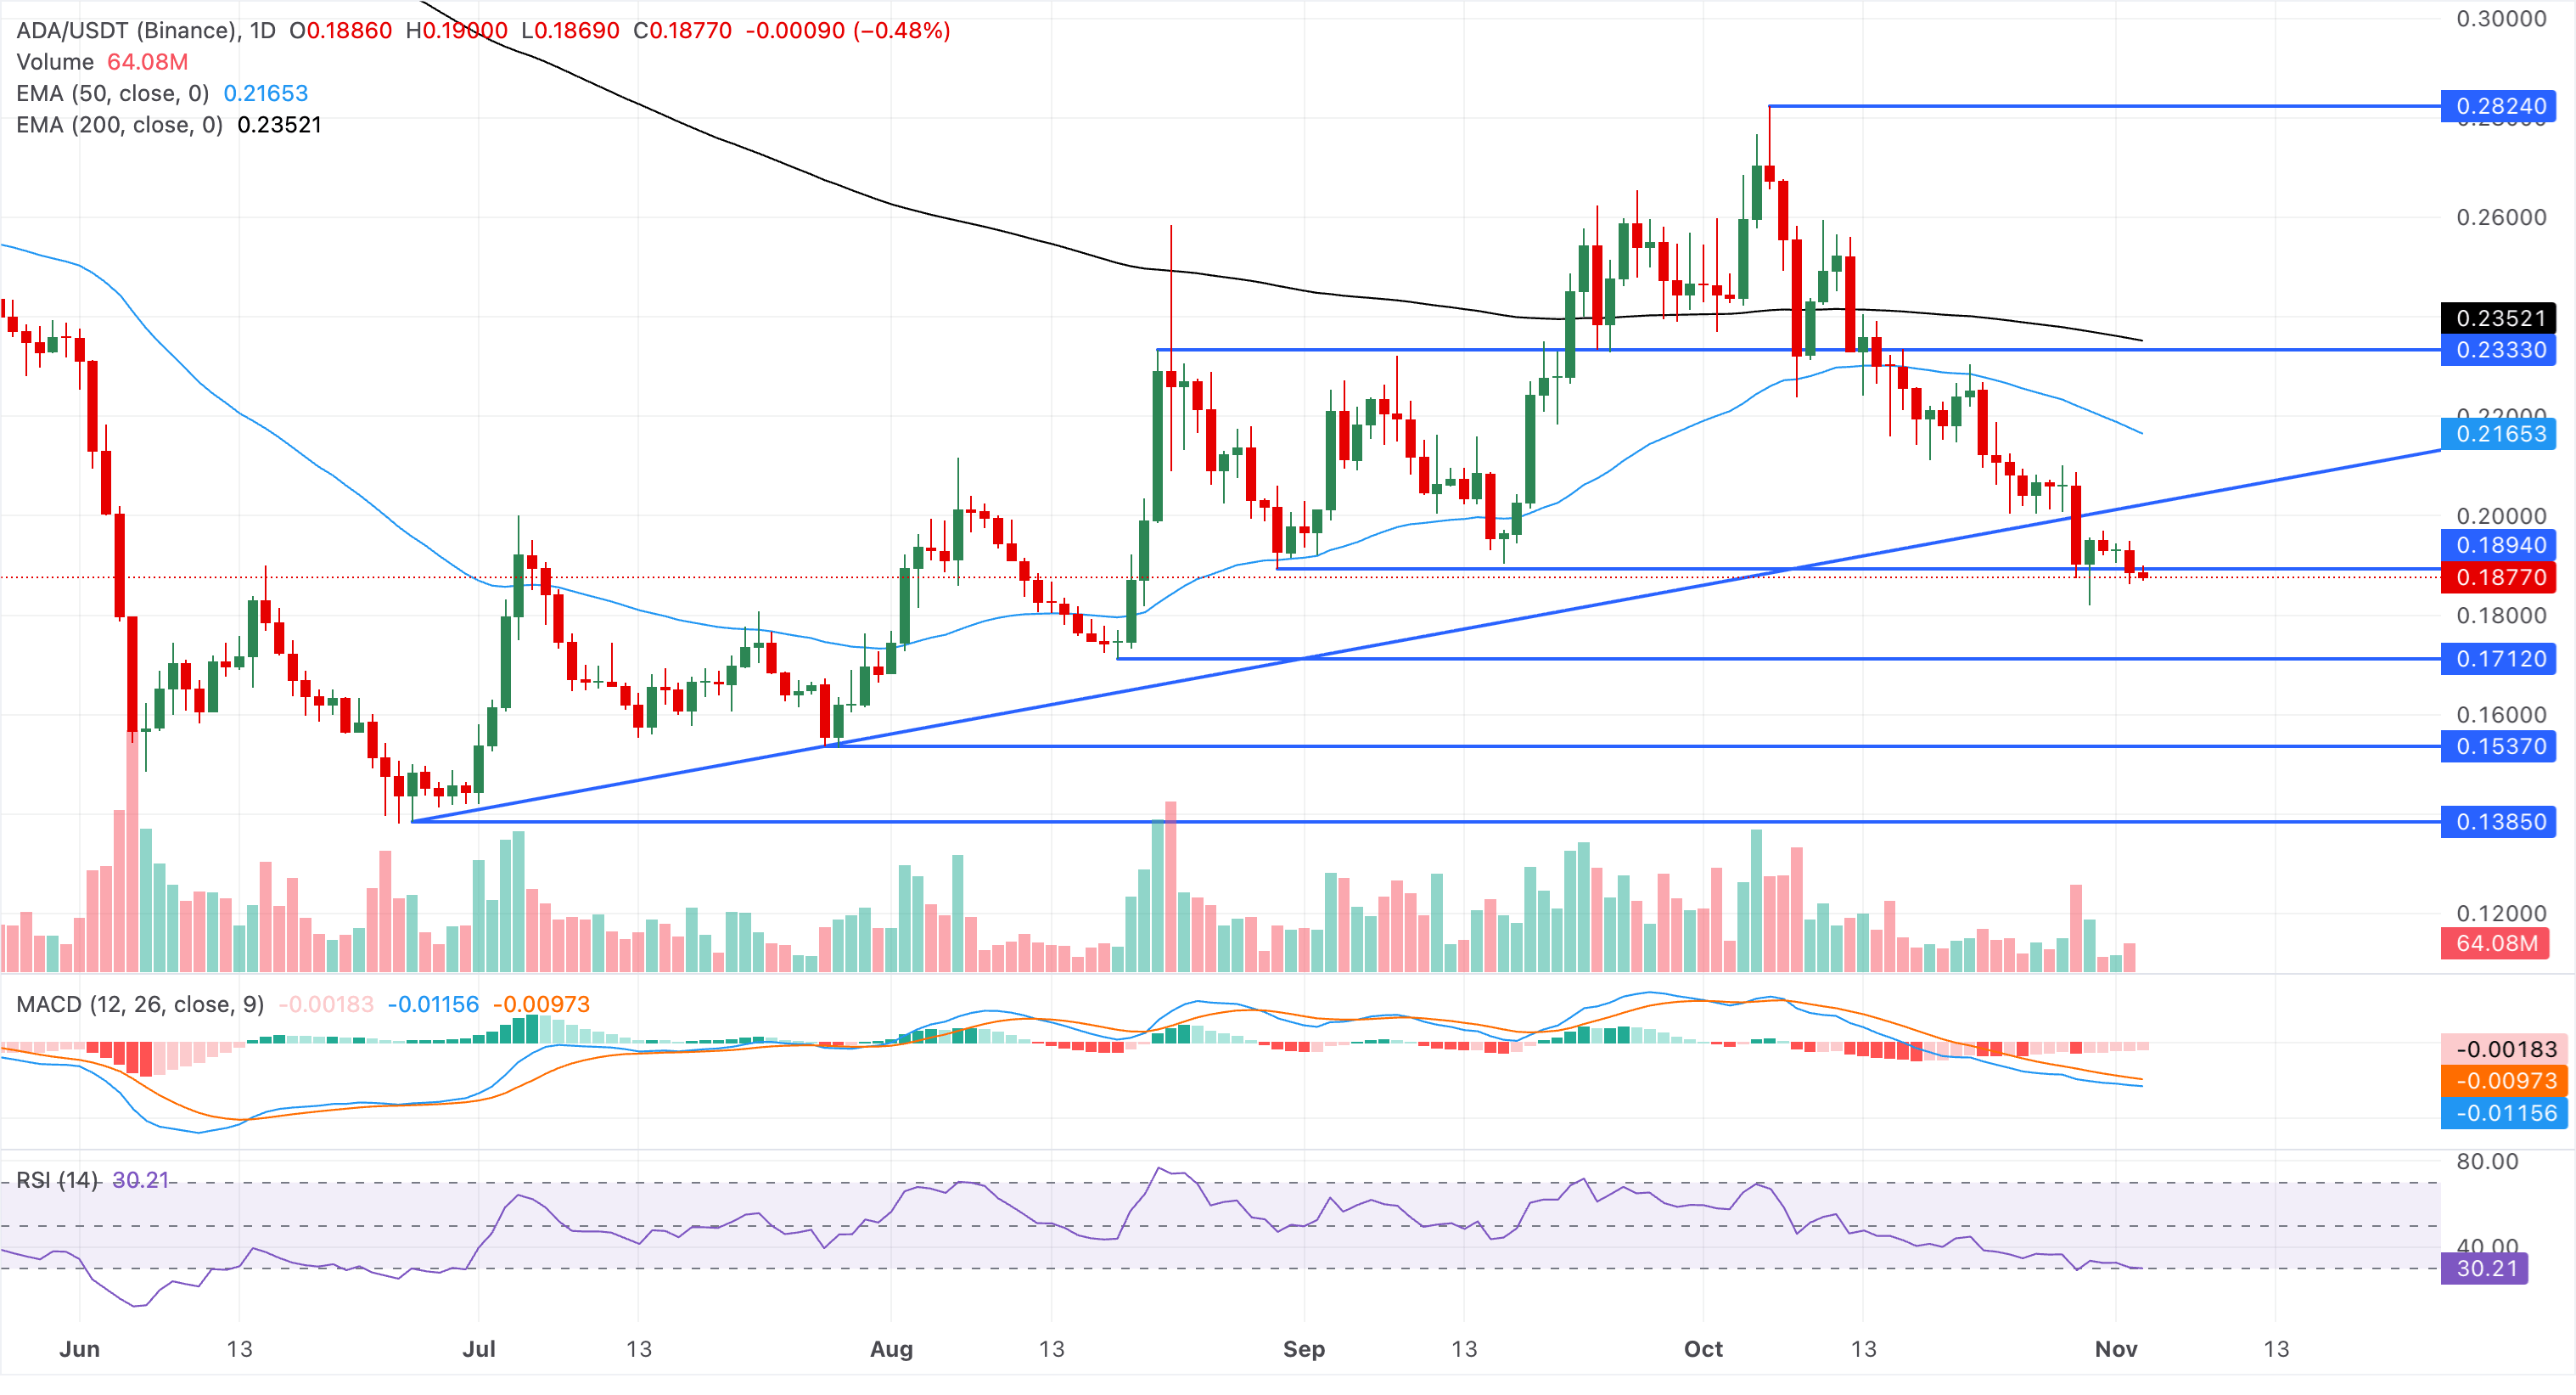
Looking up, a potential rebound in ADA could retest the broken trendline around $0.2024, followed by the 50-day EMA near $0.2165, with the 200-day EMA higher at about $0.2352, reinforcing a broader supply zone.
Solana below $100 gains bearish momentum
Solana edges lower on Tuesday for the fourth consecutive day, maintaining a bearish bias. The pullback in SOL breaks below the 50-day and 200-day EMAs at $103.20 and $99.88, respectively, reaffirming increased near-term selling pressure.
From a technical perspective, Solana is approaching an upward-sloping trendline, with a nearby cushion around $89.27. Below this, more established horizontal floors at $87.21 and $70.58 could cushion the declining trend.
The RSI sits in oversold territory near 25, while the MACD remains below the signal and zero lines, with a negative histogram expanding, together suggesting persistent downside pressure as sellers retain control.
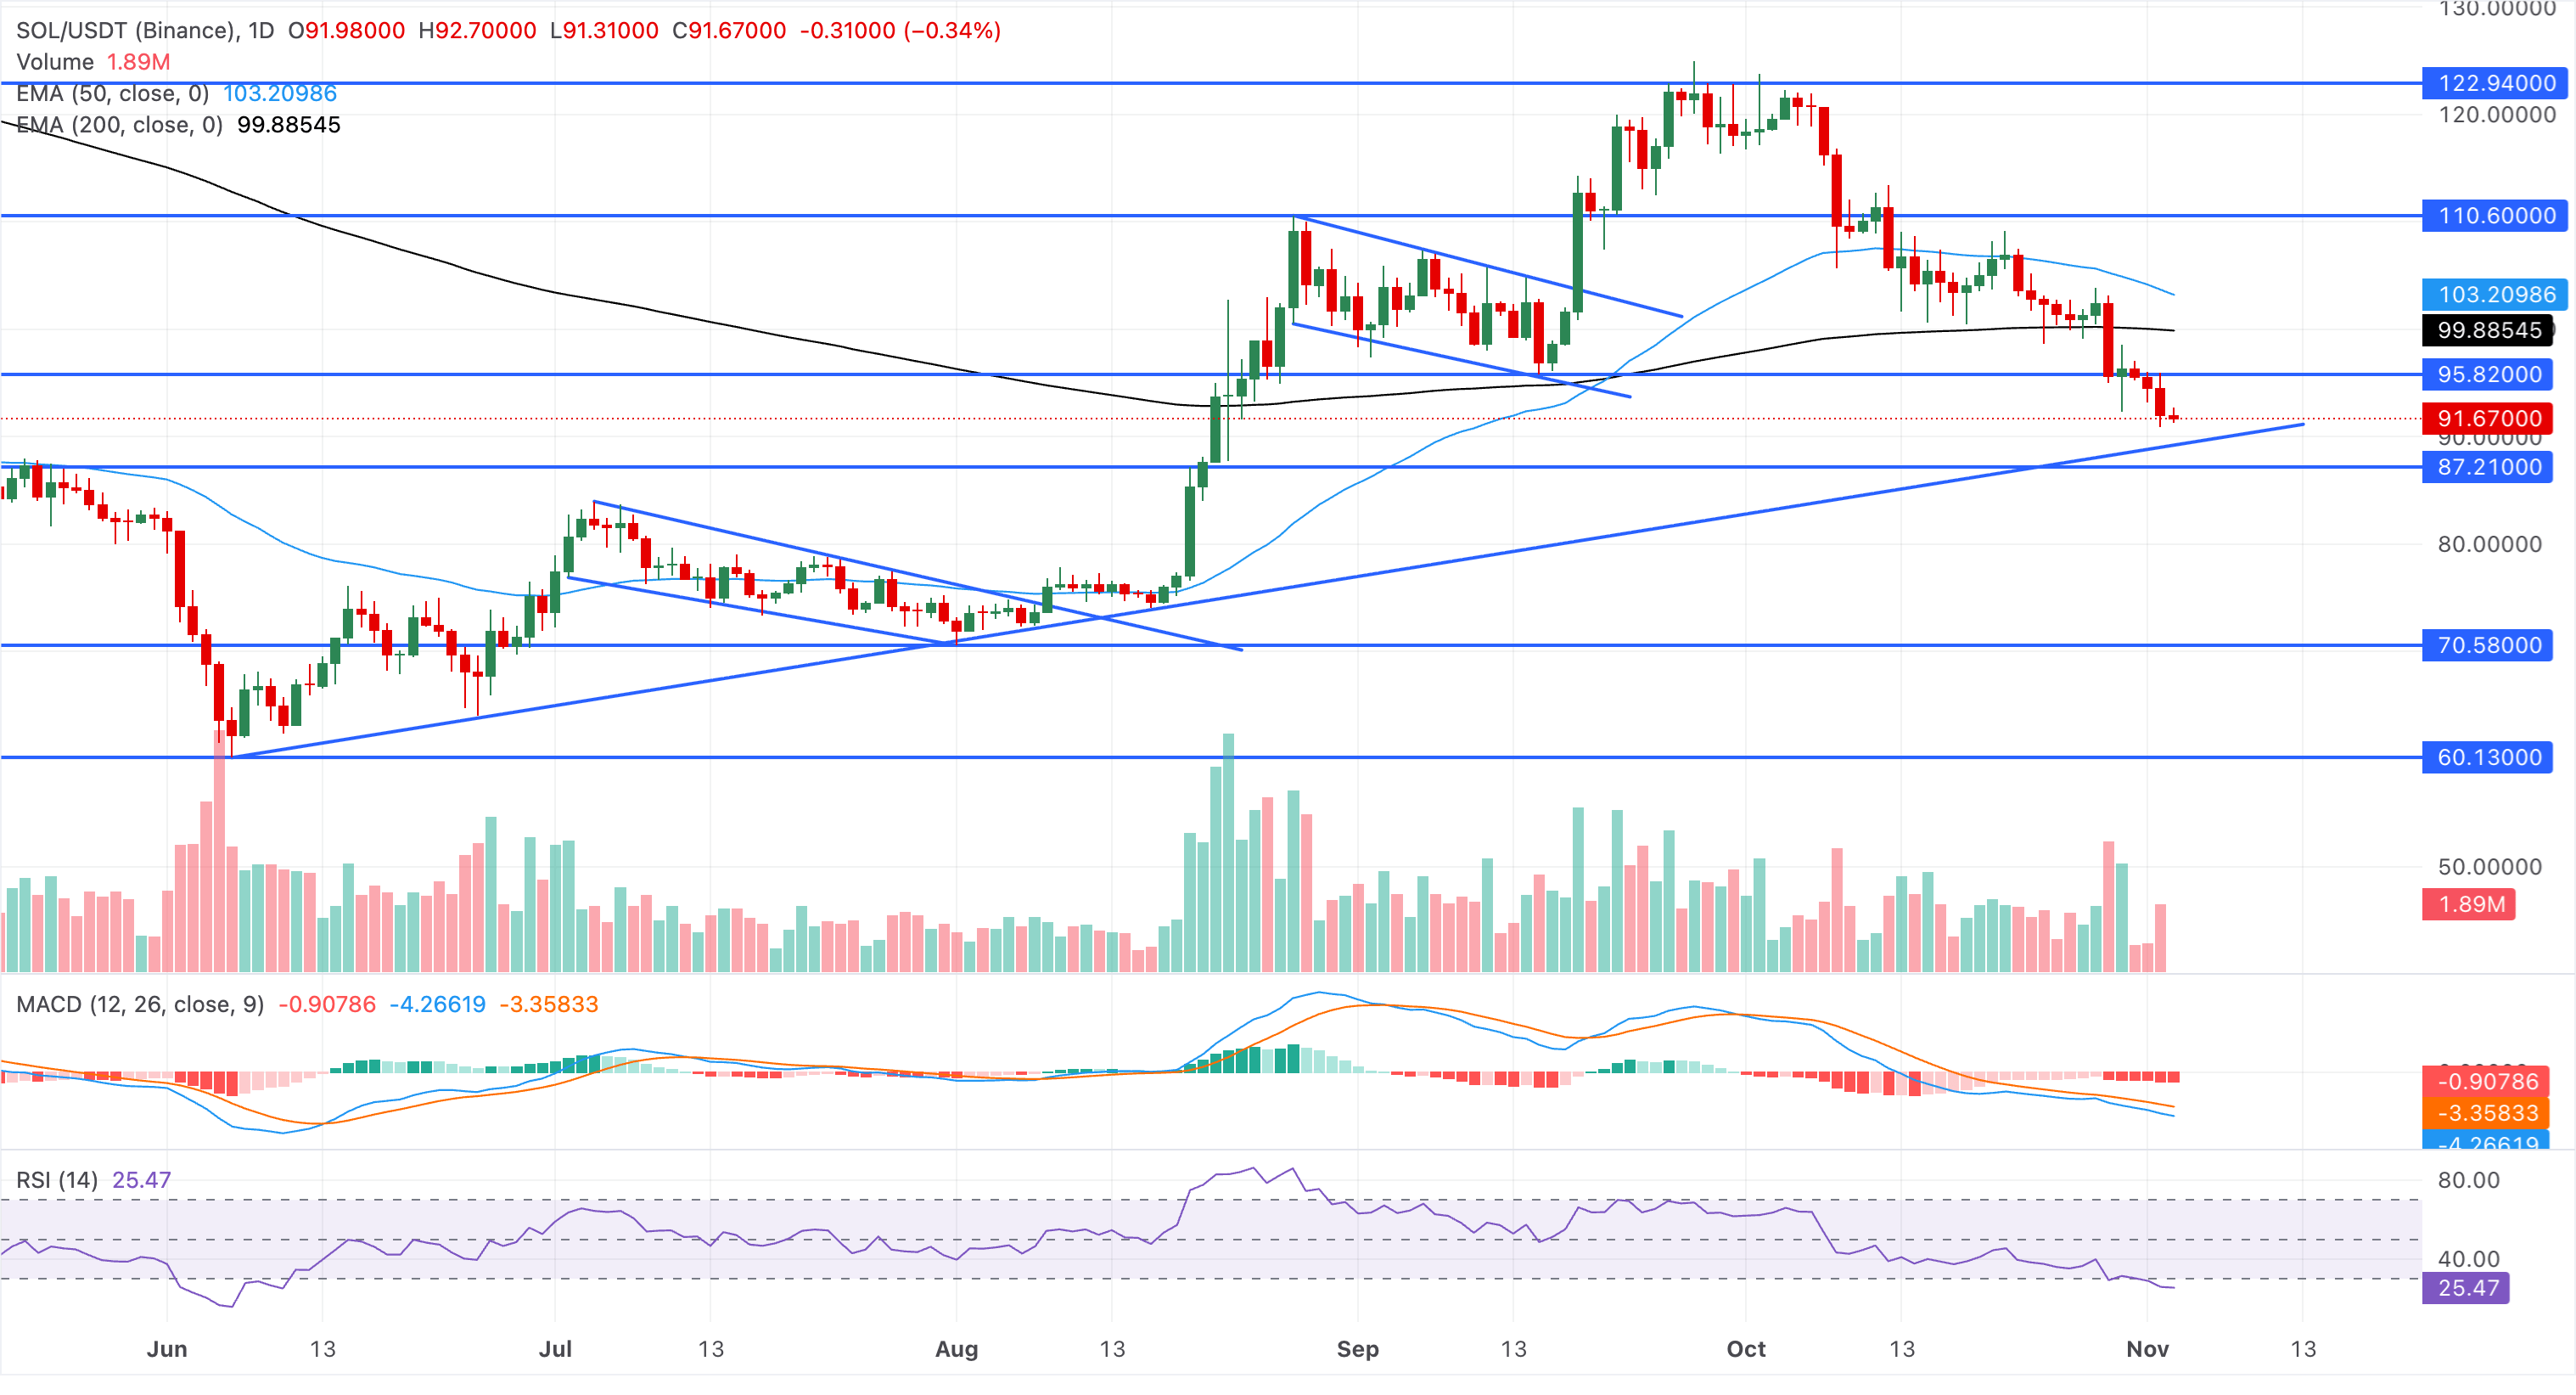
On the topside, initial resistance is seen at $95.82, ahead of the 200-day EMA at $99.88 and the 50-day EMA at $103.20.
(The technical analysis of this story was written with the help of an AI tool. Know more.)
추천 기사


