


Crypto Today: Bitcoin, Ethereum, XRP sell-off cools after Binance security breach
- Bitcoin’s decline slows as $78,000 provides immediate support after Binance's $6.3 billion hack.
- Ethereum trades under pressure near $2,200, weighed down by downtrending momentum indicators.
- XRP bulls reengage after testing $1.20 support, but structural hurdles could limit recovery.
Cryptocurrency prices are on edge on Friday, with Bitcoin (BTC) delicately holding onto a short-term $78,000 support, Ethereum (ETH) edging lower near $2,200 and Ripple (XRP) attempting a recovery above support established at $1.20. The cooldown follows Binance, the largest crypto exchange, after it reported a hack that impacted about $6.3 billion.
The broader cryptocurrency market appeared to crumble amid reactionary pressure, with liquidations in the derivatives market reaching $1.5 billion in 24 hours.
Binance to recover losses from SAFU as asset freezing continues
Binance's security breach is reported to have impacted roughly $6.3 billion, prompting the exchange to temporarily suspend deposits and withdrawals to allow time for an internal investigation and review.
Binance says the incident may have involved a compromised DevOps engineer’s laptop, which may have let the attacker access a container service where unauthorized withdrawal transactions were submitted.
“We have found no evidence of any wallet private key leak, Binance said on X, adding, “We will share a detailed technical post-mortem once the investigation is complete and the facts are fully verified.”
Updates from the exchange show that Binance has been working with blockchain partners, including Tether, Circle and Ripple, to freeze approximately $3 billion on-chain.
Binance has emphasized that user assets are safe and that all losses will be covered under its Secure Asset Fund for Users (SAFU) program, along with the company’s assets.
In addition to suspending withdrawals and deposits, Binance revoked the affected address authorization and worked with law enforcement and blockchain partners to trace and recover the funds.
“This was a complex attack, and we are doing all we can in coordination with law enforcement to resolve it. We are still gathering the facts, and will share more directly as we have them,” Binance said in an update on X.
Crypto-related scams and fraud remain a key pain point as the industry matures, with the ‘The Chainalysis 2026 Crypto Crime Report’ indicating a 162% annual increase. Cryptocurrency scams stole $14 billion on-chain, while AI-enabled schemes surged 1,400% annually.
Technical analysis: Bitcoin holds lower support
Bitcoin trades at $78,012, maintaining a bearish near-term bias as it holds below the 50-day Exponential Moving Average (EMA) at $80,608. Price remains, however, above a dense support layer formed by the 100-day EMA at $77,825 and the longer-term 200-day EMA at $76,455. suggesting the broader uptrend is still intact but under pressure.
The SuperTrend indicator at $84,056 sits well above spot as a reclaimed level, reinforcing that upside attempts face notable overhead supply, while the Relative Strength Index (RSI) near 36 hints at lingering downside pressure, consistent with the negative Moving Average Convergence Divergence (MACD) reading.
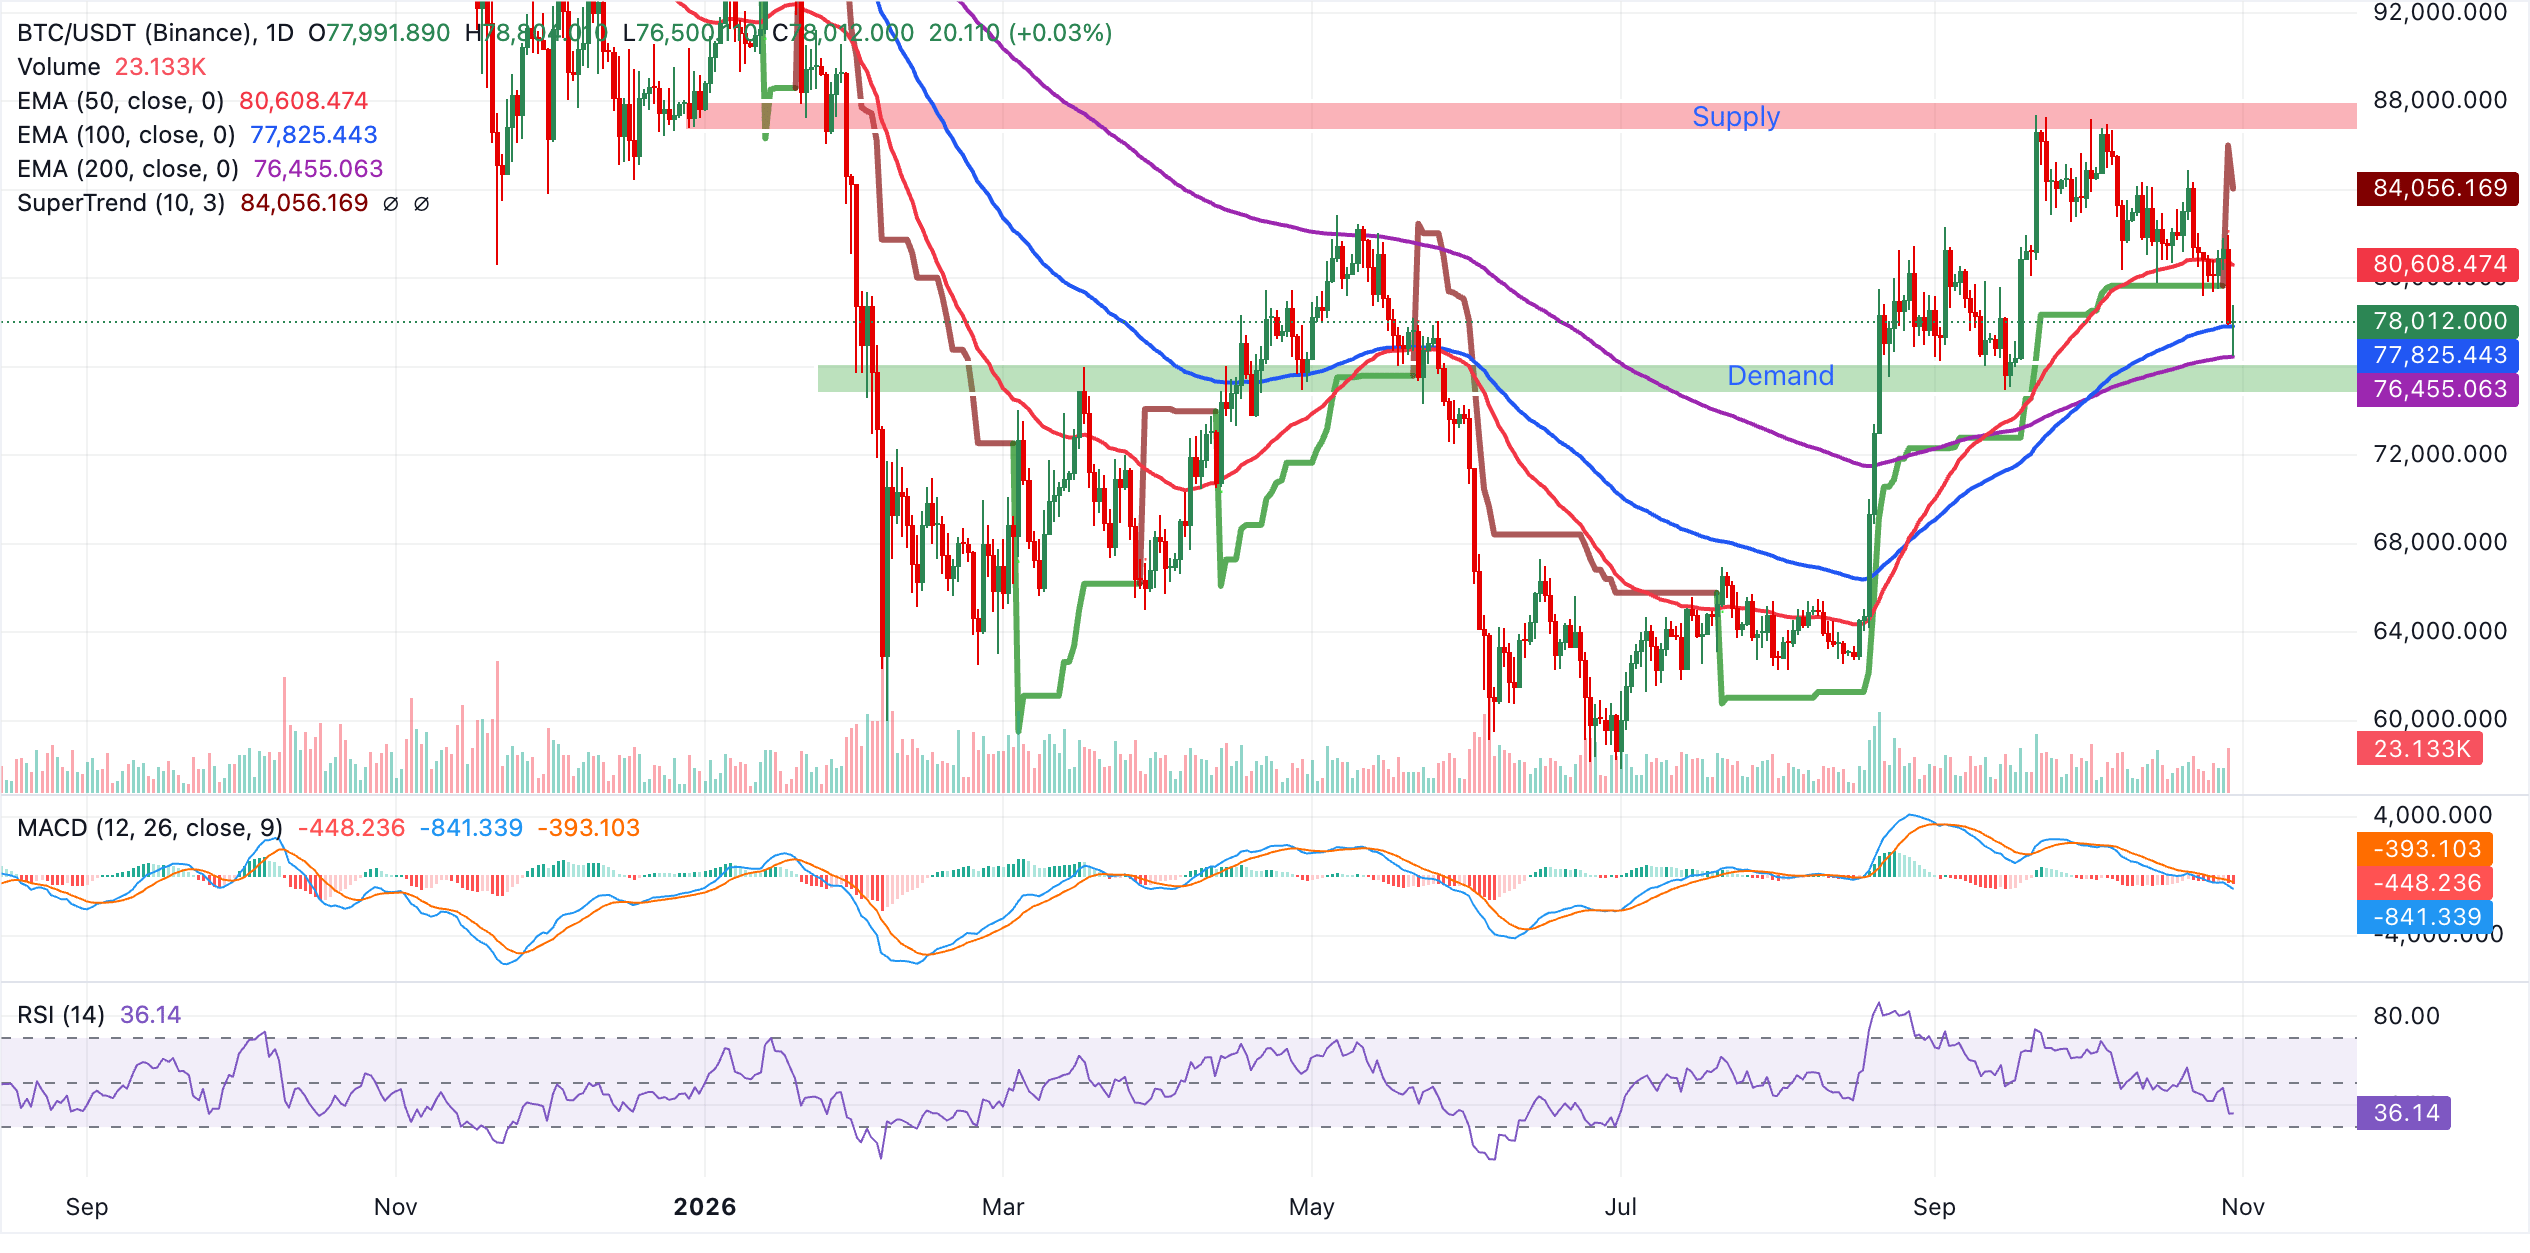
Initial resistance lies at the 50-day EMA at 80,608, and a daily close above this barrier would be needed to ease the current bearish tone and open the way toward the SuperTrend line at $84,056. On the downside, immediate support appears at the 100-day EMA at $77,825, followed by stronger structural demand at the 200-day EMA around $76,455. A break below this latter level would significantly worsen the broader technical picture and expose deeper retracements.
Technical analysis: Ethereum falters as sell-side pressure intensfies
Ethereum trades at $2,231, extending a bearish phase after losing the upward-sloping trendline and holding below a dense pack of moving averages. Price sits below the 200-day EMA at $2,316, the 100-day EMA at $2,358, and the 50-day EMA at $2,435, which collectively suggest the broader trend remains under pressure despite the recent pullback from higher levels.
Momentum indicators reinforce this negative tone, with the RSI slipping into oversold territory near 29 and the MACD below zero and its signal line, with a broadly negative histogram hinting at persistent downside bias.
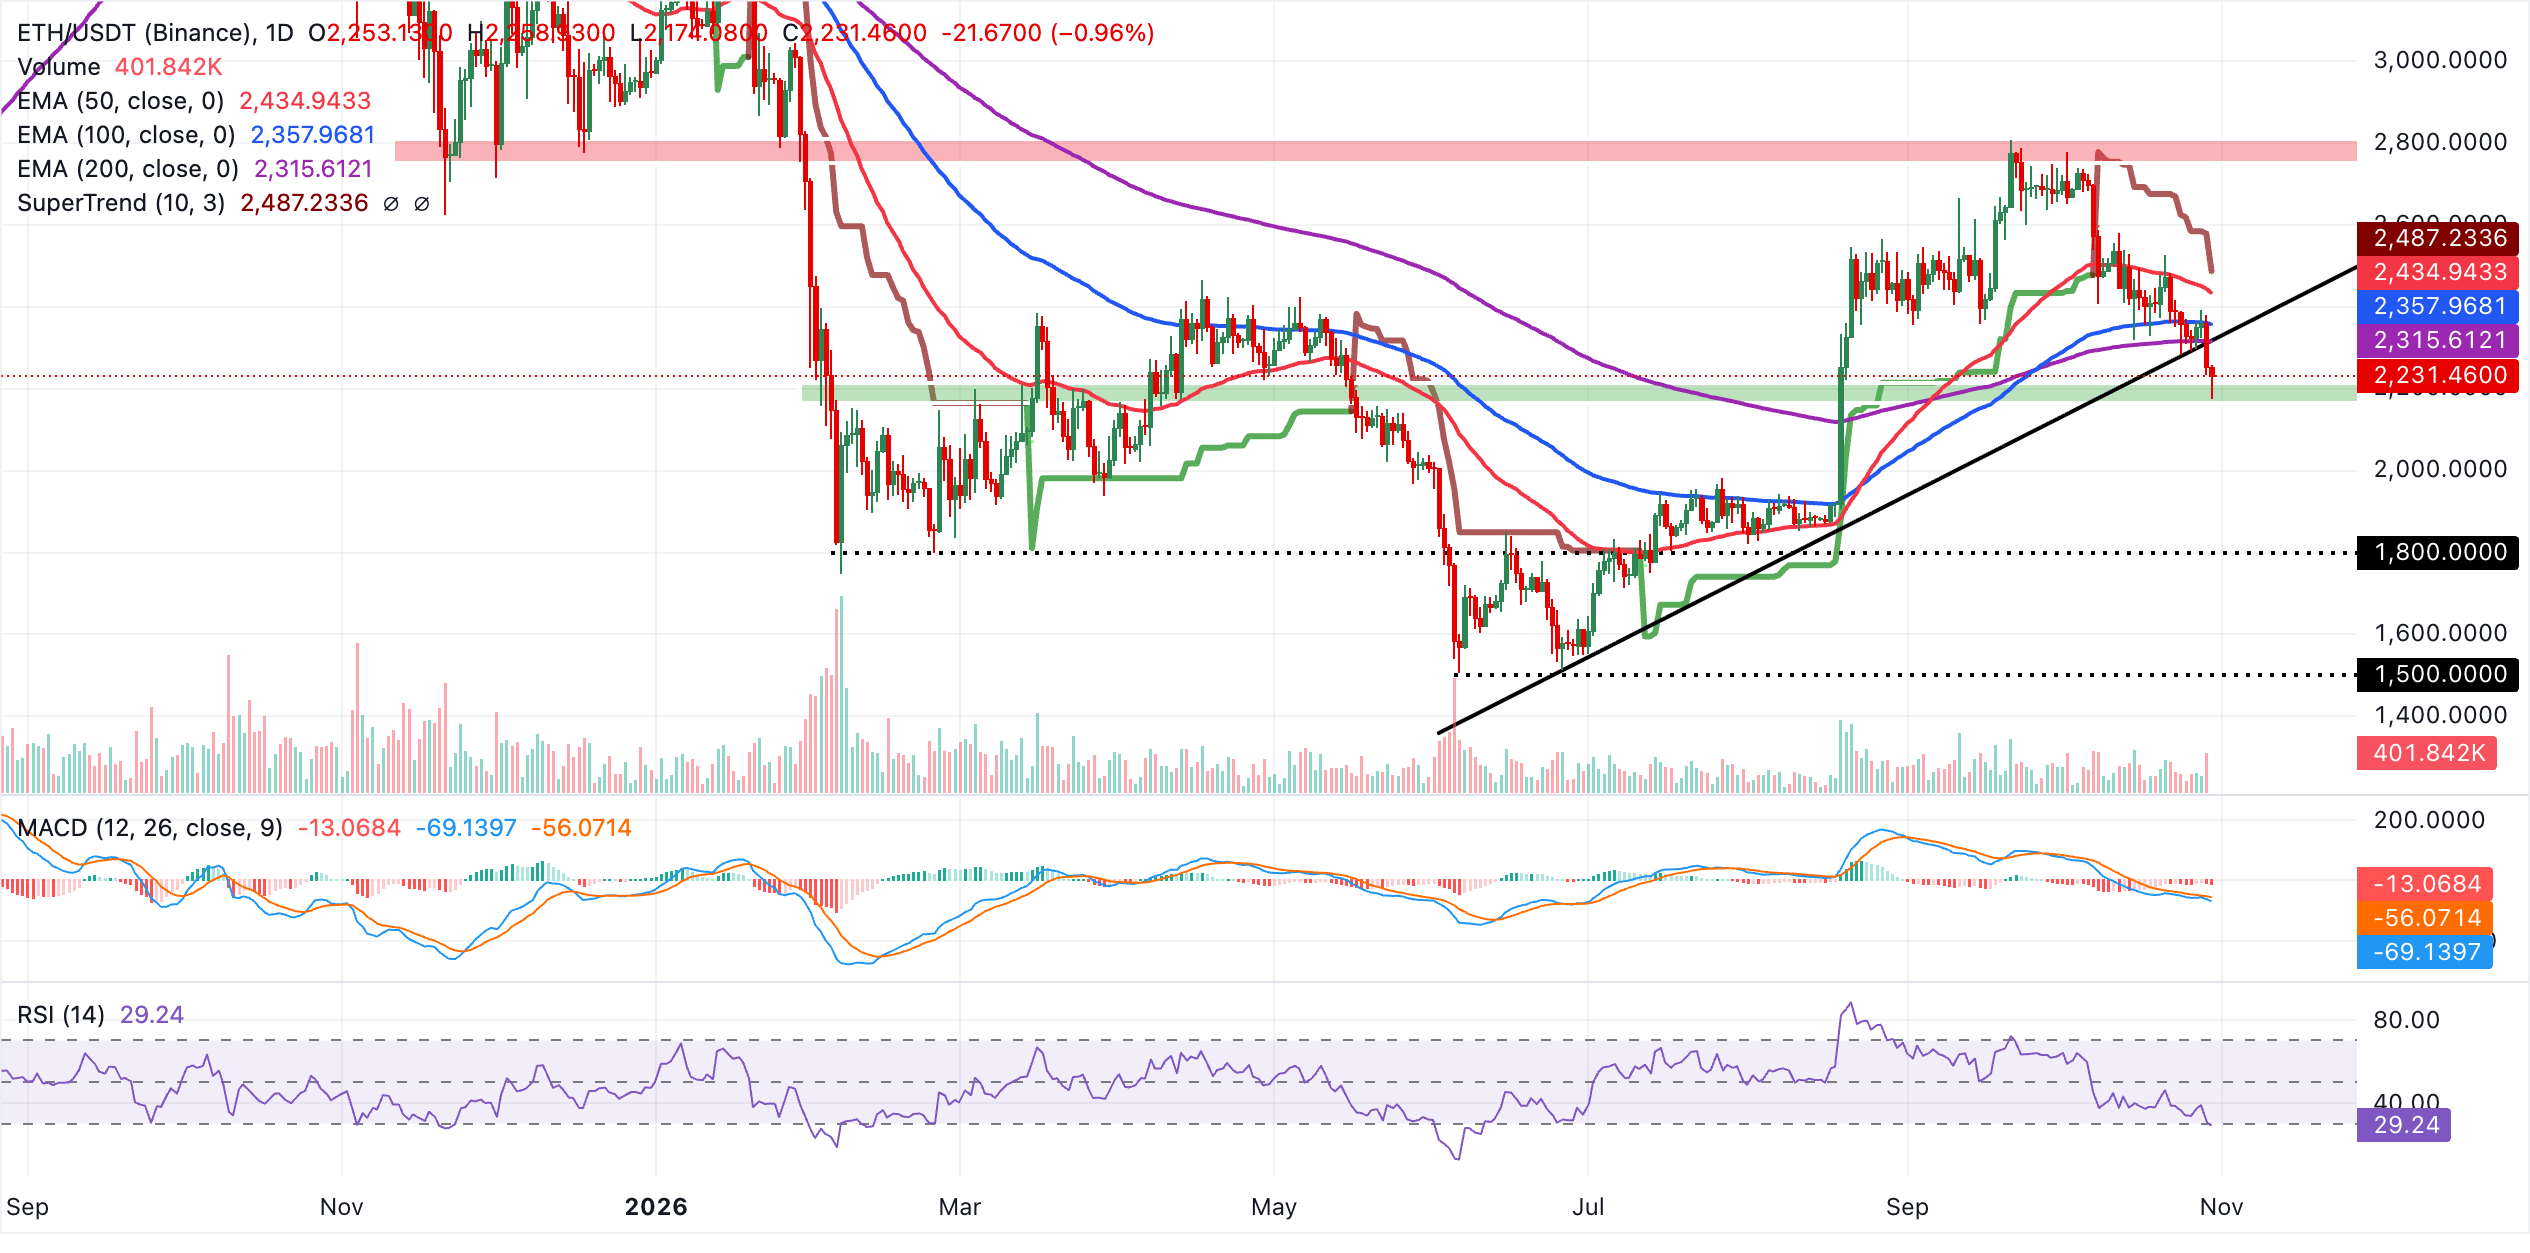
Initial resistance lies at the 200-day EMA around $2,316, closely followed by the former trendline break level near $2,320, where sellers could reassert control on any corrective bounce. Above there, the 100-day EMA at $2,358 and the 50-day EMA at $2,435 stack up as successive barriers before a more significant supply zone emerges at the SuperTrend line around $2,487. With no nearby structural supports identified below the current price on the daily chart, the pair would likely need to reclaim at least the 200-day EMA cluster to alleviate immediate bearish pressure and open the way for a more durable recovery.
Technical analysis: XRP bulls step in at $1.20
XRP trades at $1.25 amid a subtle recovery from near-term support at $1.25. Despite this demand area, the pair extends a bearish near‑term tone as price holds well below the main EMAs and the SuperTrend line. The 100‑day EMA at $1.33, the 50‑day EMA at $1.35 and the 200‑day EMA at $1.37 all sit overhead, suggesting the pair remains capped by a layered technical barrier, while the SuperTrend at $1.41 reinforces the broader downside structure.
Momentum is soft, with the MACD below zero and turning lower again, and the RSI hovering around 37, hinting at persistent selling pressure without yet reaching oversold extremes.
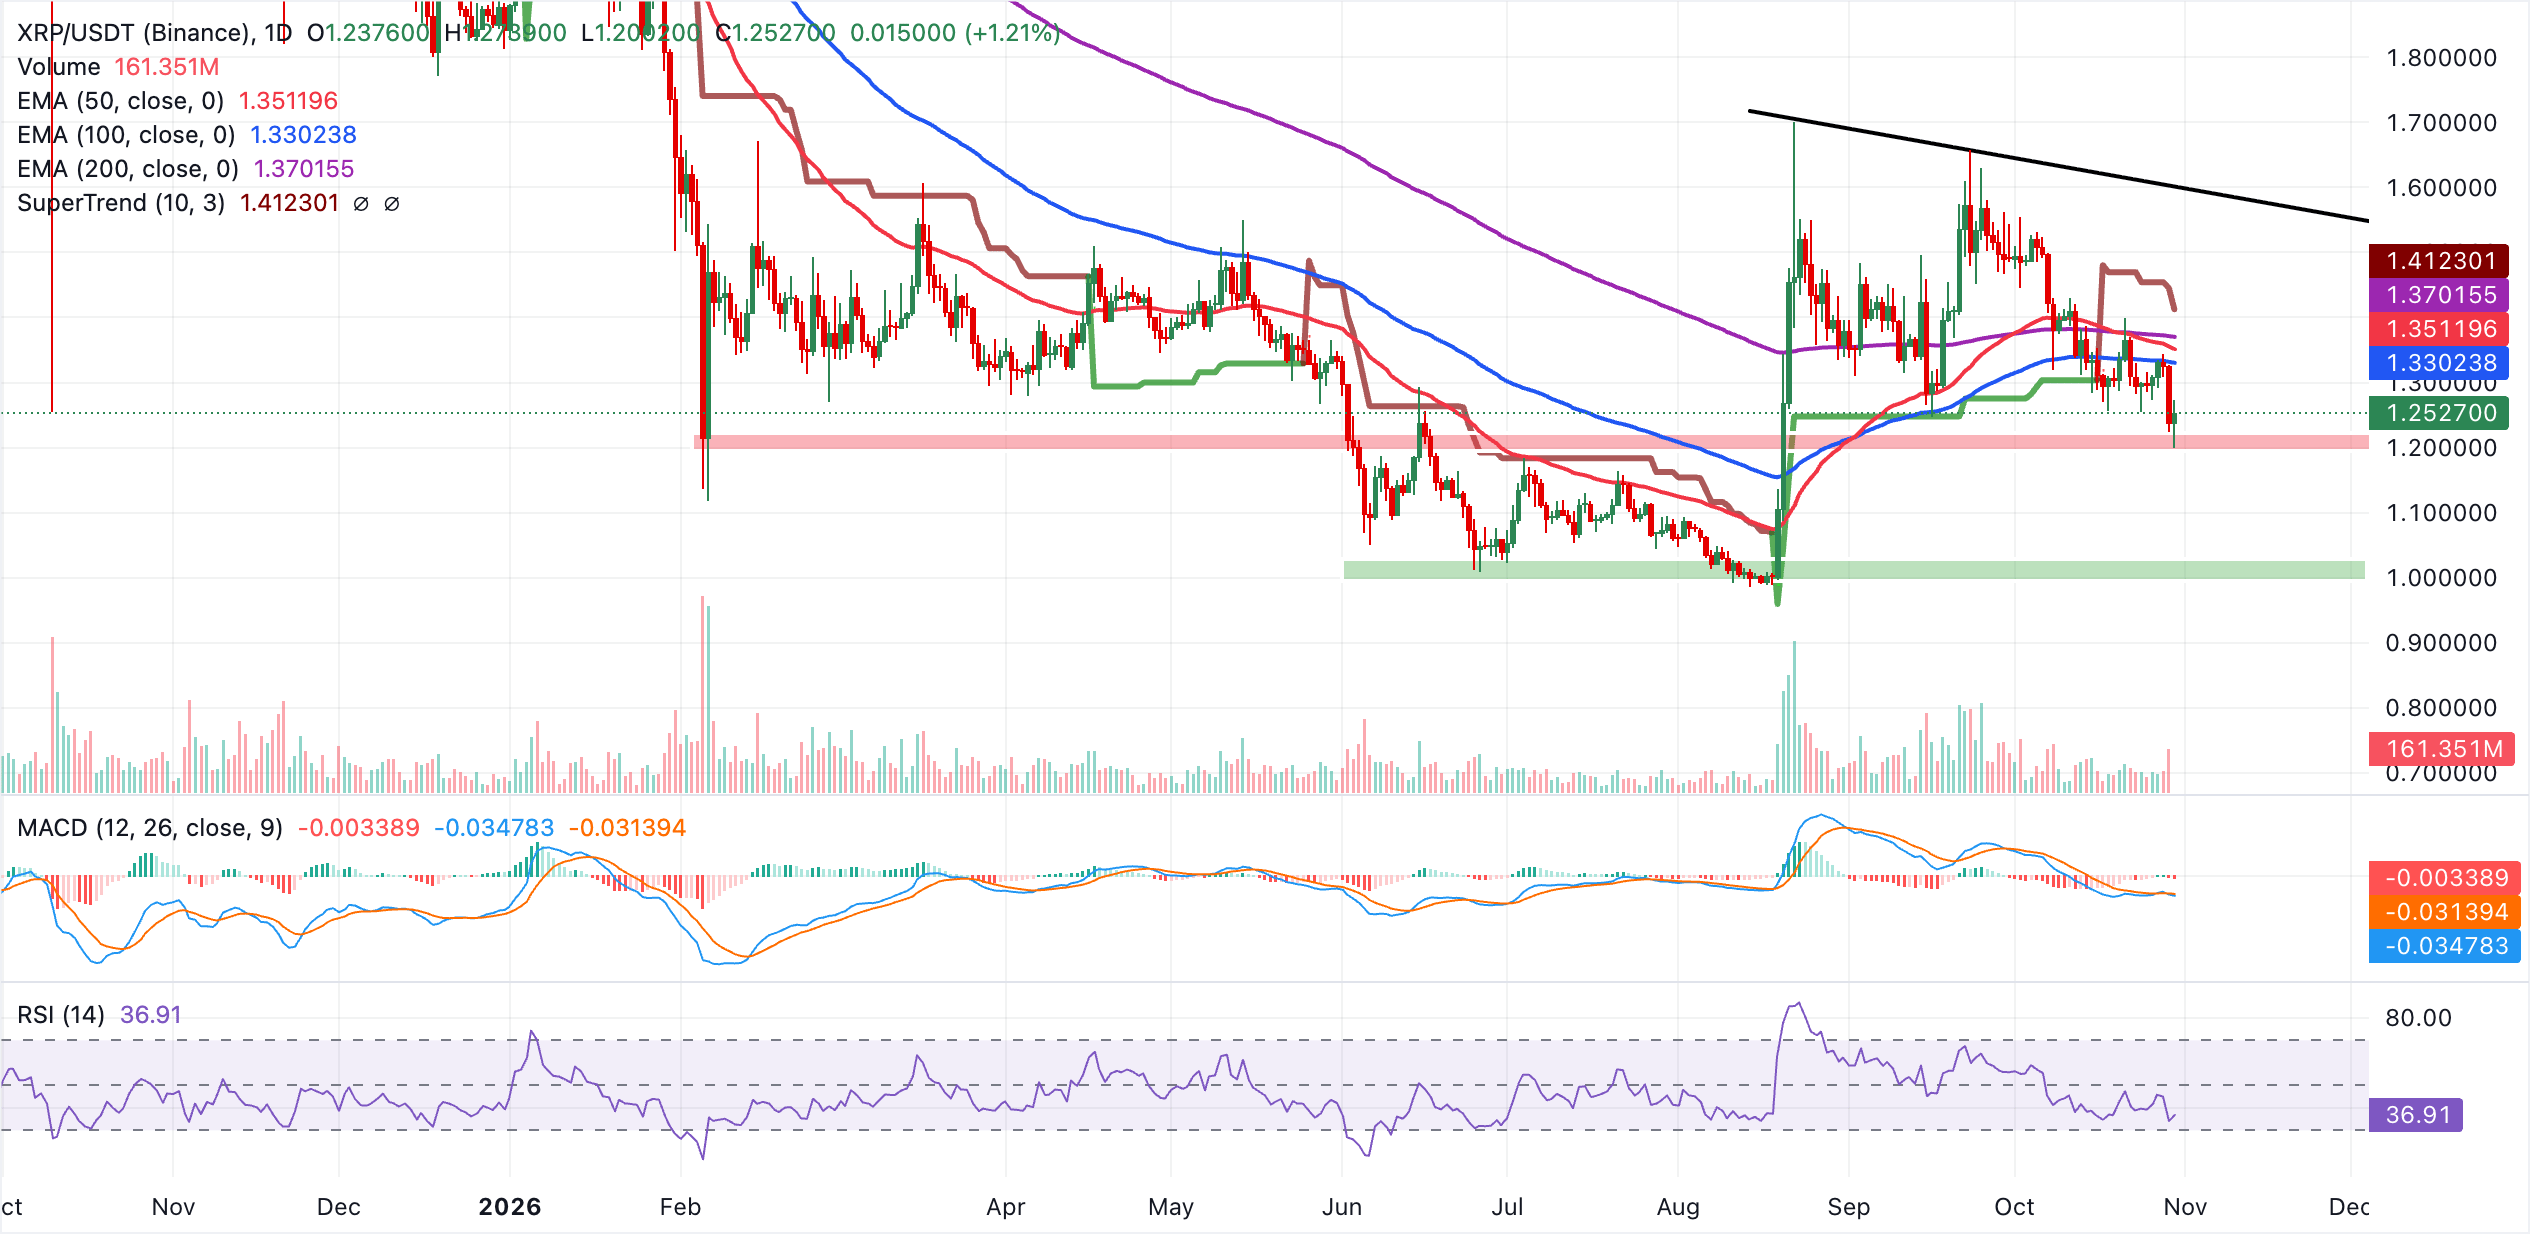
Initial resistance emerges at the 100‑day EMA near $1.33, followed by the 50‑day EMA around $1.35 and the 200‑day EMA at $1.37, where any recovery would likely stall unless buyers can force a sustained break. Above these, the SuperTrend barrier at $1.41 and the broader downward resistance trendline define a stronger ceiling that would need to be reclaimed to ease the bearish bias and open the way for a more meaningful rebound.
(The technical analysis of this story was written with the help of an AI tool. Know more.)
Bitcoin, altcoins, stablecoins FAQs
Bitcoin is the largest cryptocurrency by market capitalization, a virtual currency designed to serve as money. This form of payment cannot be controlled by any one person, group, or entity, which eliminates the need for third-party participation during financial transactions.
Altcoins are any cryptocurrency apart from Bitcoin, but some also regard Ethereum as a non-altcoin because it is from these two cryptocurrencies that forking happens. If this is true, then Litecoin is the first altcoin, forked from the Bitcoin protocol and, therefore, an “improved” version of it.
Stablecoins are cryptocurrencies designed to have a stable price, with their value backed by a reserve of the asset it represents. To achieve this, the value of any one stablecoin is pegged to a commodity or financial instrument, such as the US Dollar (USD), with its supply regulated by an algorithm or demand. The main goal of stablecoins is to provide an on/off-ramp for investors willing to trade and invest in cryptocurrencies. Stablecoins also allow investors to store value since cryptocurrencies, in general, are subject to volatility.
Bitcoin dominance is the ratio of Bitcoin's market capitalization to the total market capitalization of all cryptocurrencies combined. It provides a clear picture of Bitcoin’s interest among investors. A high BTC dominance typically happens before and during a bull run, in which investors resort to investing in relatively stable and high market capitalization cryptocurrency like Bitcoin. A drop in BTC dominance usually means that investors are moving their capital and/or profits to altcoins in a quest for higher returns, which usually triggers an explosion of altcoin rallies.
추천 기사


