


Ethereum Price Forecast: Derivatives interest remains calm amid mixed sentiment
Ethereum price today: $1,880
- Ethereum Net Taker Volume shows a mild dominance in short positioning over the past two weeks.
- Open interest declined earlier in the week despite positive funding rates.
- ETH's technical setup suggests a consolidating market, with price trapped in a tight band between EMAs’ support and resistance.
Ethereum (ETH) derivatives interest has been ranging sideways over the past week after a mild flip in seller dominance.
Derivatives sentiment stays weak as capital remains on sidelines
The Net Taker Volume, which measures the difference between buying and selling volume of market orders in ETH perpetual contracts, moved slightly into negative territory since the beginning of August. But the difference across the past two weeks has been modest, indicating a closely fought battle for dominance between buyers and sellers.
Historically, a sustained flip toward the negative side in this metric has often caused a decline in prices, as evident in January and May.
-1786727487015.png)
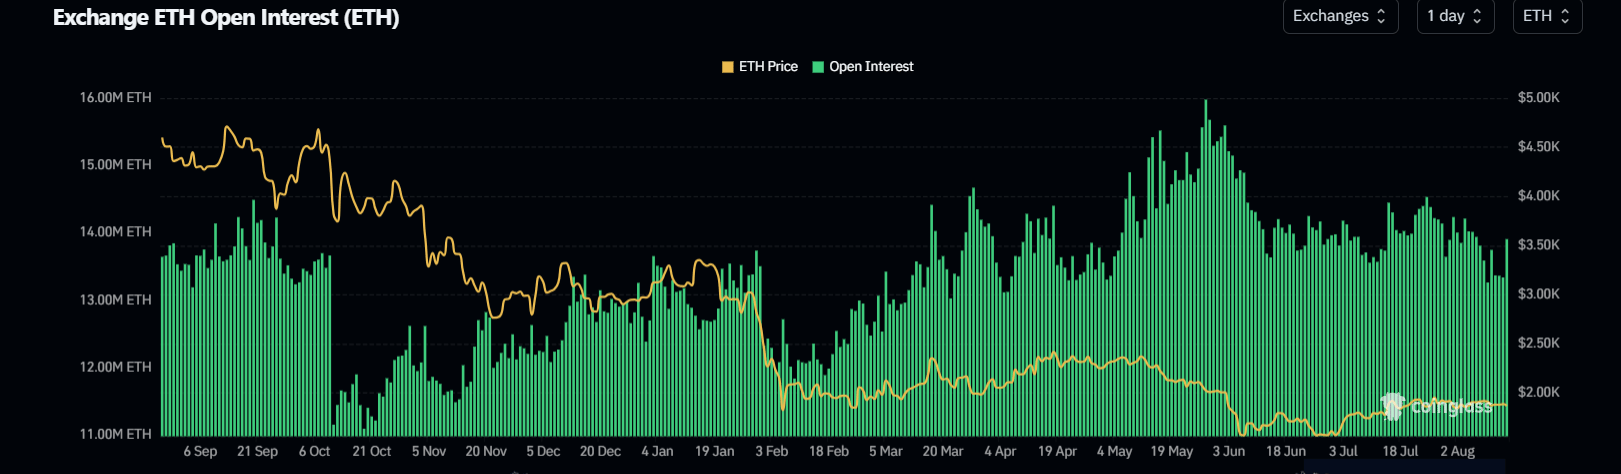
Following the flip in the Net Taker Volume, Ethereum's open interest (OI) posted weak movements all through the week, easing toward 13.3M ETH on Thursday, its lowest level since early May, before jumping to 13.9M ETH on Friday. Open interest is the total worth of outstanding contracts in a derivatives market.
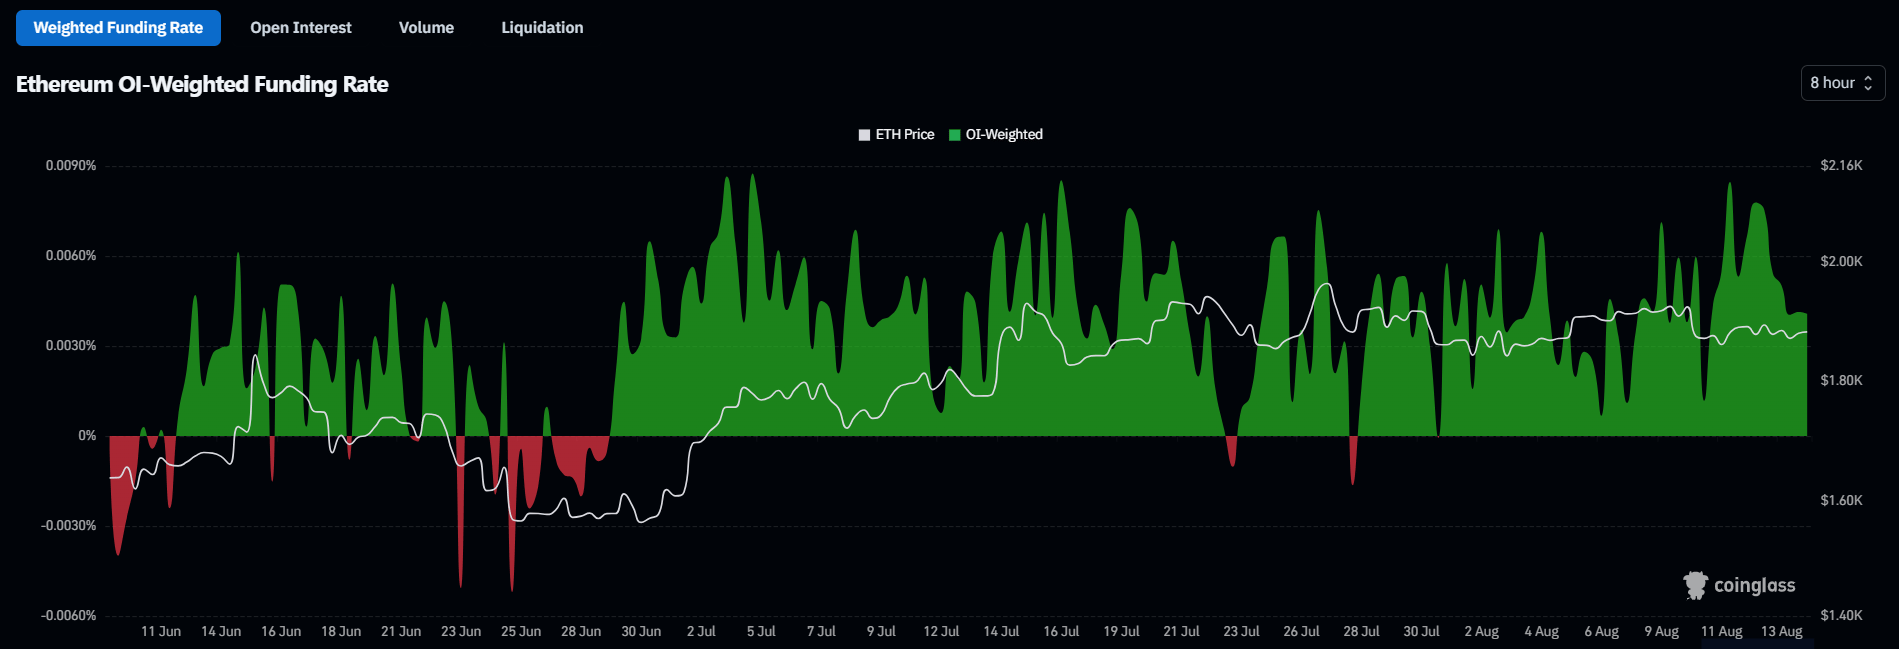
Despite weak open interest moves, funding rates have remained positive, hovering near 0.0044% on Friday. Funding rates are periodic payments between perpetual futures traders that keep a contract anchored to its spot price. Positive readings imply longs pay shorts to maintain dominance, and negative readings imply the opposite.
The decline in OI earlier in the week, combined with a positive funding environment, shows reduced participation in ETH derivatives despite a tilt toward long-side expectations.
The combined interpretation of the three data sets indicates that while immediate volume of ETH perpetual futures shows a mild dominance in short positioning, overall activity as captured in ETH open interest and funding rates indicates low market interest with a slight long bias.
Earlier reports show a similar trend in ETH spot on-chain data, where exchange reserves have been largely flat, coupled with modest retail distributions.
Meanwhile, US spot ETH exchange-traded funds (ETFs) saw $6.72 million in net inflows on Thursday, marking a second consecutive day of mild flows after taking in $7.38 million on Wednesday, per SoSoValue data.
Ethereum technical outlook: ETH caught in tight EMA band
Ethereum has recorded $26.9 million in liquidations over the past 24 hours, led by $21.1 million in long liquidations, per Coinglass data.
On the daily chart, ETH shows a neutral near‑term tone as it tests the 20- and 50‑day Exponential Moving Averages (EMAs) at $1,884 and $1,865, with the 100-day EMA cap continuing to limit the upside. This configuration suggests a consolidative market, with price caught in a tight band between nearby EMA support and resistance.
The 14-day Relative Strength Index (RSI) at 51 and the Stochastic around 50 reinforce a balanced, range‑bound momentum profile rather than a decisive bullish or bearish push.
On the topside, immediate resistance emerges at the 100‑day EMA around $1,920. A sustained break above these levels would expose the next horizontal barrier at $1,961, followed by higher resistance zones at $2,172 and $2,431.
On the downside, initial support is provided by the 50‑day EMA at $1,865, with a deeper slide targeting the horizontal floor at $1,809, while more substantial demand could emerge at $1,701 and $1,507 if sellers regain control.
(The technical analysis of this story was written with the help of an AI tool. Know more.)
추천 기사


