


USD/JPY Price Forecast: 200-day SMA caps rebound after intervention-led selloff
- USD/JPY edges higher as the Japanese Yen gives back part of its intervention-led gains.
- The pair has slipped below all major moving averages, turning the near-term bias bearish.
- RSI signals oversold conditions, while the 200-day SMA at 158 offers immediate resistance.
USD/JPY trades modestly higher on Tuesday despite a softer US Dollar (USD), as the impact of recent intervention fades and the Japanese Yen (JPY) comes under pressure again. At the time of writing, the pair trades around 157.60, recovering after briefly falling toward 155 on Monday, its lowest level since May 6.
Analysts at Societe Generale argue that a lasting recovery in the Yen will hinge on the domestic growth story rather than policy theatrics, maintaining that “what will trigger a durable yen rally will be a rise in consensus forecasts of Japanese growth, rather than more, bigger intervention, coordinated or otherwise.”
They add that “more, or faster BoJ rate hikes won’t solve the problem either, unless the Japanese growth outlook makes them appear realistic,” cautioning that “if Japanese growth remains weak, higher JGB yields will increasingly be unhelpful for the yen.”
In contrast, strategists at BBH focus on the near-term impact of recent official action, noting that “the coordinated US-Japan intervention – and officials’ warning that they stand ready to act again – significantly raises the cost of fighting a stronger yen and puts a much firmer ceiling on USD/JPY.”
From a technical perspective, the intervention-driven pullback in USD/JPY has weakened the near-term bullish structure, with the pair slipping below key moving averages.
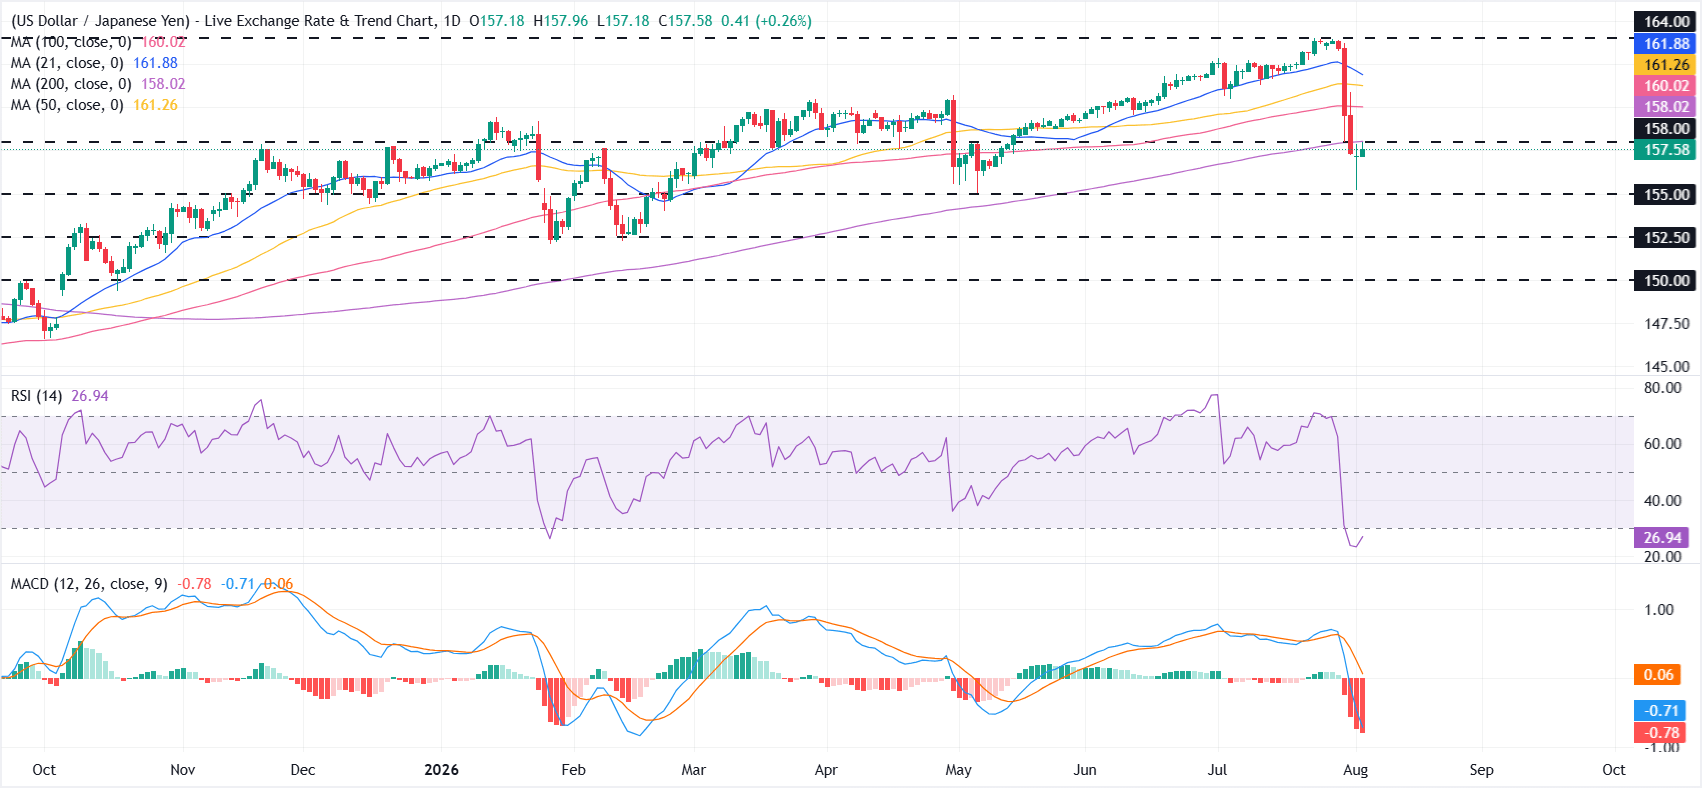
On the daily chart, the 200-day Simple Moving Average (SMA) at 158 offers immediate resistance. Further up, the 100-day SMA at 160 guards the path toward the 50-day SMA at 161.26 and the 21-day SMA at 161.89, ahead of a more distant structural hurdle at 164.
The Relative Strength Index (RSI) at 27 signals oversold conditions, while the Moving Average Convergence Divergence (MACD) remains below zero, reflecting the recent shift in momentum to the downside.
On the downside, the 155.00 psychological mark offers immediate support. A decisive break below this level could expose the 152.50 area, with the 150.00 psychological mark emerging as the next major downside target.
(The technical analysis of this story was written with the help of an AI tool. Know more.)
Japanese Yen Price Today
The table below shows the percentage change of Japanese Yen (JPY) against listed major currencies today. Japanese Yen was the strongest against the Canadian Dollar.
| USD | EUR | GBP | JPY | CAD | AUD | NZD | CHF | |
|---|---|---|---|---|---|---|---|---|
| USD | -0.15% | -0.06% | 0.25% | 0.18% | -0.59% | -0.34% | -0.09% | |
| EUR | 0.15% | 0.06% | 0.44% | 0.32% | -0.45% | -0.22% | 0.07% | |
| GBP | 0.06% | -0.06% | 0.36% | 0.27% | -0.50% | -0.27% | 0.00% | |
| JPY | -0.25% | -0.44% | -0.36% | -0.09% | -0.85% | -0.64% | -0.24% | |
| CAD | -0.18% | -0.32% | -0.27% | 0.09% | -0.77% | -0.55% | -0.26% | |
| AUD | 0.59% | 0.45% | 0.50% | 0.85% | 0.77% | 0.22% | 0.51% | |
| NZD | 0.34% | 0.22% | 0.27% | 0.64% | 0.55% | -0.22% | 0.29% | |
| CHF | 0.09% | -0.07% | -0.01% | 0.24% | 0.26% | -0.51% | -0.29% |
The heat map shows percentage changes of major currencies against each other. The base currency is picked from the left column, while the quote currency is picked from the top row. For example, if you pick the Japanese Yen from the left column and move along the horizontal line to the US Dollar, the percentage change displayed in the box will represent JPY (base)/USD (quote).
추천 기사


