

Crypto Today: Bitcoin, Ethereum, XRP exhibit technical weakness as risk-off sentiment weighs
- Bitcoin steadies above the 100-day EMA support, as market participants digest the Fed’s hawkish hold and Powell’s words.
- Ethereum traders are near the $2,250 short-term support, reflecting growing risk-off sentiment, amid ETF outflows.
- XRP recovery remains an uphill task, as major moving averages define a dominant bearish outlook.
Bitcoin (BTC) holds above a short-term support at $76,000, after extending losses from its weekly high of $79,486, following the Federal Reserve’s (Fed) hawkish tone and uncertainty around the United States (US) peace negotiations with Iran.
Altcoins, including Ethereum (ETH) and Ripple (XRP), continue to lose momentum, breaking below short-term demand zones. Ethereum hovers above $2,250, down from its weekly peak at $2,404, while XRP trades at $1.37, down roughly 5% from its weekly high at $1.45.
Markets assess Fed hawkish tone amid fading risk appetite
The Federal Reserve Open Market Committee (FOMC) left interest rates unchanged for the fourth consecutive cycle in the 3.50%–3.75% range on Wednesday.
What carried more weight was what may have been Fed Chair Jerome Powell’s final press conference as the head of the central bank. In his speech, Powell cited upside risks to inflation driven by global energy prices, with West Texas Intermediate (WTI) trading above $100 at the time of writing.
At the center of high Oil and Gas prices is the conflict in the Middle East, and the uncertainty shrouding peace negotiations. Powell emphasized that the Committee needs to assess the impact of both the energy and tariff shocks before considering easing the current restrictive monetary policy.
In a surprising move, the outgoing Fed Chair announced he will continue to serve as Governor following the upcoming leadership transition. He highlighted that his decision to stay on the board is to ensure that the central bank can “conduct monetary policy without taking into consideration political factors.”
“After my term as chair ends on May 15, I will continue to serve as a governor for a period of time to be determined,” Powell said during the news conference on Wednesday.
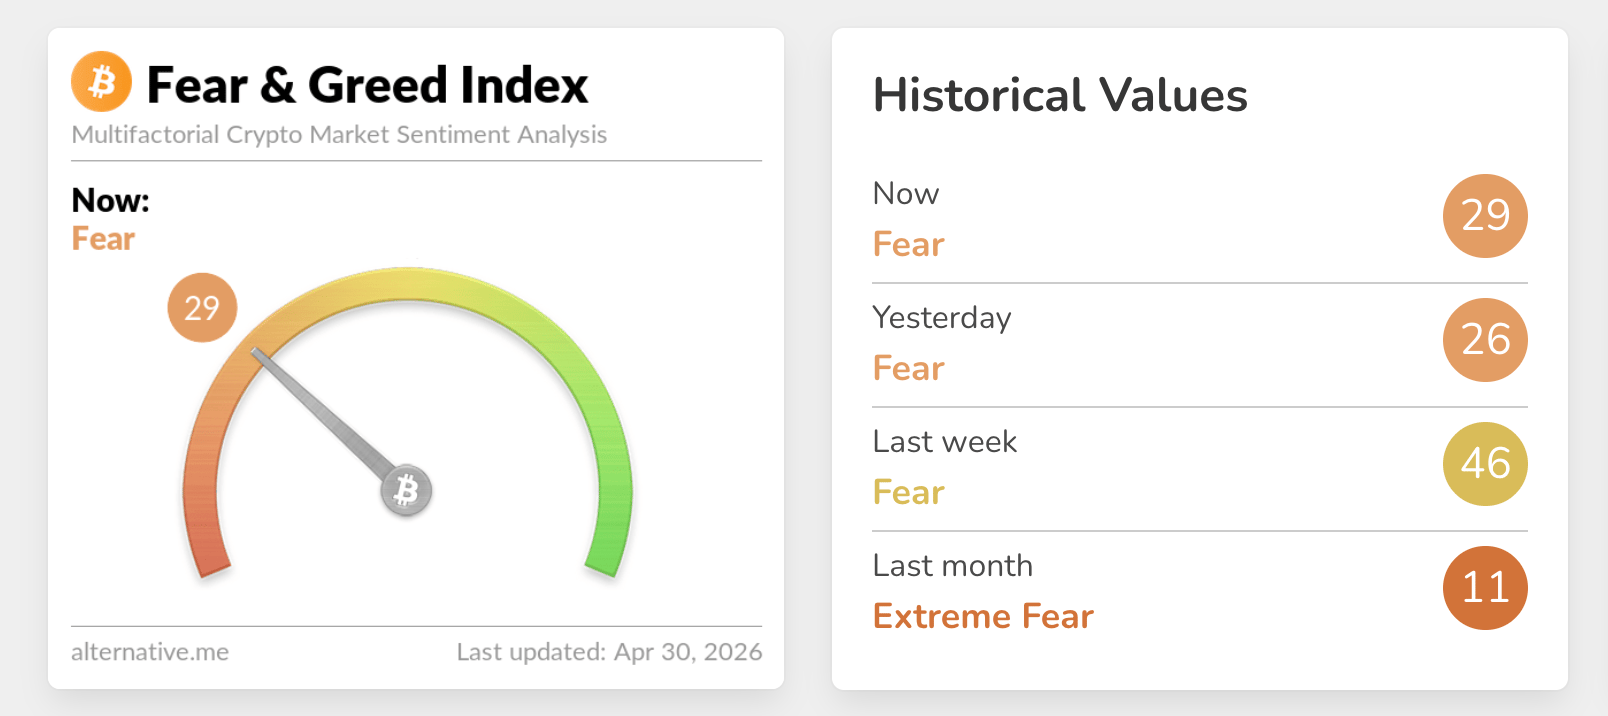
The impact of the Fed’s hawkish stance appears to be weighing on the crypto market, as reflected by the Fear & Greed Index holding at 29, near the lower end of fear territory, down from last week’s average of 46.
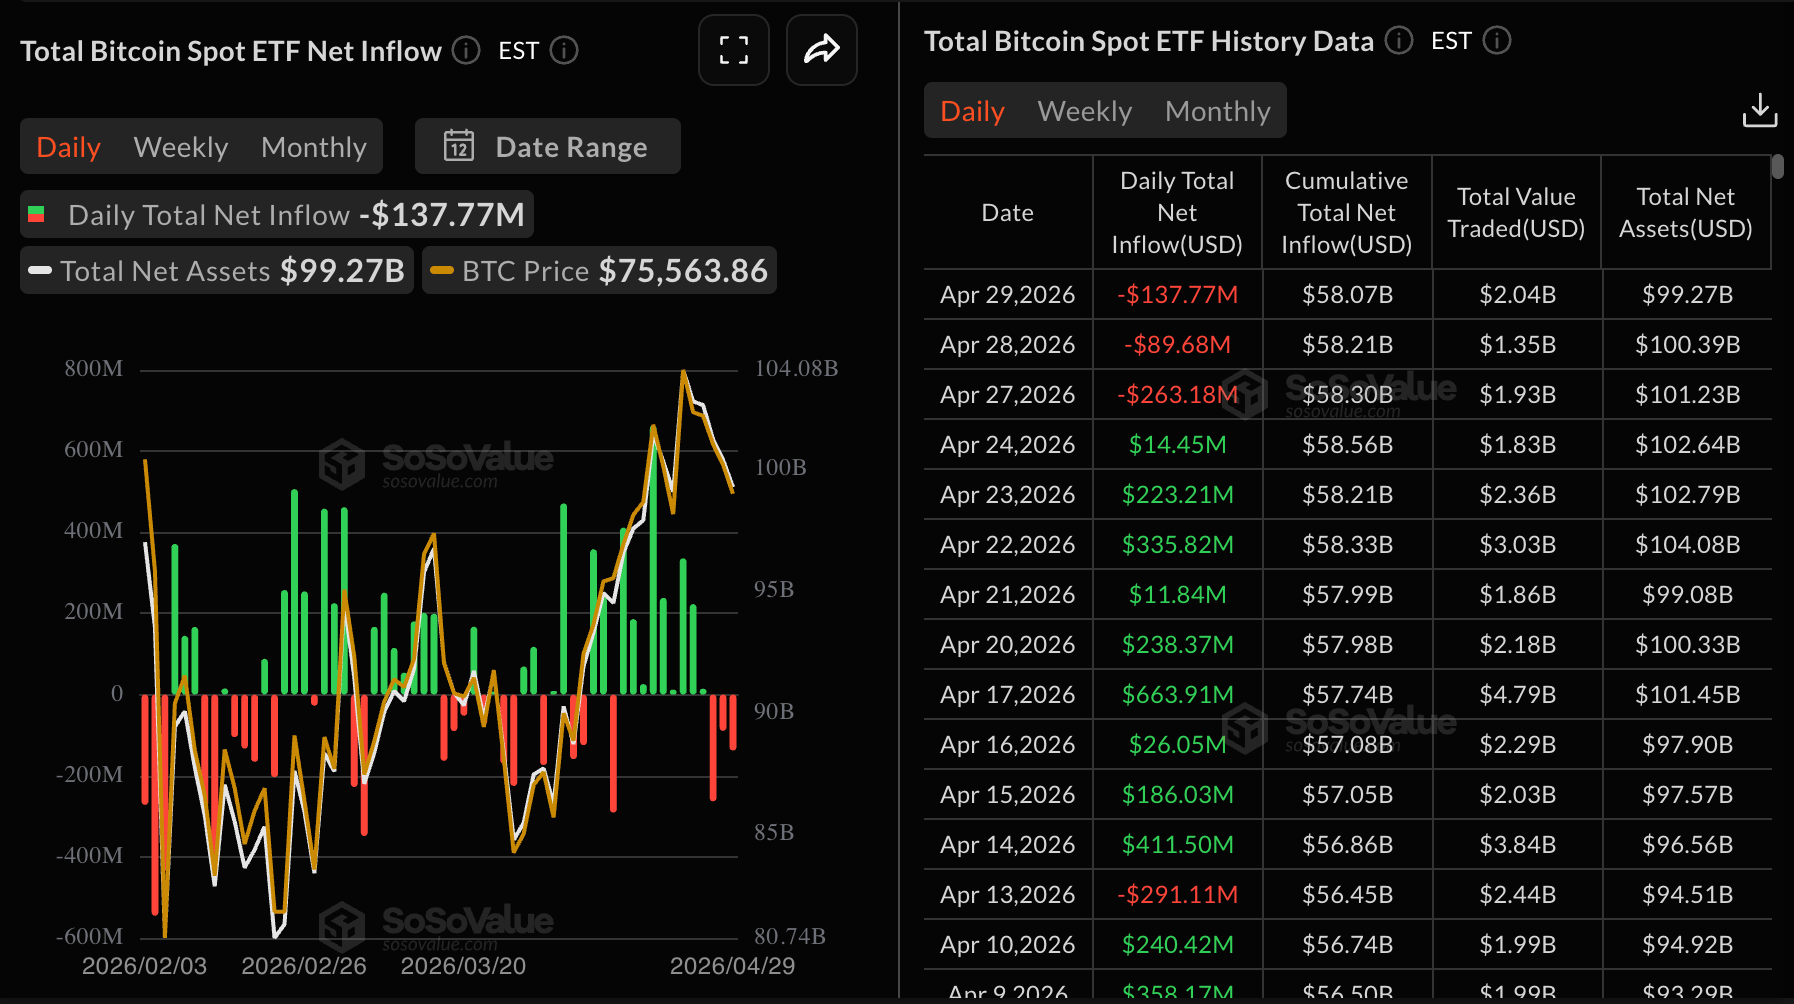
Institutional interest in Bitcoin spot Exchange-Traded Funds (ETFs) has softened this week, with $263 million in outflows on Monday, $90 million on Tuesday, and nearly $138 million on Wednesday.
Cumulative inflows now stand at $58.07 billion, with net assets under management averaging $99.27 billion, according to SoSoValue.
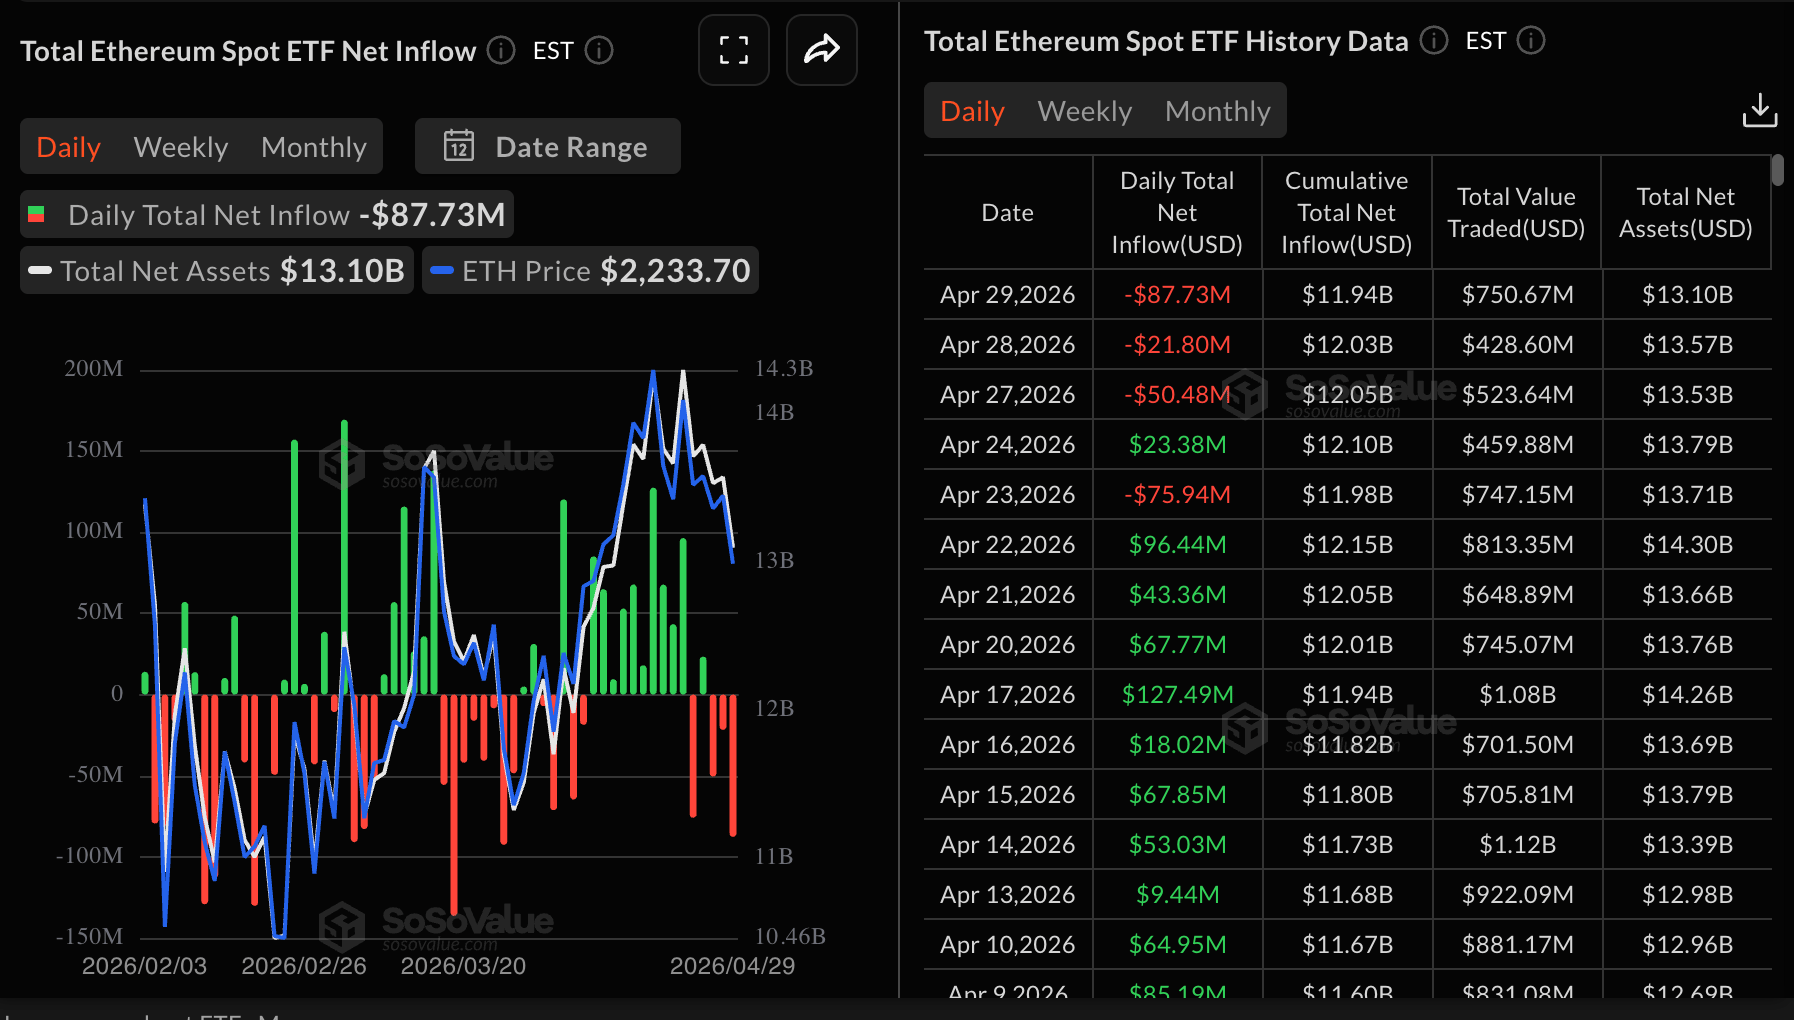
Ethereum spot ETFs also experienced their third consecutive day of outflows totaling $88 million on Wednesday. SoSoValue data shows investors withdrew roughly $50 million on Monday and nearly $22 million on Tuesday. Cumulative inflows sit at $11.94 billion, with assets under management totaling $13.10 billion.
XRP spot ETFs, on the other hand, beat the odds to post mild inflows of $3.59 million on Wednesday, increasing from $2.20 million recorded on Tuesday. Cumulative inflows now stand at $1.30 billion, with net assets under management averaging $1.04 billion.
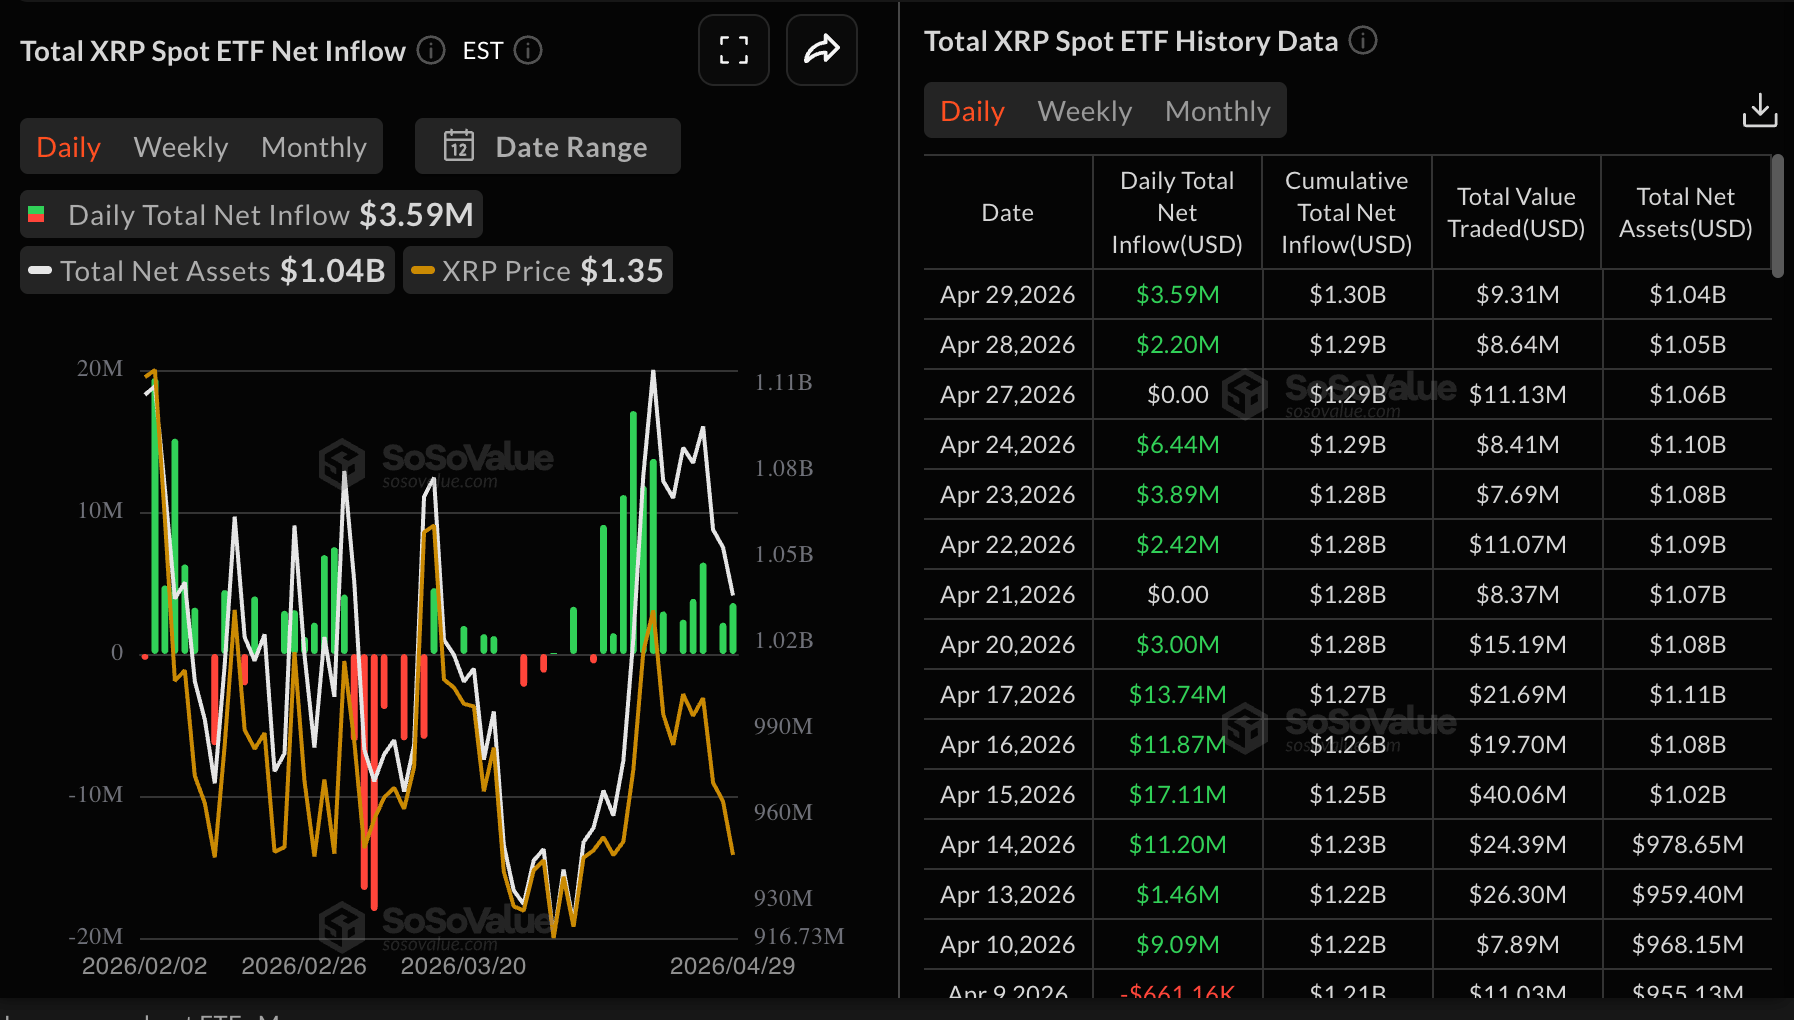
Chart of the day: Bitcoin ticks up, building on key support
Bitcoin trades around $76,137, maintaining a constructive near-term bias as it holds above the 50-day and 100-day Exponential Moving Averages (EMAs) at roughly $73,661 and $75,646, respectively. This suggests underlying buy-the-dip demand despite the broader uptrend flattening.
Momentum is mixed, with the Relative Strength Index (RSI) near 55 on the daily chart and the Money Flow Index (MFI) around 54, hinting at moderate buying interest. The Moving Average Convergence Divergence (MACD) histogram remains in negative territory on the same chart, suggesting that upside momentum is improving but not yet firmly established.
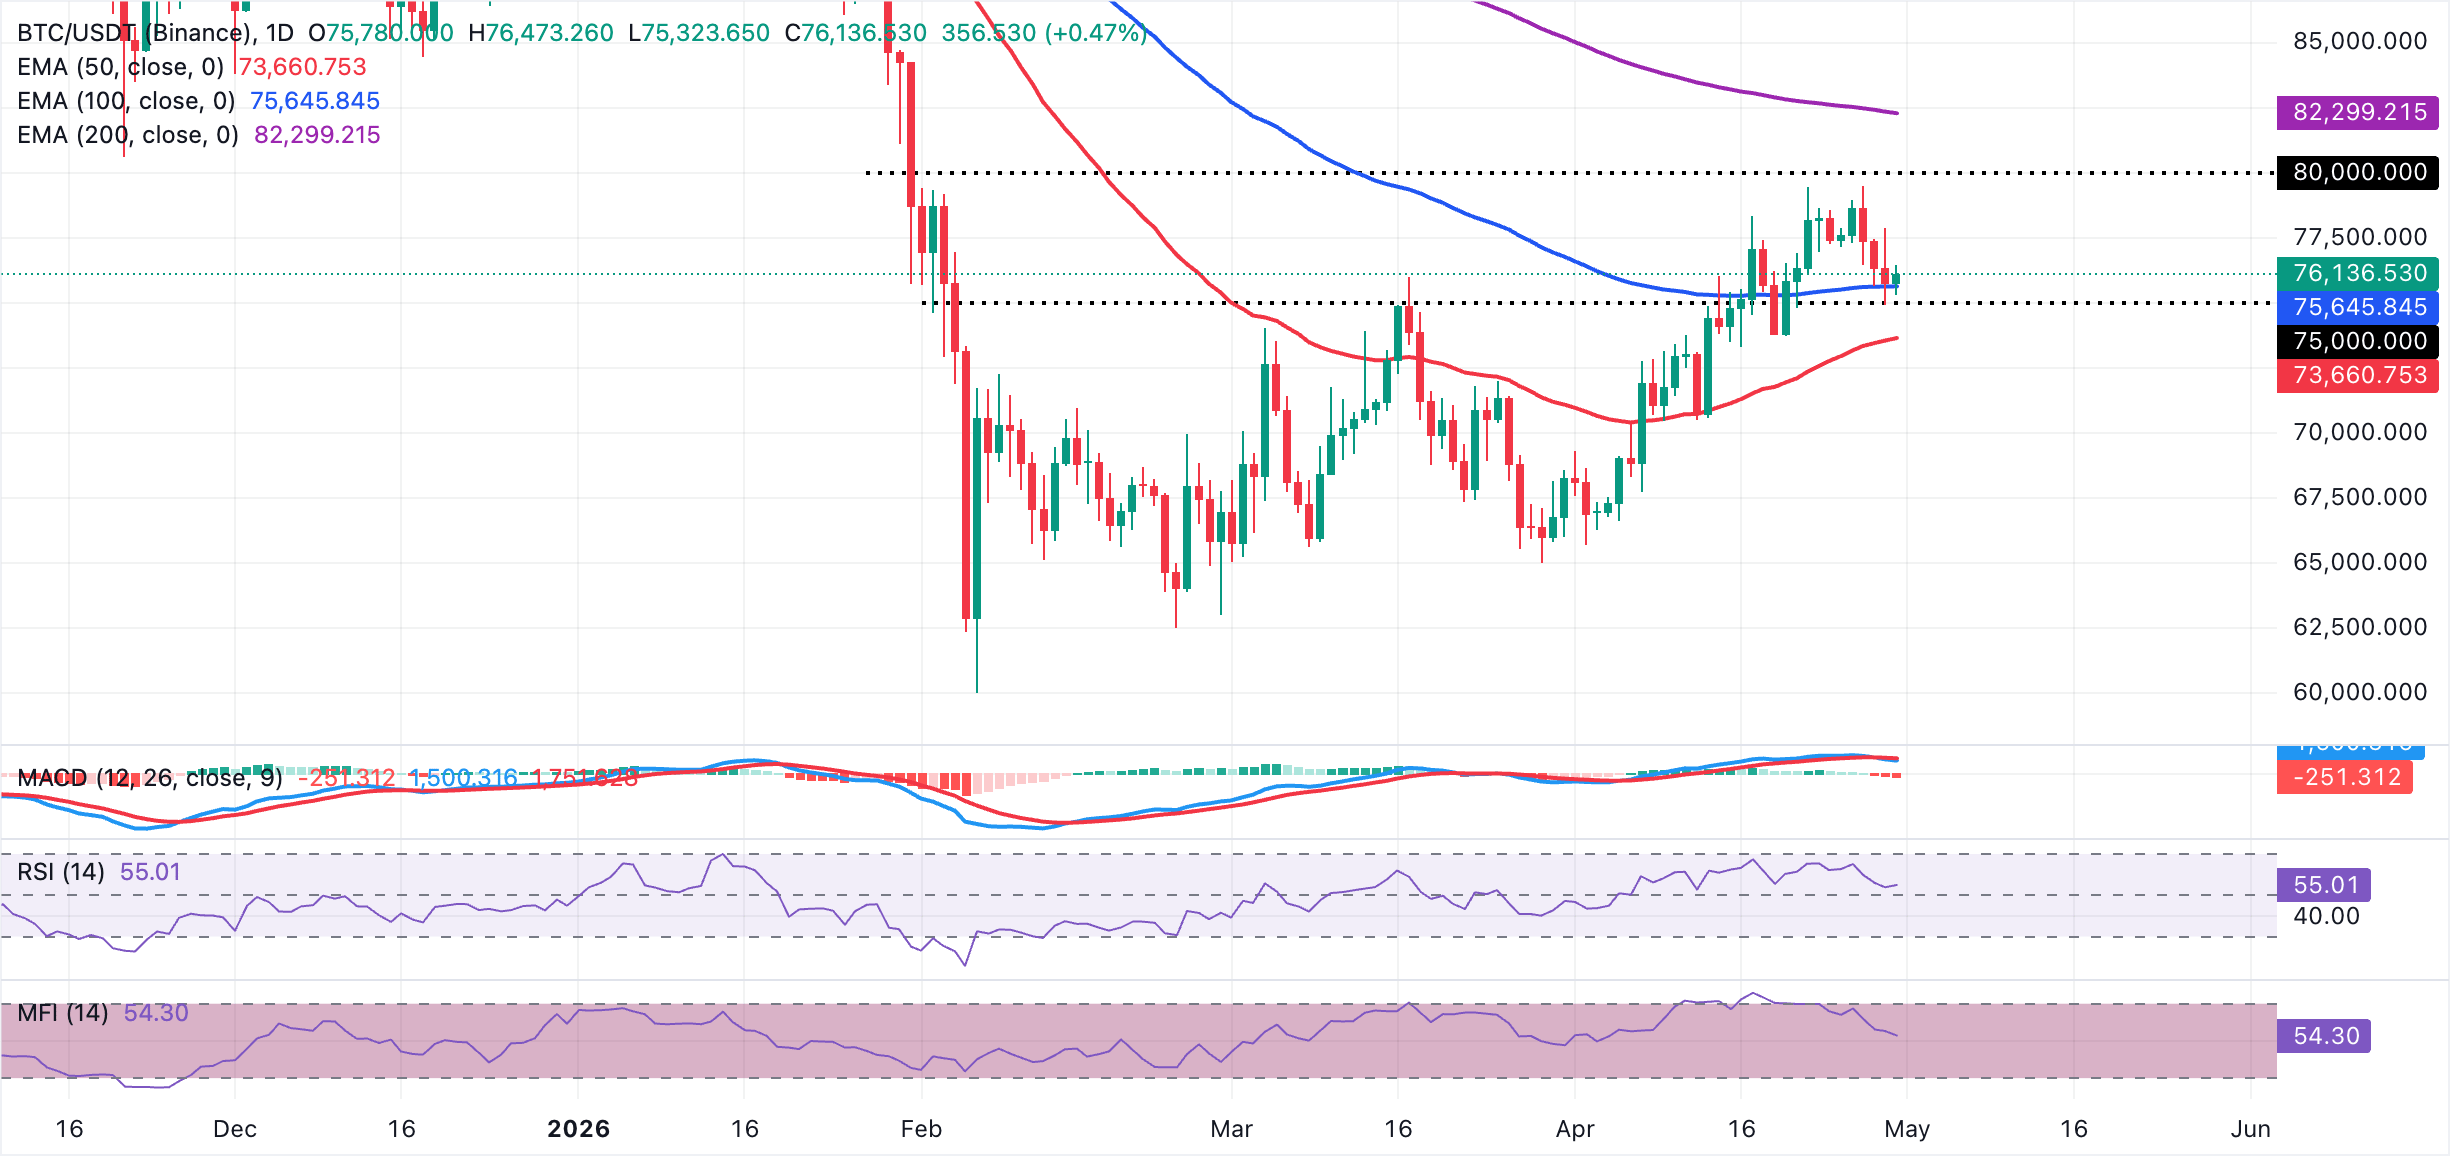
On the topside, the weekly high at $79,486 and the 200-day EMA at about $82,299 are the next significant resistance levels that bulls would need to reclaim to revive a stronger impulsive phase toward new yearly highs. On the downside, initial support is seen at the 100-day EMA near $75,646, with a deeper floor at the 50-day EMA around $73,661. A daily close below this latter band would expose the broader uptrend to a more meaningful correction.
Altcoins technical outlook: Ethereum and XRP struggle as technicals weaken
Ethereum trades at $2,259, maintaining a capped tone as price holds below the 100-day and 200-day (EMAs) at roughly $2,345 and $2,562. The smart contract token is clinging just above the 50-day EMA at $2,244, which acts as immediate dynamic support, but a negative MACD histogram and a sub-50 MFI on the daily chart hint that rallies are being sold into, while the RSI oscillates near neutral territory.
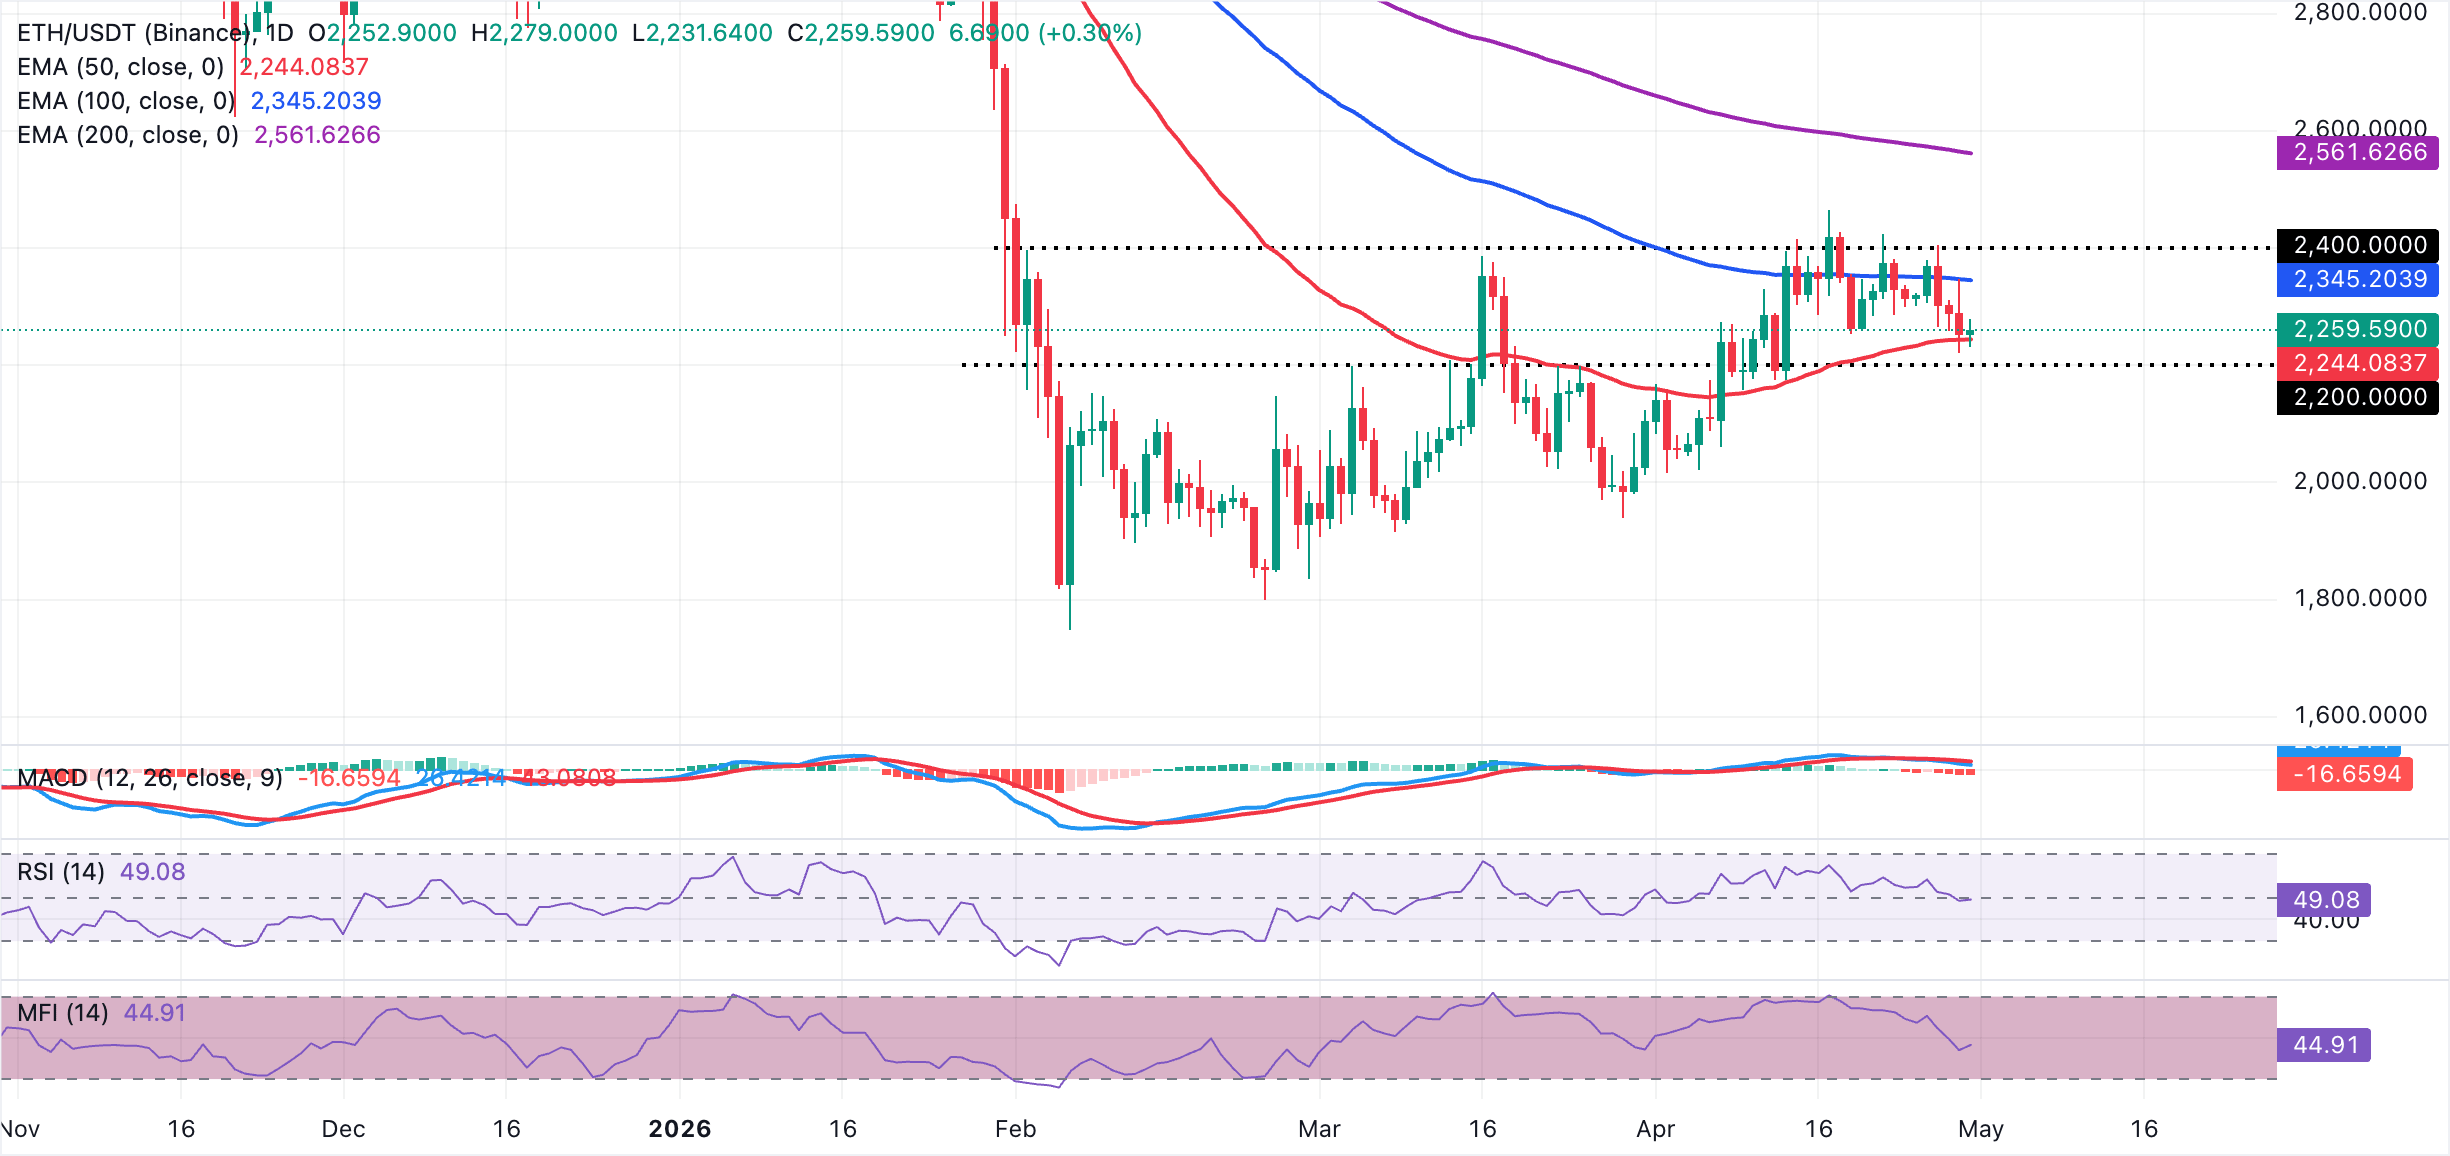
On the topside, initial resistance is seen at the 100-day EMA around $2,345, with a stronger barrier at the 200-day EMA near $2,562. The broader bearish bias is likely to persist while ETH trades beneath this band. On the downside, the 50-day EMA at $2,244 is the first key support. A sustained break below this level would signal a deeper pullback, while holding above it could allow for a corrective bounce toward the overhead averages.
XRP, on the other hand, trades around $1.37, maintaining a bearish near-term bias as price holds below the 50-day, 100-day and 200-day EMAs. This cluster of moving averages, led by the 50-day EMA at $1.41, reinforces overhead supply, while the broader downtrend resistance line, projected from the $1.51 area, adds an additional cap.
Momentum readings are lukewarm, with the RSI near 45 on the daily chart and the MACD histogram below the zero line, suggesting recovery attempts remain vulnerable to renewed selling pressure.
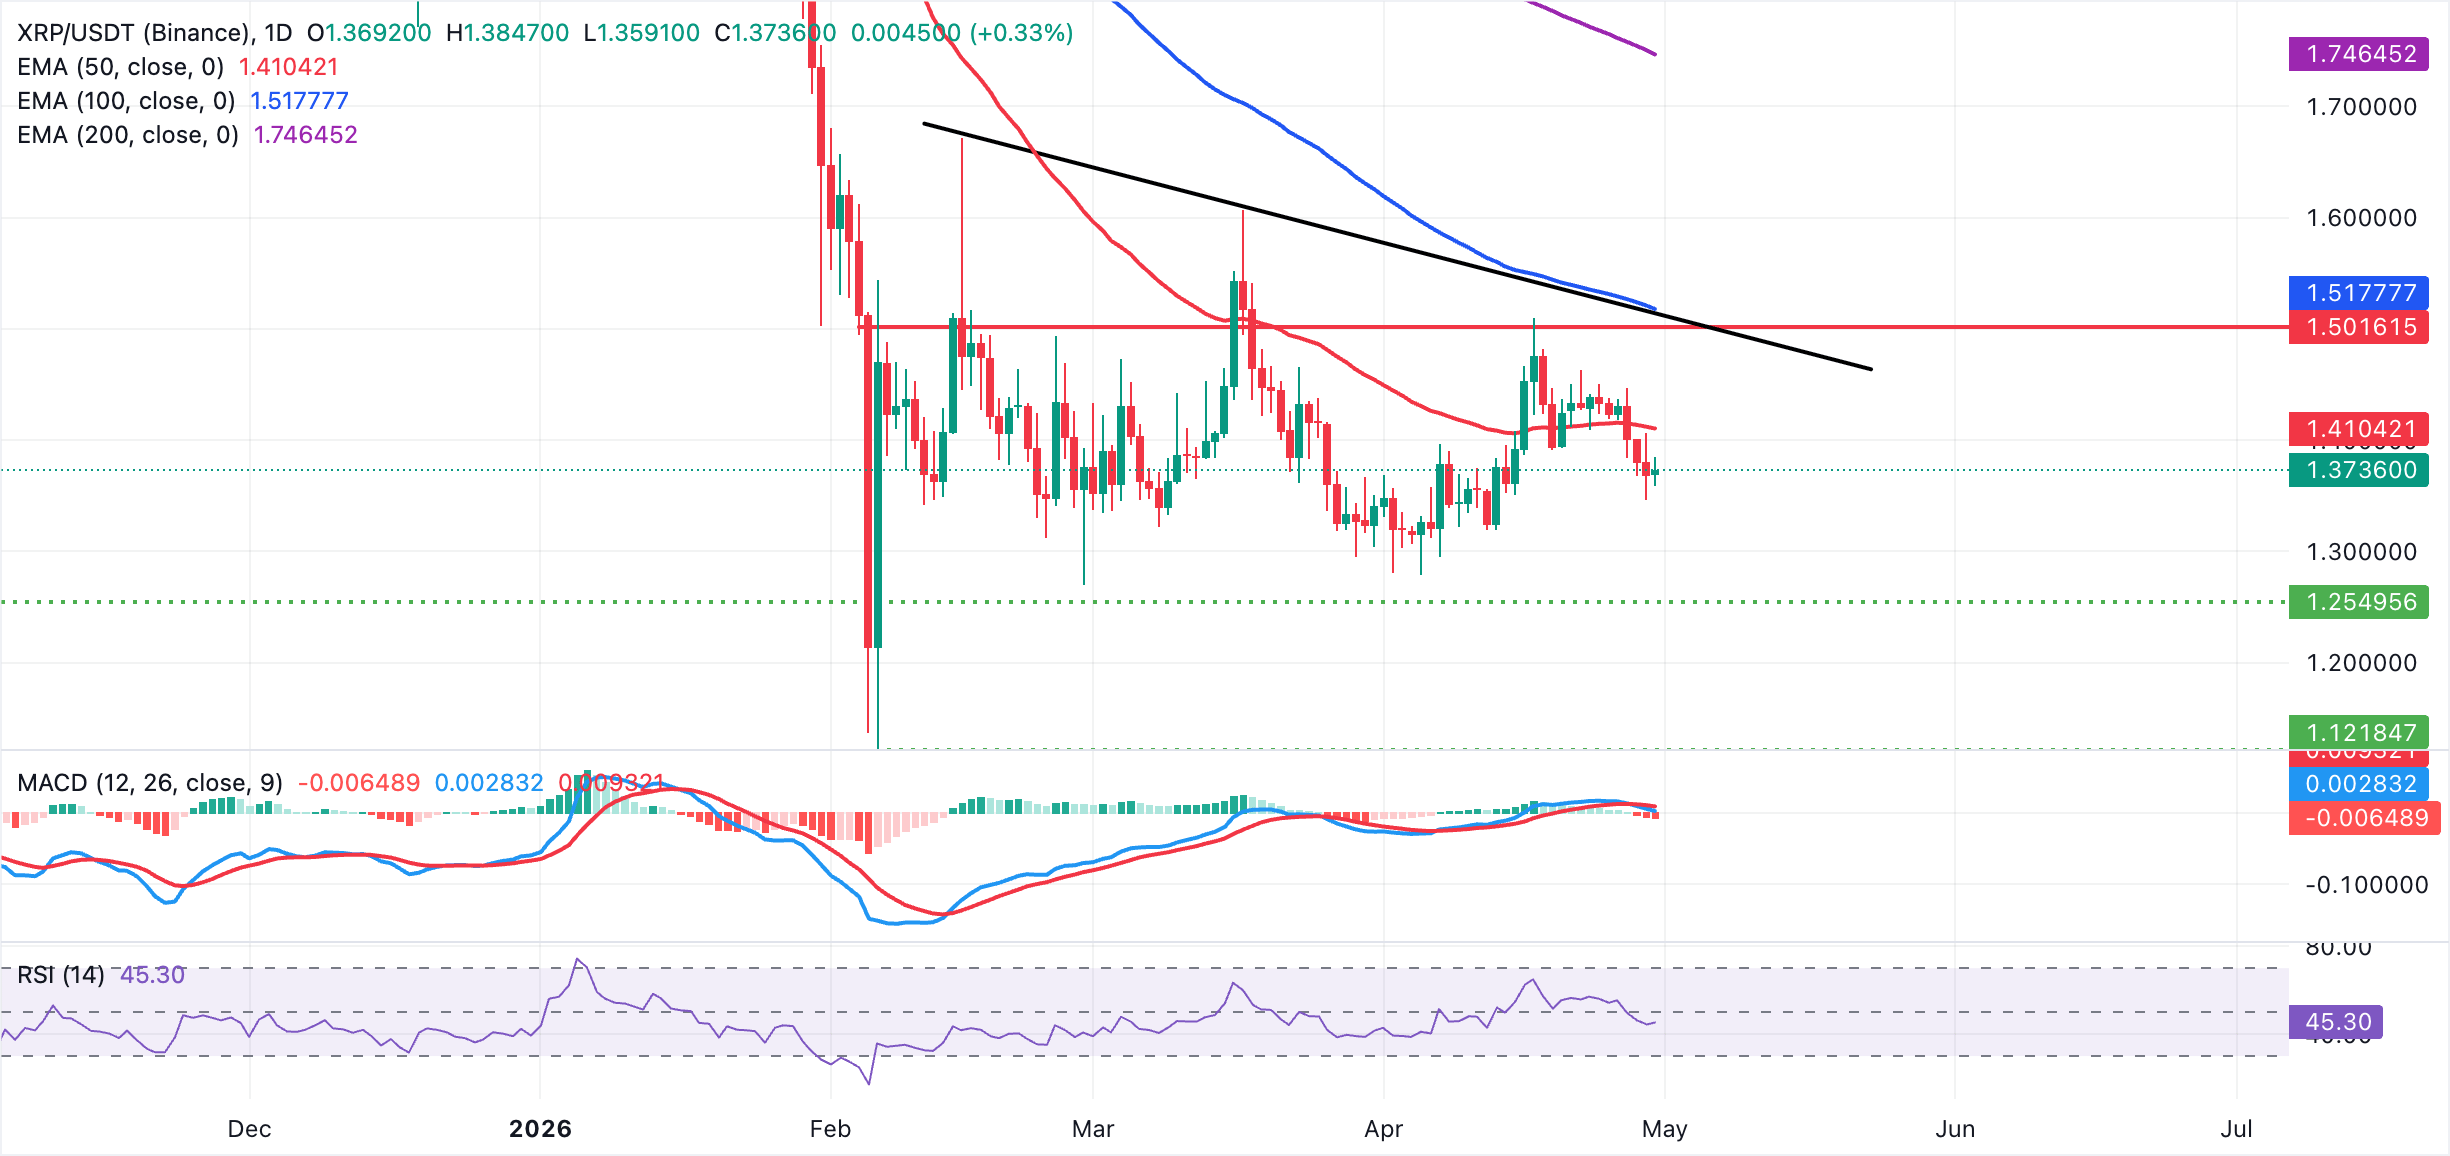
On the topside, immediate resistance lies at the 50-day EMA around $1.41. A daily close above this level would be needed to ease the current downside pressure. Beyond that, the descending resistance line near $1.51 aligns with the 100-day EMA to form a dense barrier, ahead of the more distant 200-day EMA at $1.75, which continues to define the broader bearish structure. Support is seen at $1.35, XRP's weekly low. A decisive close below this level could accelerate the sell-off toward $1.30.
Crypto ETF FAQs
An Exchange-Traded Fund (ETF) is an investment vehicle or an index that tracks the price of an underlying asset. ETFs can not only track a single asset, but a group of assets and sectors. For example, a Bitcoin ETF tracks Bitcoin’s price. ETF is a tool used by investors to gain exposure to a certain asset.
Yes. The first Bitcoin futures ETF in the US was approved by the US Securities & Exchange Commission in October 2021. A total of seven Bitcoin futures ETFs have been approved, with more than 20 still waiting for the regulator’s permission. The SEC says that the cryptocurrency industry is new and subject to manipulation, which is why it has been delaying crypto-related futures ETFs for the last few years.
Yes. The SEC approved in January 2024 the listing and trading of several Bitcoin spot Exchange-Traded Funds, opening the door to institutional capital and mainstream investors to trade the main crypto currency. The decision was hailed by the industry as a game changer.
The main advantage of crypto ETFs is the possibility of gaining exposure to a cryptocurrency without ownership, reducing the risk and cost of holding the asset. Other pros are a lower learning curve and higher security for investors since ETFs take charge of securing the underlying asset holdings. As for the main drawbacks, the main one is that as an investor you can’t have direct ownership of the asset, or, as they say in crypto, “not your keys, not your coins.” Other disadvantages are higher costs associated with holding crypto since ETFs charge fees for active management. Finally, even though investing in ETFs reduces the risk of holding an asset, price swings in the underlying cryptocurrency are likely to be reflected in the investment vehicle too.
(The technical analysis of this story was written with the help of an AI tool.)
추천 기사


