
Bitcoin Price Forecast: BTC extends recovery above $112,000 as sentiment improves
- Bitcoin price extends its recovery on Tuesday for a third consecutive day.
- Traders turn their attention to Nonfarm Payrolls revisions and upcoming US PPI and CPI data for fresh market direction.
- US Bitcoin ETFs record more than $360 million in inflows on Monday.
Bitcoin (BTC) is extending its recovery, trading above $112,500 at the time of writing on Tuesday, after posting nearly 3% gains last week. Improving sentiment supports BTC's recovery, as seen from fresh capital inflows of over $360 million on spot Exchange Traded Funds (ETFs) on Monday. Traders now turn their attention to key US economic data that could provide fresh direction for the cryptocurrency market.
Increasing bets of rate cuts support BTC recovery
Bitcoin price started the week on a positive note, recovering slightly and extending its three consecutive days of gains, briefly trading above $113,000 on Tuesday. A broadly positive mood across global equities and cryptocurrencies persists, after last week's macroeconomic data cemented expectations for a September interest-rate cut by the US Federal Reserve (Fed).
The deteriorating labor market conditions in the US and a higher unemployment rate led market participants to believe that the Fed might lower borrowing costs three times by the end of this year, which boosts risk-on sentiment and supports a recovery in riskier assets such as BTC.
Traders turn their attention to the annual revision of Nonfarm Payrolls at 14:00 GMT, followed by the US Producer Price Index (PPI) and the Consumer Price Index (CPI) data due on Wednesday and Thursday, respectively. These data will provide fresh insights about what the Fed might decide on rates and thus could impact the price of riskier assets such as Bitcoin.
Institutional inflows could support Bitcoin recovery
SoSoValue indicates that Bitcoin spot Exchange Traded Funds (ETFs) recorded an inflow of $368.25 million on Monday, breaking a two-day streak of outflows since last Thursday. If this inflow continues and intensifies, it could help extend Bitcoin’s price recovery.
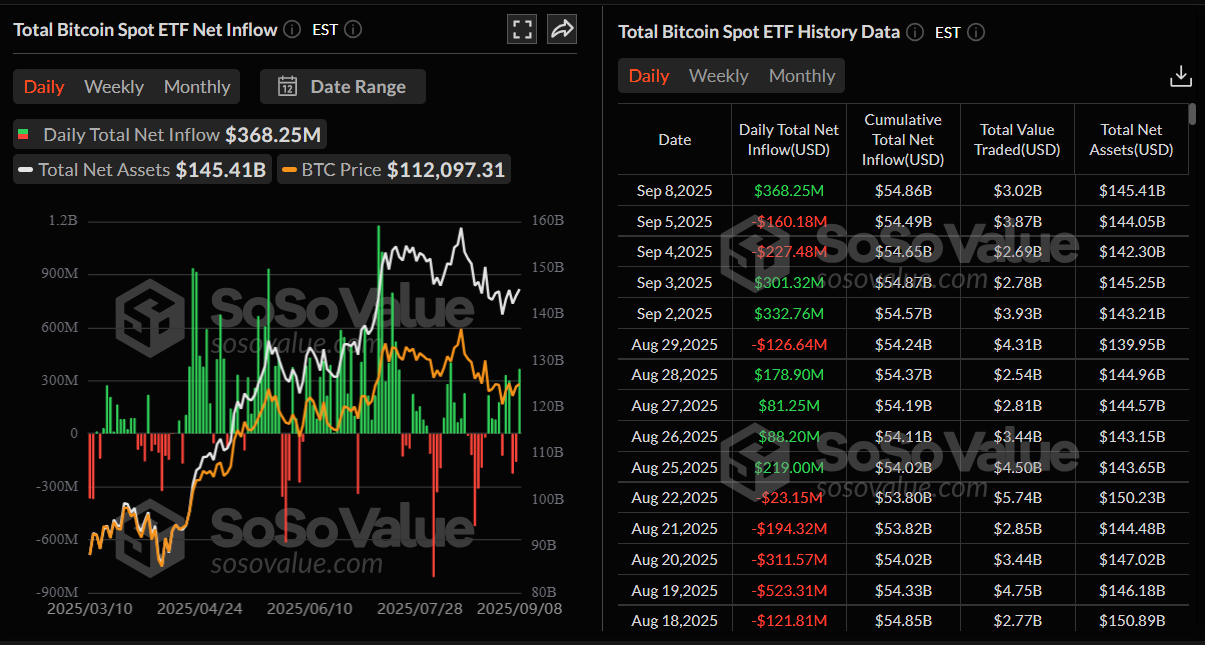
Total Bitcoin Spot ETF Net Inflow chart. Source: SoSoValue
Apart from rising ETF inflows, bullish bets among traders are also rising. CoinGlass’s long-to-short ratio for BTC stands at 1.05 on Tuesday, the highest level in over a month, further supporting the recovery thesis.
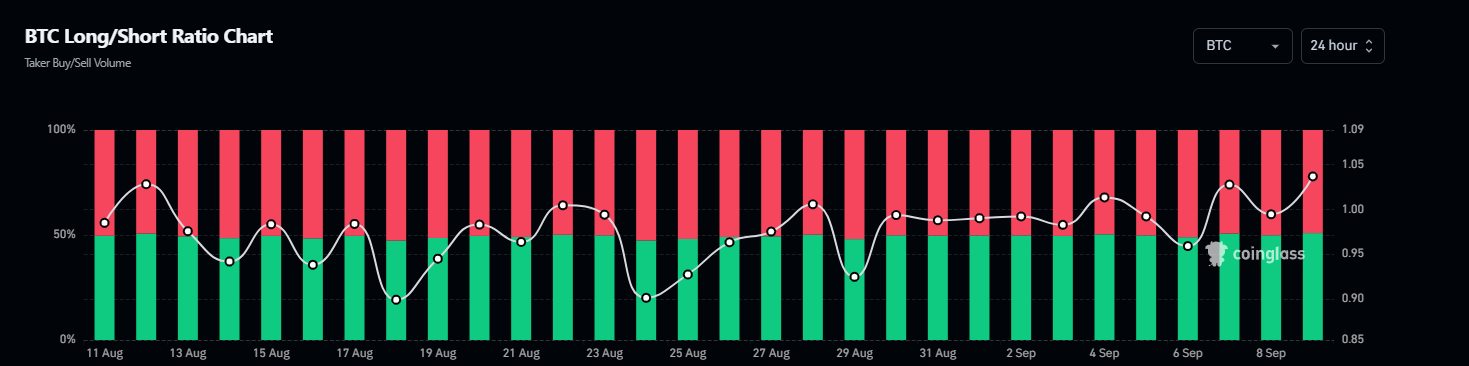
Bitcoin long-to-short ratio chart. Source: Coinglass
Some signs to watch for
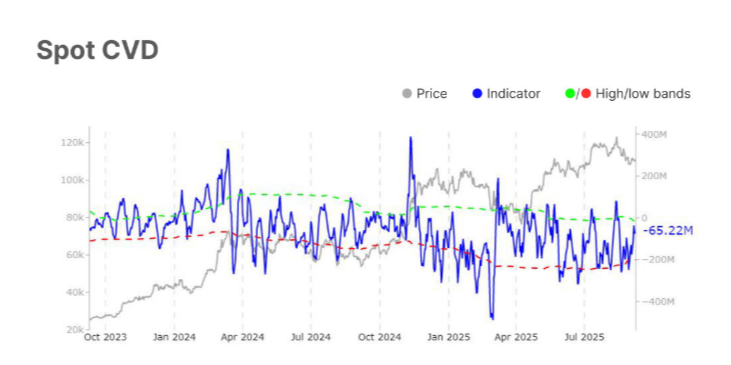
Glassnode’s weekly report released on Tuesday highlights BTC conditions in spot, futures, and options markets.
In the spot market, BTC’s momentum showed a fragile recovery as the Relative Strength Index (RSI) rose toward neutral territory and the Spot Cumulative Volume Delta (CVD) improved, signaling reduced sell pressure (graph below).
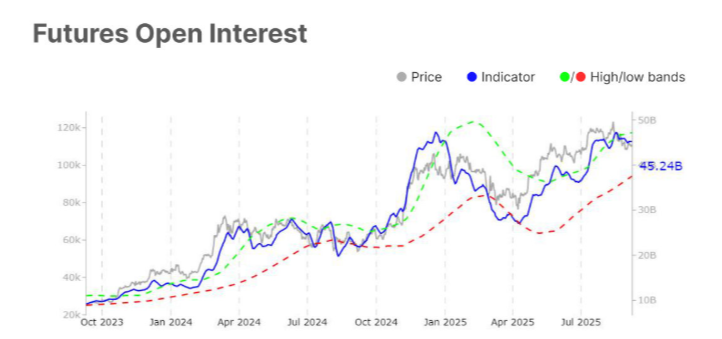
On the futures front, the market reflected stabilization with a mild rise in open interest and a strong recovery in perpetual CVD, suggesting buy-the-dip flows.
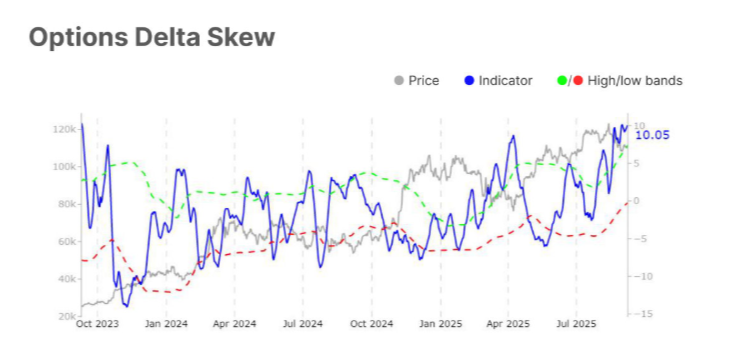
However, in the options market, open interest declined, showing lighter engagement, while volatility spreads narrowed, suggesting calmer expectations. Still, the fact that the 25-delta skew remained elevated indicates persistent demand for downside protection and defensive hedging, the report noted.
The analyst concluded that the market reflects fragile stabilization above the short-term holder cost basis at around the $111,000 mark, with improvements in momentum and profitability offset by lighter volumes and defensive positioning.
"Traders should remain cautious, with sentiment leaning slightly bearish but with scope for short-term bounce-backs if demand re-emerges more decisively," the report said.
Bitcoin Price Forecast: Bulls appear to be taking control
Bitcoin price recovered nearly 3% last week after facing three consecutive weeks of decline from its all-time high of $124,474.
If BTC closes above the 50-day EMA at $112,935 on a daily basis, it could extend the rally toward its daily resistance level at $116,000.
The Relative Strength Index (RSI) is moving above its neutral level of 50, indicating early signs of bullish momentum. The Moving Average Convergence Divergence (MACD) showed a bullish crossover on Saturday, giving a buy signal and supporting the bullish view.
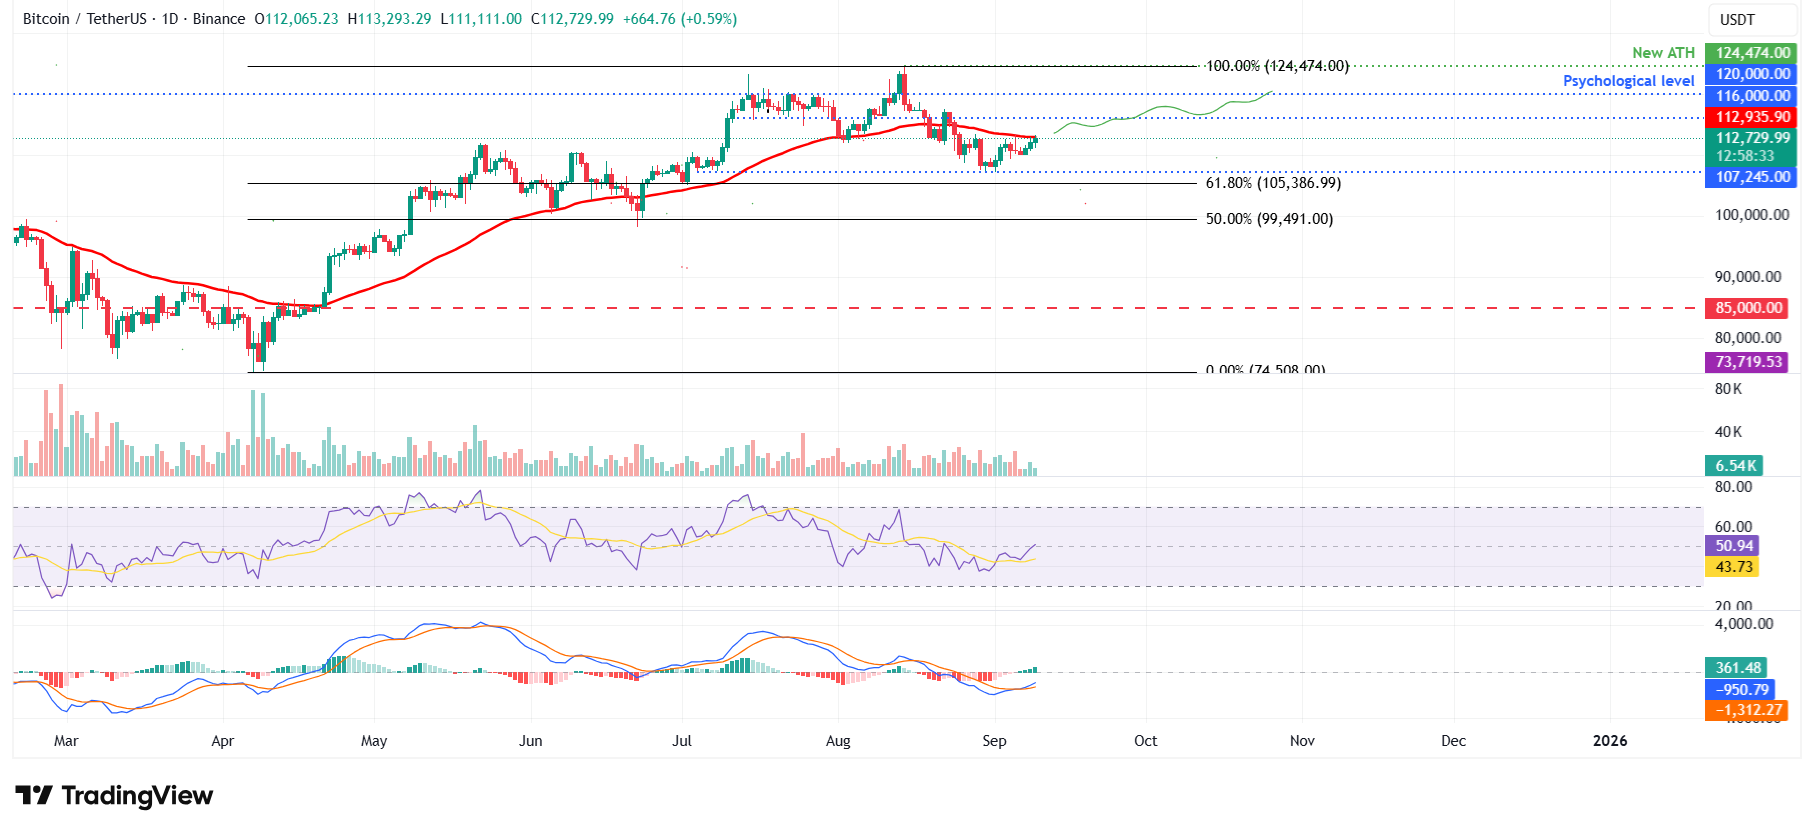
BTC/USDT daily chart
If BTC faces a correction, it could extend the decline toward its daily support at $107,245.
Crypto ETF FAQs
An Exchange-Traded Fund (ETF) is an investment vehicle or an index that tracks the price of an underlying asset. ETFs can not only track a single asset, but a group of assets and sectors. For example, a Bitcoin ETF tracks Bitcoin’s price. ETF is a tool used by investors to gain exposure to a certain asset.
Yes. The first Bitcoin futures ETF in the US was approved by the US Securities & Exchange Commission in October 2021. A total of seven Bitcoin futures ETFs have been approved, with more than 20 still waiting for the regulator’s permission. The SEC says that the cryptocurrency industry is new and subject to manipulation, which is why it has been delaying crypto-related futures ETFs for the last few years.
Yes. The SEC approved in January 2024 the listing and trading of several Bitcoin spot Exchange-Traded Funds, opening the door to institutional capital and mainstream investors to trade the main crypto currency. The decision was hailed by the industry as a game changer.
The main advantage of crypto ETFs is the possibility of gaining exposure to a cryptocurrency without ownership, reducing the risk and cost of holding the asset. Other pros are a lower learning curve and higher security for investors since ETFs take charge of securing the underlying asset holdings. As for the main drawbacks, the main one is that as an investor you can’t have direct ownership of the asset, or, as they say in crypto, “not your keys, not your coins.” Other disadvantages are higher costs associated with holding crypto since ETFs charge fees for active management. Finally, even though investing in ETFs reduces the risk of holding an asset, price swings in the underlying cryptocurrency are likely to be reflected in the investment vehicle too.
추천 기사


