

Silver Price Forecast: XAG/USD surges to near $33 as US yields plunge ahead of US elections
- Silver price climbs to near $33.00 as traders brace for fierce us Trump-Harris battle.
- Lower US bond yields have prompted a strong recovery in the Silver price.
- The Fed is expected to cut interest rates by 25 bps on Thursday.
Silver price (XAG/USD) soars to near $33.00 in Monday’s North American session. The white metal strengthens as US Treasury yields dive, with investors turning anxious ahead of the United States (US) presidential elections on Tuesday.
10-year US Treasury yields plummet to near 4.27%. Lower yields on interest-bearing assets reduce the opportunity cost of holding an investment in non-yielding assets, such as Silver. The US Dollar Index (DXY), which gauges Greenback’s value against six major currencies, slumps to near 10.70, the lowest level seen in two weeks.
The uncertainty over US elections deepened after the Des Moines Register/Mediacom Iowa Poll, which showed current Vice President Kamala Harris is up three points on Trump in the state, Reuters reported. This has appeared a major shift in market expectations, which were pointing to Trump’s victory.
This week, investors should be prepared for more volatility that will come from Federal Reserve (Fed) monetary policy, which will be announced on Thursday. According to the CME FedWatch tool, the central bank is widely anticipated to cut interest rates by 25 basis points (bps) to 4.50%-4.75%. This will be the second interest rate cut by the Fed in a row, however, the pace will be slower as policymakers voted a bigger rate cut of 50 bps in September.
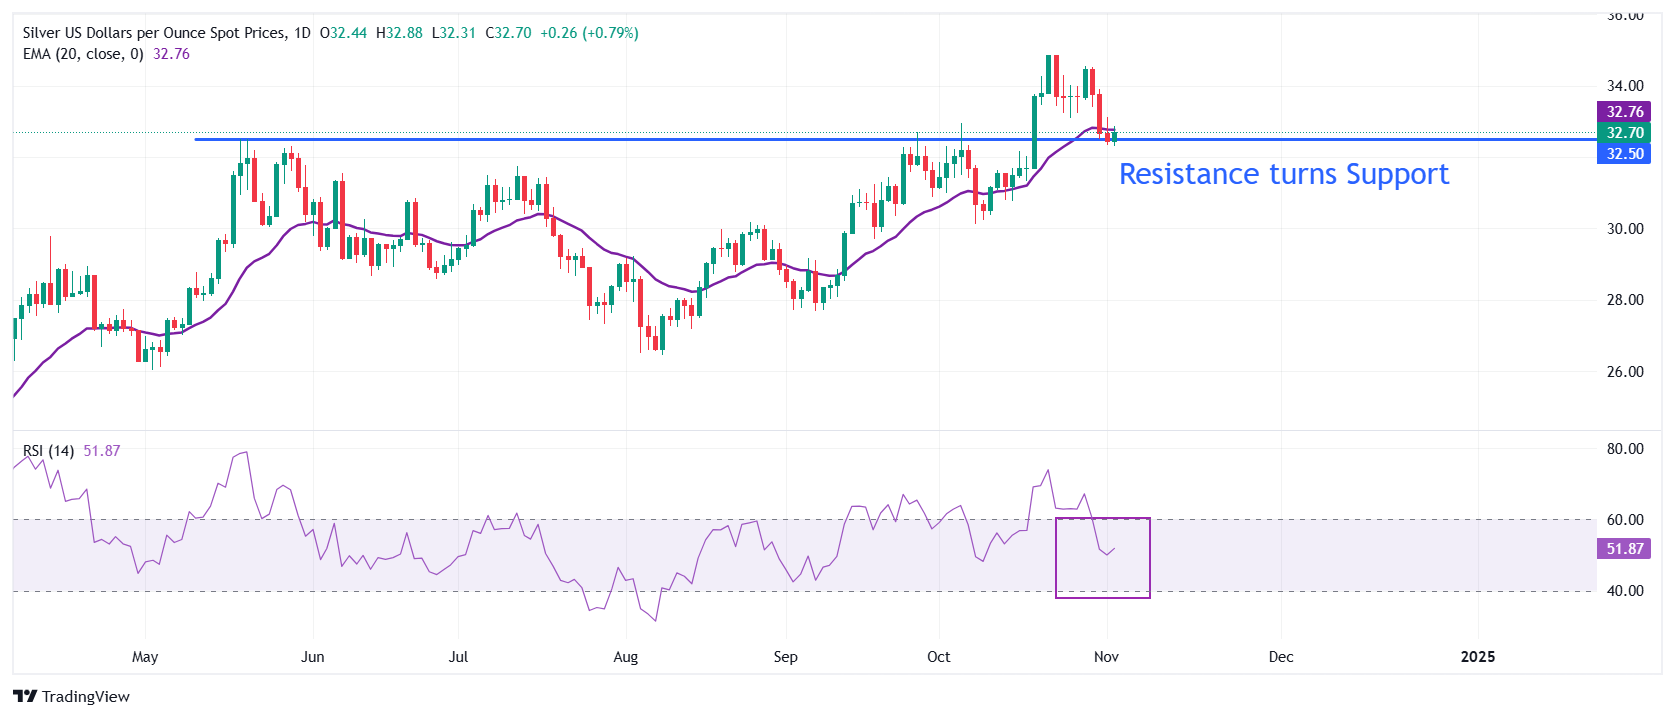
Silver technical analysis
Silver price discovers strong buying interest near the key horizontal support plotted from the May 20 high of $32.50 on a daily timeframe, which acted as resistance earlier. The white metal finds a temporary cushion near the 20-day Exponential Moving Average (EMA), which trades at around $32.80.
The 14-day Relative Strength Index (RSI) falls inside the 40.00-60.00 range, suggesting that a bullish momentum is over for now, however, the bullish trend remains intact.
Silver daily chart
Silver FAQs
Silver is a precious metal highly traded among investors. It has been historically used as a store of value and a medium of exchange. Although less popular than Gold, traders may turn to Silver to diversify their investment portfolio, for its intrinsic value or as a potential hedge during high-inflation periods. Investors can buy physical Silver, in coins or in bars, or trade it through vehicles such as Exchange Traded Funds, which track its price on international markets.
Silver prices can move due to a wide range of factors. Geopolitical instability or fears of a deep recession can make Silver price escalate due to its safe-haven status, although to a lesser extent than Gold's. As a yieldless asset, Silver tends to rise with lower interest rates. Its moves also depend on how the US Dollar (USD) behaves as the asset is priced in dollars (XAG/USD). A strong Dollar tends to keep the price of Silver at bay, whereas a weaker Dollar is likely to propel prices up. Other factors such as investment demand, mining supply – Silver is much more abundant than Gold – and recycling rates can also affect prices.
Silver is widely used in industry, particularly in sectors such as electronics or solar energy, as it has one of the highest electric conductivity of all metals – more than Copper and Gold. A surge in demand can increase prices, while a decline tends to lower them. Dynamics in the US, Chinese and Indian economies can also contribute to price swings: for the US and particularly China, their big industrial sectors use Silver in various processes; in India, consumers’ demand for the precious metal for jewellery also plays a key role in setting prices.
Silver prices tend to follow Gold's moves. When Gold prices rise, Silver typically follows suit, as their status as safe-haven assets is similar. The Gold/Silver ratio, which shows the number of ounces of Silver needed to equal the value of one ounce of Gold, may help to determine the relative valuation between both metals. Some investors may consider a high ratio as an indicator that Silver is undervalued, or Gold is overvalued. On the contrary, a low ratio might suggest that Gold is undervalued relative to Silver.
추천 기사


